www.nature.com/scientificreports
OPEN
received: 03 July 2015 accepted: 12 January 2016 Published: 09 February 2016
Using a Machine Learning Approach to Predict Outcomes after Radiosurgery for Cerebral Arteriovenous Malformations Eric Karl Oermann1,*, Alex Rubinsteyn2,*, Dale Ding3, Justin Mascitelli1, Robert M. Starke3, Joshua B. Bederson1, Hideyuki Kano4, L. Dade Lunsford4, Jason P. Sheehan3, Jeffrey Hammerbacher2 & Douglas Kondziolka5 Predictions of patient outcomes after a given therapy are fundamental to medical practice. We employ a machine learning approach towards predicting the outcomes after stereotactic radiosurgery for cerebral arteriovenous malformations (AVMs). Using three prospective databases, a machine learning approach of feature engineering and model optimization was implemented to create the most accurate predictor of AVM outcomes. Existing prognostic systems were scored for purposes of comparison. The final predictor was secondarily validated on an independent site’s dataset not utilized for initial construction. Out of 1,810 patients, 1,674 to 1,291 patients depending upon time threshold, with 23 features were included for analysis and divided into training and validation sets. The best predictor had an average area under the curve (AUC) of 0.71 compared to existing clinical systems of 0.63 across all time points. On the heldout dataset, the predictor had an accuracy of around 0.74 at across all time thresholds with a specificity and sensitivity of 62% and 85% respectively. This machine learning approach was able to provide the best possible predictions of AVM radiosurgery outcomes of any method to date, identify a novel radiobiological feature (3D surface dose), and demonstrate a paradigm for further development of prognostic tools in medical care. Predicting the outcome of a specific patient treated with a particular therapy is fundamental to medical practice. In the case of cerebral arteriovenous malformations (AVMs), several scoring systems have been developed to augment clinician experience in predicting individual patient outcomes after treatment with radiosurgery, a type of highly focused radiation therapy1–8. These outcomes, including the probability of treatment success, the expected morbidity associated with a given therapy, and the expected latency period between treatment and obliteration, all factor into the clinical decision to treat AVMs with surgery, embolization, radiosurgery, or a multimodal approach7–16. The degree to which we can improve upon currently available classification systems for predicting AVM treatment outcomes is unknown. Machine learning is an interdisciplinary field combining computer science and mathematics to develop models with the intent of delivering maximal predictive accuracy17. Combining these new analytical tools with modern clinical databases and registries promises an entirely new approach towards conducting medical research and, ideally, developing ways to predict individual outcomes and the risk to benefit profiles from specific therapies18. In the present study, our aims are to (1) apply a machine learning approach towards predicting individual patient outcomes after AVM radiosurgery and (2) analyze the predictive capability of existing grading systems for AVM patients treated with radiosurgery.
1
Department of Neurosurgery, Icahn School of Medicine at Mount Sinai, New York City, NY, USA. 2Department of Genetics and Genomic Sciences, Icahn School of Medicine at Mount Sinai, New York City, NY, USA. 3Department of Neurosurgery, University of Virginia Medical Center, Charlottesville, VA, USA. 4Department of Neurosurgery, University of Pittsburgh Medical Center, Pittsburgh, PA, USA. 5Department of Neurosurgery, New York University Langone Medical Center, New York City, NY, USA. *These authors contributed equally to this work. Correspondence and requests for materials should be addressed to D.K. (email:
[email protected]) Scientific Reports | 6:21161 | DOI: 10.1038/srep21161
1
www.nature.com/scientificreports/
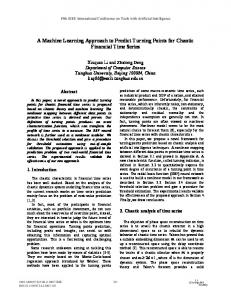
Figure 1. Flow chart of data assembly, processing, and analysis. Patients were gathered from two independently maintained, prospective AVM radiosurgery databases. Both databases were integrated into a single dataset of 1,810 patients described by 23 features. The features were divided into an arbitrary number of bootstrap training and testing samples (N = 100). After data pre-processing including standardization and normalization, an iterative process of feature engineering, feature selection, predictor generation and assessment was instituted. After a satisfactory set of features was selected, a hyperparameter optimization routine was utilized, and four final predictors were trained and cross-validated on the dataset. The predictors included a logistic regression model, a random forests model, a stochastic gradient descent model, and a support vector machine model. Existing clinical models of AVM outcomes were also tested on the dataset, including the Spetzler-Martin scale (SM), modified Radiosurgery Based AVM Score (RBAS), and Virginia Radiosurgery AVM Scale (VRAS).
Results
Data and analysis pipeline. Of the 1,810 patients, a varying number were excluded for incomplete base-
line data or failure to achieve the endpoint by a given time threshold leaving 1,291–1,674 patients at each time threshold with complete 23 feature profiles which were graded utilizing current prognostic models for AVM radiosurgery outcomes (RBAS, VRAS, SM) (Fig. 1, Table 1). Of the patients considered as having been obliterated, 76.8% were confirmed with cerebral angiography, while 23% were noted on magnetic resonance imaging (MRI) only. The 1,442 patients were randomly sorted 2:1 into 100 training and testing sets of 961 and 481 patients, respectively (Table 2).
Feature selection. After pre-processing and feature engineering, the automatically generated features failed
to yield any appreciable benefit and were subsequently dropped, leaving 23 features for use in classifier construction (Table 3). The top three features in the LR predictor at every time point were maximum diameter (frequency = 1), prior embolization (frequency range = 0.88–1), and margin dose (frequency range = 0.92–0.97). The top five features at eight years were equivalent to the top five features at six years: (1) maximum diameter, (2) prior embolization, (3) margin dose, (4) number of isocenters, and (5) brainstem location. These were also, on average, the most useful features across all time points. For predicting obliteration at two years, a notably different set of features was most useful: (1) maximum diameter, (2) prior embolization, (3) margin dose, (4) 3D surface dose, and (5) isodose. 3D surface dose did not contribute significantly to predictor performance, with the exception of margin dose at the two-year time point. Various locations were always present in a large number of models, with more important locations including brainstem (frequency range = 0.63–0.96), thalamus (frequency range = 0.75–0.88), and temporal lobe (frequency range = 0.68–0.91).
Predictor accuracy at predicting favorable outcomes. The median time to a favorable outcome was 4.2 years (95% CI 3.8–4.7 years; Fig. 2). Predictors were optimized and subsequently tested on the AVM dataset utilizing the previously mentioned features. Without hyperparameter optimization, LR provided superior classification results in numerous trials. However, with optimization, all classifiers were able to obtain similarly good results (Fig. 3). At all follow-up time points, the LR predictor had superior AUC compared to the VRAS, SM grade, and RBAS (Fig. 4). The LR predictor additionally continued to outperform existing models on the heldout dataset from Site #3 (Fig. 5). The LR predictor delivered superior predictive accuracy compared to existing clinical models with an AUC of 0.70 (95% CI 0.67–0.73) at four years, which was relatively constant at all times points (Fig. 6). The VRAS had a steady gain in accuracy over time, with an AUC at two, three, four, six, and eight years of 0.65, 0.64, 0.67, 0.68, and 0.69, respectively. Using four years as an example time point, the LR predictor had an AUC of 0.70 (95% CI 0.67–0.73), the VRAS of 0.67 (95% CI 0.64–0.70), RBAS of 0.60 (95% CI 0.57–0.63), and SM of 0.61 (95% CI 0.58–0.64). Scientific Reports | 6:21161 | DOI: 10.1038/srep21161
2
www.nature.com/scientificreports/ Prognostic Scoring System
Feature List
Feature type
Original Model/Predictor
A: Summary of existing prognostic systems SM Classification1
RBAS1
VRAS1
Maximum nidus diameter
Categorical: 1–3
Location (± critical function)
Binary: 0, 1
Venous drainage
Binary: 0, 1
Volume
Continuous
Location (deep vs superficial)
Binary: 0, 1
Age
Continuous
Volume
Categorical: 0–2
Location ( ± critical function)
Binary: 0, 1
History of hemorrhage
Binary: 0, 1
Quadratic regression (∑ features)
Linear regression (∑ weighted features)
Logistic regression (∑ features)
B: Number of patients at each time threshold Time Threshold
Number of patients
Year 2
1674
Year 3
1586
Year 4
1442
Year 5
1386
Year 6
1340
Year 7
1308
Year 8
1291
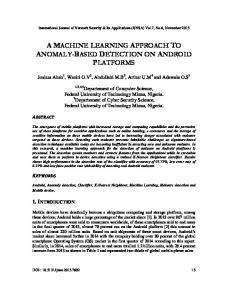
Table 1. (A) A summary of existing prognostic systems. Many existing prognostic systems utilize a similar feature set, but differ considerably in their types (continuous vs categorical) and in the predictors constructed with those features in the original manuscripts. (B) A summary of the number of patients at each time threshold with patients not having complete data at each threshold being censored. 1SM = Spetzler-Martin; RBAS = modified radiosurgery-based AVM score; VRAS = Virginia radiosurgery AVM scale.
Compared to alternative linear, ensemble, and support vector techniques, the LR predictor obtained similar results (Fig. 3). At six years, LR had an AUC of 0.72 (95% C.I. 0.68–075), compared to RF at 0.70 (95% C.I. 0.67–0.73), and SVM at 0.62 (95% C.I. 0.56–0.68). The relative performance of all predictors was similar across all time points, despite the difference in predictive algorithms and feature utilization between each technique. Site #3 had 60 patients with at least four years of clinical follow-up. When ML predictors were tested at four years, the best performing aws the LR predictor with an AUC of 0.79 (95% C.I. 0.76–0.81). The LR predictor at four years of follow-up had a sensitivity of 85%, and a specificity of 62% resulting in a positive predictive value (PPV) of 74% and a negative predictive value (NPV) of 76% (Table 4).
Clinical observations. For patients predicted to have an unfavorable outcome at eight years, there was a trend towards a higher rate of post-radiosurgery hemorrhage (13.5%) compared the favorable outcome group (6.3%, p = 0.089), with a difference in average at-risk years for hemorrhage of 4.9 years in the unfavorable outcome group vs. 4.1 years in the favorable outcome group. Notably, this unfavorable outcome group had no significant group differences compared to the patients having a neutral or favorable outcome. In order to uncover the importance of 3D surface dose to the predictors, we retroactively analyzed its association with other patient features and outcomes. At two years, 3D surface dose was associated with adverse events. A greater average 3D surface dose was delivered to patients who experienced a post-radiosurgery hemorrhage (252 vs 169 Gy*mm2, p