Using a Simple Dilution Model to Estimate Wastewater Contaminant Concentrations Behind Moving Passenger Vessels Lincoln C. Loehr
Marlin Atkinson
Heller Ehrman 701 5th Ave. Suite 6100 Seattle, WA 98104 USA
University of Hawaii PO Box 1346K Kaneohe, HI 96744 USA
[email protected]
[email protected]
Kenwyn George
CJ Beegle-Krause
Alaska Dept. of Environmental Conservation 410 Willoughby Suite 303 Juneau, AK 99801 USA
National Oceanic and Atmospheric Administration 7600 Sand Point Way NE Seattle, WA 98115 USA
[email protected]
[email protected]
Abstract-An independent Science Advisory Panel (The Panel) was formed to assist the Alaska Department of Environmental Conservation evaluate the effects of wastewater discharges from cruise ships in Alaskan waters. The Panel evaluated the dilution of wastewater discharges from moving cruise ships. The results of that evaluation were used in turn to evaluate possible effects on water quality. This paper describes the dilution evaluation. The Panel evaluated a number of different studies and concluded that 1) the water that is displaced by a moving ship creates turbulent mixing upon its return astern of the ship; 2) the propellers further enhance the turbulence and mixing; 3) a cruise ship can be represented as a moving cross-sectional area; the larger the cross section and/or the faster the cruise ship moves, the greater the volume of water displaced per unit time leading to increased mixing rates; and 4) the diluted concentrations achieved will be inversely proportional to the rate of discharge. Hence, the mixing will be rapid, substantial and related to the vessel’s size, speed and discharge rate. Based on two theoretical studies and six field studies, The Panel concluded that the cross sectional mixing area behind a large cruise ship rapidly expands to about 4 times the cross-sectional area (beam times draft) of the ship. The dilution factor (df) for a discharge from a large moving cruise ship can be calculated as follows: df = 4 x (width x draft x speed)/(discharge rate) Links to The Panel’s final report, as well as interim reports and other related matters can be found at: http://www.state.ak.us/dec/press/cruise/cruise.htm
I. INTRODUCTION
0-933957-31-9
An independent Science Advisory Panel for the State of Alaska (hereafter referred to as The Panel) was formed in early 2001 to address discharge issues from large cruise ships (greater than 250 passengers). The Panel participated in a three day cruise aboard a large cruise ship, examined the waste handling procedures on board, and also visited a second cruise ship in port. A sub-group of The Panel reviewed previous studies, consulted with marine architects and effluent discharge modelers, and prepared a preliminary analysis of dispersion in June 2001 [1]. The Panel developed a preliminary formula that described the mixing behind a large moving cruise ship as the product of the below water line cross sectional area multiplied by the vessel’s speed divided by the discharge rate. The Panel knew that this was a conservative approach and that various studies discussed below showed that there would actually be greater mixing. The Panel recommended that dye studies be conducted and compared to the formula. In July 2001 The Panel met in Juneau, toured several more cruise ships and conducted observations of currents and turbulence behind moving cruise ships. EPA conducted dye studies behind 4 cruise ships off of Miami in August 2001, which one Panel member was able to observe. The Panel used the information from the dye studies and from its own observations to revise the dilution formula (by a factor of 4) and the final dilution analysis was presented in Section I of The Panel’s final report in November 2002 [2]. The dilution analysis was the critical information needed to assess various concerns raised by the complex set of effluent graywater and blackwater monitoring data that had been collected. The data collected included conventional pollutants, toxicants, nutrients and bacteria, as well as overall toxicity of the effluent by conducting whole effluent toxicity tests. Other sections of the final report addressed these issues. Water quality criteria were determined not to be exceeded for ships traveling at or greater than 6 knots. Provided vessels discharge at least one nautical mile from shore or shellfish beds, adequate additional dilution occurs, ensuring the protection of human health.
390
Form Approved OMB No. 0704-0188
Report Documentation Page
Public reporting burden for the collection of information is estimated to average 1 hour per response, including the time for reviewing instructions, searching existing data sources, gathering and maintaining the data needed, and completing and reviewing the collection of information. Send comments regarding this burden estimate or any other aspect of this collection of information, including suggestions for reducing this burden, to Washington Headquarters Services, Directorate for Information Operations and Reports, 1215 Jefferson Davis Highway, Suite 1204, Arlington VA 22202-4302. Respondents should be aware that notwithstanding any other provision of law, no person shall be subject to a penalty for failing to comply with a collection of information if it does not display a currently valid OMB control number.
1. REPORT DATE
2. REPORT TYPE
01 SEP 2003
N/A
3. DATES COVERED
-
4. TITLE AND SUBTITLE
5a. CONTRACT NUMBER
Using a Simple Dilution Model to Estimate Wastewater Contaminant Concentrations Behind Moving Passenger Vessels
5b. GRANT NUMBER 5c. PROGRAM ELEMENT NUMBER
6. AUTHOR(S)
5d. PROJECT NUMBER 5e. TASK NUMBER 5f. WORK UNIT NUMBER
7. PERFORMING ORGANIZATION NAME(S) AND ADDRESS(ES)
8. PERFORMING ORGANIZATION REPORT NUMBER
Heller Ehrman 701 5th Ave. Suite 6100 Seattle, WA 98104 USA 9. SPONSORING/MONITORING AGENCY NAME(S) AND ADDRESS(ES)
10. SPONSOR/MONITOR’S ACRONYM(S) 11. SPONSOR/MONITOR’S REPORT NUMBER(S)
12. DISTRIBUTION/AVAILABILITY STATEMENT
Approved for public release, distribution unlimited 13. SUPPLEMENTARY NOTES
See also ADM002146. Oceans 2003 MTS/IEEE Conference. Held in San Diego, California on September 22-26, 2003. U.S. Government or Federal Purpose Rights License, The original document contains color images. 14. ABSTRACT 15. SUBJECT TERMS 16. SECURITY CLASSIFICATION OF: a. REPORT
b. ABSTRACT
c. THIS PAGE
unclassified
unclassified
unclassified
17. LIMITATION OF ABSTRACT
18. NUMBER OF PAGES
UU
4
19a. NAME OF RESPONSIBLE PERSON
Standard Form 298 (Rev. 8-98) Prescribed by ANSI Std Z39-18
II. DISCUSSION In preparing its preliminary analysis of dispersion [1] The Panel considered the following studies. The Alaska SeaLife Center (ASLC) provided a report that considered near-field dilution of graywater discharged from a typical cruise ship [3]. The CORMIX1 discharge dilution model was used for the evaluation. The mixing was calculated for the plume at the stern of the ship and disregarded any mixing induced by the propellers. A maximum dilution factor of 2,500 was calculated for a discharge of 200 cubic meters per hour and a vessel speed of 8 knots. Though the CORMIX1 model is an EPA approved model, it is designed for discharges from a stationary outfall in a channel. The Panel determined that the CORMIX1 model does not simulate the dynamics related to the ship’s hull, displacement or propulsion system. The Panel believed that the plume that forms would undoubtedly be drawn into the propellers and that the dilution that occurs will be largely influenced by the propeller mixing and the returning displacement water from the ships’ passage. Kim [4] assumed cruise ship wastewater will be diluted into a standard mixing zone that is being considered under the ongoing development of Uniform National Discharge Standards for vessels of the Armed Forces. This zone is derived from the assumption of a mixing zone at any point in time as having a radius of 35 m and a depth of 20 m. This zone is effectively a box 70 m in width and 20 m in depth and an overall length dependent on the ship speed. Kim calculated a dilution factor of 78,000 for a typical cruise ship traveling at 6 knots and discharging wastewater at 200 m3/hour. Kim noted that higher speeds would lead to greater dilution factors. The Panel agreed with Kim that dilution factors would vary with speed, but was unsure about the width and depth of the assumed mixing zone. The waters of Southeast Alaska often exhibit sharp density stratification that may restrict mixing to a shallower depth than 20 m. Diffusion experiments were conducted in the 1970’s at a deep-water dumpsite off the New York coast [5]. The discharge was from a towed barge where wake turbulence and re-combined displacement water caused effluent mixing without the assistance of propellers. These observations found that wake dispersion produced initial dilutions up to a factor of 10,000 for a barge traveling at 6 knots. The studies also suggested that mixing turbulence behind a vessel occurs in a vertical area 2.5 times the beam and 3 times the draft. The dimensions of the observed vertical mixing area were proportionally similar to the assumed mixing zone used by Kim. The Panel believed the barge diffusion experiments could be used as a lower bound for mixing estimates, and that propeller induced mixing behind a cruise ship would cause further dilution. The Panel reviewed a wastewater dispersion study that involved water column sampling behind a discharging cruise ship near Ketchikan, Alaska that compared effluent data for bacteria, COD, BOD, TSS and Ammonia with
measurements in the wake [6]. The bacteria were found to be the most useful tracer of the ship’s discharge. The ship was simultaneously discharging from two tanks that had 9,200 and 7,000,000 fecal coliform organisms per 100 ml, and the samples in the receiving water averaged 7.7 organisms per 100 ml at 2 meters, and less than one organism per 100 ml at 5 and 10 meters. The results supported extreme dispersion of discharged wastewaters. Specifics as to discharge rates and vessel speed were not provided. The Panel concluded that a simple estimate of the dilution of any substance discharged along the hull assumes a well-mixed effluent over a vertical plane with an area that equals the width of the ship multiplied by the draft of the ship and that by considering the ship’s speed and the rate of the effluent discharge, a conservative dilution factor (df) could be calculated as shown in (1.1). df = (width x draft x speed)/(discharge rate)
(1.1)
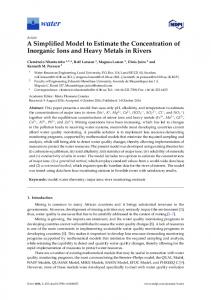
Using this formula, considering the beam and draft of three different large cruise ships, and an average discharge rate of 200 m3/hr, dilution factors varied from 10,500 to 13,200 at 6 knots. At 18 knots they varied from 31,500 to 39,600. The Panel then evaluated maximum and average concentrations for toxicants detected in an extensive sampling of graywater and treated blackwater from 21 cruise ships in the summer of 2000, used a dilution factor of 12,000 and compared the results to Alaska’s acute and chronic marine water quality criteria. The calculated dilution was sufficient to assure that no exceedances of toxicant water quality criteria would result. The Panel considered the dilution estimates from (1.1) to be minimal estimates until further dilution studies became available. Because (1.1) was based largely on theoretical considerations, The Panel recommended that a dilution study with dye and other tracers should be performed to confirm the basic assumptions of the model. The Panel concluded that the dilution factors in the ASLC report [3] underestimated the amount of mixing and rate of dilution. In July 2001, The Panel performed a study of opportunity behind two cruise ships as they were departing Juneau [7]. The study design involved tracking drogues placed at different depths on the port and starboard side of the wake shortly after a cruise ship passed. The Panel also had the observing vessel cross the wake to see if a trace of the wake turbulence could be observed on the fathometer. The fathometer proved to be very useful for describing the vertical extent of the wake turbulence and was found more useful than the drogues; the depth of turbulence was easily observed. The Panel quickly improvised a method for determining the width of turbulence and the observations were recorded on videotape. For two of the passes through the wakes, The Panel had insufficient information to calculate the width, which explains the question marks in Table 1. The dimensions of the observed wake turbulence are shown in Table 1. The turbulence observations
391
supported more than three times the mixing that is derived from (1.1). Both the depth and cross-sectional area of turbulence observed with the fathometer decreased over time. The wake turbulence of a passing ship would be expected to rise some and spread out laterally, but the cross-sectional area of mixing should increase and not contract. The decrease in depth of turbulence observed with the fathometer is probably a signal of entrained bubbles rising to the surface. Effluent would still be mixed with deeper water after the bubbles had gone. Hence, the decreasing observed crosssectional area of turbulence in Table 1 should not be construed as a decreased area in which effluent is mixed. The Panel reviewed a study by the Navy that measured and modeled dilution of a pulped waste paper discharge from the stern of a frigate [8]. Unlike a large cruise ship, the frigate was smaller and had just a single propeller. The Panel determined that the measured and modeled dilutions behind the frigate were about 3 times greater than (1.1).
would still be conservative. Hence, the recommended formula to calculate dilution factors for large cruise ships in The Panel’s final report is shown in (1.2): df = 4 x (width x draft x speed)/(discharge rate)
Table 2 Comparison of dilution calculations from (1.1) with EPA measured and calculated dilutions from dye studies
TABLE 1 Fathometer observations of wake turbulence Vessel: Ryndam Speed: 10 knots Time after ship passed 2 minutes 6 minutes 12 minutes
Depth
Width
12 m 7.5 m 6m
? 125 m 155 m
Vessel: Dawn Princess Time after ship passed 1.5 minutes 2.6 minutes 6 minutes 9 minutes 11.7 minutes 14.6 minutes 16.5 minutes
Cross-sectional Area ? 938 m2 930 m2
Width
18.3 m 12.2 m 6.1 m 5.5-6.1 m 4.6-6.1 m 3-4.6 m 2.4-3 m
? 76-79 m 103-104 m 124-129 m 131 m 126-131 m 125-130 m
Beam Draft Speed Discharge rate Equation (1.1) EPA measured Difference EPA calculated Difference
Units m m m/sec m3/sec df df Factor df Factor
M/S Majesty 32.6 7.7 9.0 0.031 72,000 386,000 5.3 342,000 4.7
M/S Explorer 38.6 8.8 9. 8 0.016 214,000 195,000 0.9 908,000 4.2
Beam Draft Speed Discharge rate Equation (1.1) EPA measured Difference EPA calculated Difference
Units m m m/sec m3/sec df df Factor df Factor
M/S Paradise 31.4 7.8 7.7 0.019 99,000 644,000 6.5 667,000 6.7
M/S Fascination 31.4 7.8 4.7 0.02 57,000 288,000 5.1 255,000 4.5
Table 3 is similar to Table 2 but compares EPA’s observations to dilutions calculated from (1.2) instead of (1.1). Table 3 illustrates that (1.2) agrees well with EPA’s dye studies. EPA’s dye studies included observations in which both the discharge rates and the speeds of the vessels varied by a factor of 2 (9 to 19 knots and 56 to 112 cubic meters per hour discharge rate).
Speed: 12 knots
Depth
(1.2)
Cross-sectional Area ? 928-964 m2 628-634 m2 682-787 m2 603-799 m2 378-603 m2 300-390 m2
In August 2001, the EPA conducted dye studies of the discharges from four cruise ships off of Miami and presented the results both as measured dilutions and calculated dilutions [9]. The measured dilution factors varied from 195,322 to 643,810 and the calculated dilution factors varied from 255,499 to 907,547. Table 2 shows the widths, drafts, speeds and discharge rates for the four ships and compares EPA’s observations to dilutions calculated from (1.1). The Panel reviewed the final results and determined that the measured dilutions were 5.3, 0.9, 6.5 and 5.1 times that predicted by (1.1) and the EPA calculated dilutions were 4.7, 4.2, 6.7 and 4.5 times that predicted by (1.1). The M/S Explorer measured value that was only 0.9 times (1.1) was further evaluated by The Panel and found to be improbable. The Panel concluded that the dye had not thoroughly mixed in the tank, thereby allowing an initial discharge of dye at a much higher concentration than was intended. Using the remaining measured and calculated dilutions, The Panel determined that the dye studies supported adjusting (1.1) by a factor of 4 and that this
392
Table 3 Comparison of dilution calculations from (1.2) with EPA measured and calculated dilutions from dye studies Beam Draft Speed Discharge rate Equation (1.2) EPA measured Difference EPA calculated Difference
Units m m m/sec m3/sec df df Factor df Factor
M/S Majesty 32.6 7.7 9.0 0.031 289,000 386,000 1.3 342,000 1.2
M/S Explorer 38.6 8.8 9. 8 0.016 854,000 195,000 0.2 908,000 1.1
Beam Draft Speed Discharge rate Equation (1.2) EPA measured Difference EPA calculated Difference
Units m m m/sec m3/sec df df Factor df Factor
M/S Paradise 31.4 7.8 7.7 0.019 398,000 644,000 1.6 667,000 1.7
M/S Fascination 31.4 7.8 4.7 0.02 228,000 288,000 1.3 255,000 1.1
For small cruise ships The Panel recommends a factor of 3 instead of 4 be applied. III.
CONCLUSIONS
Multiple lines of evidence confirm that discharges of wastewaters from moving cruise ships rapidly achieve very high initial dilution factors. No single dilution factor should be used to characterize the mixing for a ship. A simple formulation for dilution behind a passing cruise ship varies with the width and draft of the vessel, the vessel’s speed and the rate of discharge. The equation below may be used to describe the mixing for a large cruise ship.
[8] S.L. Curtis, C.N. Katz and D.B. Chadwick, “Environmental Analysis of U.S. Navy Shipboard Solid Waste Discharges: Addendum to the Report of Findings,” SPAWAR Systems Center San Diego Technical Report 1716, February 1999. [9] EPA Office of Water, “Cruise Ship Plume Tracking Survey Report,” 2002. http://www.epa.gov/owow/oceans/cruise_ships/plumer pt2002/plumereport.pdf
df = 4 x (width x draft x speed)/(discharge rate)
Smaller cruise vessels and ferryboats will behave similarly, but a factor of 3 should be used instead of the factor of 4. References [1] Science Advisory Panel for Commercial Passenger Vessel Wastewater Discharge. “Report to the Alaska Cruise Ship Initiative. Near-Field Dispersion of Wastewater Behind a Moving Large Cruise Ship.” June 26, 2001. http://www.state.ak.us/dec/press/cruise/documents/scip anl2.htm [2] Science Advisory Panel for Commercial Passenger Vessel Wastewater Discharge & Alaska Department of Environmental Conservation Commercial Passenger Vessel Environmental Compliance Program. “The Impact of Cruise Ship Wastewater Discharge on Alaska Waters,” November 2002. http://www.state.ak.us/dec/press/cruise/documents/imp actcruise.htm [3] J.M. Colonell, S.V. Smith and R.B. Sipes, “Cruise Ship Wastewater Discharge into Alaskan Waters,” Technical Report 2000-01, Alaska SeaLife Center, pp. 7-16, November 12, 2000. [4] D.K. Kim, “Cruise Ship Wastewater Dispersion Analysis,” prepared for International Council of Cruise Lines, August 25, 2000. [5] G.T. Casanady. “An Analysis of Dumpsite Diffusion Experiments,” in Ocean Dumping of Industrial Wastes, B.H. Ketchum, D.R. Kester and P.K. Park, Eds. New York: Plenum Press, 1980, pp. 109-129. [6] ESL, LLC, “Wastewater Dispersion Study: Distribution of Cruise Ship Effluent as Determined from Real-Time Collection of Water Column Samples,” September 6-7, 2000, prepared for Northwest CruiseShip Association. [7] L. Loehr, A. Mearns and K. George, “Initial Report on the July 10, 2001 Study of Opportunity: Currents and Wake Turbulence Behind Cruise Ships,” August 6, 2001. http://www.state.ak.us/local/akpages/ENV.CONSERV/ press/cruise/documents/intialreport.htm
393