Using a Treatment Train to Optimize DNAPL Source Zone Remediation Paul J. Favara (
[email protected]) (CH2M HILL, Gainesville, Florida) Michael A. Singletary and Barbara Nwokike (Naval Facilities Engineering Command, Charleston, South Carolina), Steve Tsangaris (CH2M HILL, Tampa, Florida) ABSTRACT: Many DNAPL sites have been treated using innovative source reduction technologies, such as in situ chemical oxidation (ISCO). Although individual technologies can be successful in removing significant mass from a DNAPL source, rarely, if ever, will implementation of a single technology achieve site closeout. More often, a combination of technologies sequenced throughout the life cycle of a project or applied to different target treatment zones within the contaminated area is used to meet remedial action objectives (RAOs). An example of this is the treatment train approach used when ISCO is used for source treatment purposes. As an emerging technology in the mid- to late-1990s, ISCO was considered a viable method to remediate DNAPL sites successfully and achieve a high level of source area reduction and site closure. However, post-remediation monitoring of these sites often showed a rebound of contaminant concentrations over time. As a result, many of these sites often have to be re-engineered or optimized to define the next course of action. This paper presents the remedial process optimization (RPO) approach used to assess the effectiveness of ISCO and to develop a treatment train approach designed to meet RAOs at the former Orlando Naval Training Center (NTC), Study Area 17 (SA17) site. INTRODUCTION SA17 is located at NTC Orlando, a former Navy facility in the city of Orlando, Florida. SA17 occupies approximately 25 acres in the central part of the McCoy Annex and formerly served as the Defense Property Disposal Office (DPDO) complex. This 25acre site was a former motor pool storage area. Trichloroethylene (TCE) migrated into the saturated zone throughout the surficial aquifer to depths up to 40 feet below ground surface (bgs). The results of a screening investigation indicated that the suspected source of chlorinated volatile organic compound (CVOC)-contaminated groundwater at the site is related to operations at the former motor pool area. The highest total CVOC concentration detected during the screening investigation was 65,000 micrograms per liter (µg/L). The Orlando Partnering Team (OPT) recommended site remediation be initiated under the authority of an interim remedial action (IRA), with subsequent activities including natural attenuation of the site. The OPT was formed to establish a teaming relationship among Southern Division Naval Facilities Engineering Command (NAVFAC EFD SOUTH) personnel and contractors, and representatives of the Florida Department of Environmental Protection (FDEP) and the U.S. Environmental Protection Agency (EPA). This team has worked successfully together to accomplish a common goal—cleanup of environmental
contamination and transfer of the former NTC Orlando property for redevelopment. The OPT was recognized for their successes, in part for their work at SA17, with the 2003 Chief of Naval Operations Environmental Award. The public has participated in the cleanup process through the Restoration Advisory Board (RAB), which has become very supportive of the Navy’s cleanup efforts. The technology selected for the IRA was ISCO using Fenton’s reagent, for the purpose of source control/reduction of the chlorinated solvent plume at SA 17. ISCO injections at SA17 were divided into two distinct phases. Phase I consisted of two injection events conducted from November 2000 through January 2001. Phase II consisted of three injection events conducted from March 2002 through September 2002. At total of 20,230 gallons of 50-percent hydrogen peroxide were injected over the 8,000square foot site, to a total depth of approximately 40 feet bgs. The remedial goal of the IRA was to reduce the contaminant source area mass and volume to the extent possible. A total CVOC concentration of 500 µg/L was established as the treatment objective. Total CVOC concentration is a summation of TCE, cis-1,2-dichloroethene (cis-1,2DCE); 1,1-dichloroethene (1,1-DCE), 1,1-dichloroethane (1,1-DCA), and vinyl chloride. Monitoring well data were used to evaluate the effectiveness of the ISCO IRA at SA17. The data analysis showed that dissolved phase concentration reductions of 89 percent TCE and 87 percent CVOCs were achieved, as measured in June 2003, or eight months following the final ISCO injection event. Table 1 presents the pre- and posttreatment monitoring well concentrations. This table shows that, while ISCO was very effective at most locations, significant increases in TCE concentrations were noted in approximately 25 percent of the wells. Although these contaminant reduction levels were significant, there still remained a small area (50-foot [ft] x 50-ft x 40-ft) in the ISCO treatment zone with significant levels of TCE in groundwater, with concentrations generally greater than 10,000 µg/L and as high as 45,000 µg/L in one groundwater monitoring well. A detailed assessment of the data by the OPT concluded that the limits of ISCO using Fenton’s reagent had been achieved and that further treatment of the site by ISCO would provide minimal benefit due to diffusion-limited conditions for delivery in the source area. Based on these results, the OPT determined that, rather than being able to move into a Monitored Natural Attenuation (MNA) phase of remedial action, an additional step (or steps) would be required in the treatment train to make the source area more amenable to natural attenuation. Before the scope of additional step(s) in the treatment train were defined, the OPT implemented an optimization evaluation to better understand the site conditions and reassess cleanup goals. The optimization process that was used followed Guidance for Optimizing Remedy Evaluation, Selection, and Design (NAVFAC, 2004) and Guidance for Optimizing Remedial Action Operation (RAO) (NAVFAC, 2001). Following these guidance manuals ensured that all necessary information was appropriately considered prior to finalizing the additional steps of the treatment train. This guidance, while focused on optimization concepts prior to remedy implementation, can be applied to later stages in the cleanup process, as in the case of SA17.
TABLE 1. Pre- and Post-treatment TCE concentrations.
1
Sample Location
Pre-ISCO (µg/L)
Post-ISCO1 (µg/L)
% Reduction
Note
D-19 D-20 D-21 D-25 D-26 D-28 D-30 D-31 D-33 D-35 D-37 I-25 I-30 17-23A 17-24B 17-25C S-04 S-08 VD-39 VD-40 VD-42 VD-43 VD-44 VD-45 VD-46 VD-47 VD-48 VD-50 VD-52 VD-53 VD-55 VD-57 VD-58 VD-60 VD-62 VD-64 VD-69 VD-71 VD-73 VD-76 Average
278 1,290 22 12,500 648 33,700 306,000 1,210 5,030 1,090 958 2 21 10,200 20,500 1 2 49 26,000 20,000 1,970 36,000 4,800 552 26,000 13,000 3,880 3,880 849 1,090 67,200 64,500 323 3,510 45,100 8,270 11 62 1,230 2 18,043
25.1 406 25.8 45,000 7.2 282 110 5.4 3,560 4,080 2,380 28 29.5 3,340 2,110 0.5 5,290 45.2 0.58 3.7 169 684 9.9 412 0.61 0.28 221 2.2 49.8 24.6 6.9 3.8 1,620 5.5 4,870 631 3,150 1,780 0.73 0.5 2,009
90.97% 68.53% -17.81% -260.00% 98.89% 99.16% 99.96% 99.55% 29.22% -274.31% -148.43% -1066.67% -37.85% 67.25% 89.71% 15.25% -330525.00% 7.38% 100.00% 99.98% 91.42% 98.10% 99.79% 25.36% 100.00% 100.00% 94.30% 99.94% 94.13% 97.74% 99.99% 99.99% -401.55% 99.84% 89.20% 92.37% -28536.36% -2784.93% 99.94% 66.67% 88.86%
SR NC NC SI SR SR SR SR NC SI SI NC NC SI SI NC SI NC SR SR SR SR SR NC SR SR SR SR SR SR SR SR SI SR SR SR SI SI SR NC
8 months following final injection event. SR = Significant Reduction, NC = Nominal Chance, SI – Significant Increase
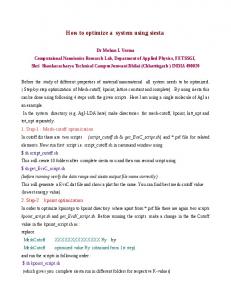
To incorporate RPO concepts, the following steps are required: 1) refinement of the CSM based on data collected during additional source area investigations, 2) reevaluation of RAOs with the regulatory agencies, 3) definition of the target treatment zones, 4) evaluation of technologies capable of meeting RAOs in the target treatment zones including the downgradient portion of the contaminant plume, 5) development of performance objectives to be achieved by the selected remedy, and 6) development of a strategy for achieving site closeout. The following sections in this paper summarize the activities completed under the RPO concepts that identify the remaining components of the treatment train used to achieve site closure. The “lessons learned” from this RPO process are included as part of the conclusions and recommendations section. REFINEMENT OF THE CONCEPTUAL SITE MODEL Although a CSM was developed for the site prior to the ISCO treatment activities, it did not provide the level of detail to fully comprehend the nature of the contamination in the source area with respect to lithology. Further investigation of the site was completed to better understand the source area contamination with respect to lithology, and to also address the changed site conditions that were a result of the aggressive ISCO application at SA17. The results of the ISCO activities conducted at SA17 aided the understanding of the CSM as post-treatment monitoring indicated, to a fairly precise degree, the location of the hot-spots remaining in the subsurface following treatment, based on spatial analysis of contaminant rebound locations. Based on this post-ISCO understanding of the site, the CSM was modified to incorporate the new understanding of the site and directed characterization work toward identifying discrete locations of elevated TCE in soil and groundwater. To evaluate the extent of contamination in the different geologic materials, an investigation involving collection of Membrane Interface Probe (MIP) data, discrete soil samples, and discrete groundwater samples was completed. The MIP investigation involved collecting data from 48 locations to a total depth of approximately 50 feet. MIP readings were recorded (Electron Capture Detectors [ECD] and Photo Ionization Detectors [PID]) at 1-ft intervals. With the MIP data, along with existing knowledge of the geology of the site and conductivity data reported on the MIP, locations for discrete soil samples and groundwater samples were collected. All results from the MIP, soil, and groundwater investigations were assimilated into an Environmental Visualization Software® (EVS®) project to assess the spatial extent of contamination in three dimensions (3-D). The EVS software was manipulated to review MIP, soil, and groundwater data concurrently and in a variety of ways (vertical and horizontal cross sections, isopleth contouring). Figure 1 shows a plan and profile view of the soil and groundwater contamination where TCE exceeds 10,000 parts per billion (ppb). The results of this investigation provided a detailed understanding of the extent of contamination and location of contaminants, with a high degree of confidence, in discrete geologic material. This refined understanding of the extent of contamination was placed in the overall context of results reported from other area monitoring wells (outside of the source area). The CSM incorporated the following components: a) Contaminant Source and Release Information, b) Geologic and Hydrologic Information, c) Contaminant Distribution, Fate, and Transport, d) Impacts of IRA on the Site, and e) Uncertainty.
FIGURE 1. TCE in Soil and Groundwater (Conceptualized using EVS®). In addition to refining the CSM to provide greater detail and understanding of the nature and extent of contamination, two models were constructed and evaluated for the purposes of estimating the Time of Remediation (TOR) of the groundwater plume. The TOR estimates the timeframe required to achieve a pre-determined cleanup level at the source of contamination. One of the two models is also capable of estimating the Time of Stabilization (TOS) for the groundwater plume. TOS refers to the time required to achieve a pre-determined compliance or target concentration at a fixed distance downgradient of the source area. Natural Attenuation Software (NAS) from the U.S. Geological Survey (USGS) provides routines to calculate both TOS and TOR. Source DK (Version 1.0, 2004) was used to calculate TOR only. NAS is a Visual Basic interface that was designed to calculate estimates for TOR based on site characterization data for sites contaminated with either fuels or chlorinated solvents. NAS calculates natural attenuation capacity (NAC), TOS, and TOR. Source DK is a remediation timeframe decision support system. It utilizes three approaches to estimate TOR and the uncertainty in the timeframe estimate. Based on results of the modeling effort, it was concluded that further source reduction yields limited reduction in long-term monitoring requirements for the site; there was no measurable increased protection of human health and the environment. Given that the SA17 source area is approximately 600 feet from the property boundary, the model results indicated that the source would not cause offsite groundwater concentrations to exceed Florida Groundwater Cleanup Target Levels (GCTLs) at any point in the future. Also, given the current distribution of contaminants at the site (i.e., knowing contaminant concentrations downgradient), no location downgradient of the source area at SA17 is anticipated to yield an offsite exceedance of GCTLs at some point in the future. These model results were critical to developing RAOs for the site. REMEDIAL ACTION OBJECTIVES The OPT agreed that a substantial effort in source area treatment has already been completed and it was determined that the practical limits of cost-effective remediation, for the purposes of complete removal of the source, had been exhausted. This conclusion
was supported by modeling estimates that showed that even substantial reduction in the source area did not significantly alter the TOR for the site. Based on these conclusions, achieving a pre-defined source mass reduction or concentration reduction is not a component of the RAO for this site. However, it is important that the alternative that is implemented involve management of the source area to prevent further groundwater migration away from the source and contamination in the zone already treated by the IRA. Because the contaminant plume had distinct areas requiring different management approaches, the contaminant plume was subdivided into three separate and distinct units for the purposes of developing the RAOs. The three main areas, along with their respective RAOs are presented below in Table 2. TABLE 2. Contaminant plume areas and their respective RAOs. Area 1
Description of Area Source area. Contains highest contaminant concentrations. Possible TCE DNAPL present.
2
Contaminated groundwater between the source area and the property boundary. High dissolved concentrations are present.
3
Groundwater at the property boundary.
RAOs The RAO for Area 1 is to apply treatment that can reduce source contaminant concentrations while minimizing CVOC migration from the area (i.e., a contaminant flux management strategy). The RAO for Area 2 is to prevent plume expansion in the IRA treatment area and contaminant reduction to prevent offsite migration. The RAOs for this area are to reduce contaminant concentrations to a level that do not threaten human health or the environment at the downgradient property boundary.
TARGET TREATMENT ZONES Two target treatment zones (TTZ-1 and TTZ-2) were recommended for the site. TTZ1 represents Area 1 and TTZ-2 represents Area 2 (the contaminant plume exclusive of TTZ-1). Each TTZ had a vertical as well as a horizontal component defined. In the case of the vertical component, the Hawthorne Unit (and aquitard located at approximately 50 to 60 feet bgs) was the total depth of the TTZ. A TTZ was not defined for Area 3 because the RAOs for this area would be met when achieving the RAOs identified for TTZ-1 and TTZ-2. TECHNOLOGY SELECTION A detailed evaluation of TTZ-2 was completed to determine the feasibility of utilizing natural attenuation as the sole remedy for managing contaminants downgradient of the source area (i.e., Area 2). Detailed information regarding terminal electron accepting processes (TEAPs), contaminant concentrations over time, microbial analysis, and geochemistry were collected from across the site. The OPT concluded that there were multiple lines of evidence to indicate a significant and active natural attenuation activity occurring at the site. Based on this conclusion, MNA would be the principal remedy to achieve RAOs for Area 2; thus, further technology evaluation and selection was not warranted. As such, the step involving Technology Selection focused on TTZ-1.
The OPT considered several alternatives for TTZ-1. Given that the RAOs for Area 1 did not call for complete removal of the source of contamination, many conventional technologies that normally would have been considered for a source area were not evaluated. As previously stated, the limits of effective source area mass reduction were considered met with completion of the ISCO work. Consequently, the list of alternatives for consideration was appropriately focused. The technology evaluation mainly focused on enhanced reductive dechlorination (ERD) through two different delivery mechanisms: 1) substrate is applied to the TTZ in recirculation mode, and 2) substrate is applied to the TTZ through injection wells. As a point of reference, the above technologies were compared to excavation. This comparison was warranted because, while the RAO did not call for complete contaminant removal, the ERD technologies were compared to a technology deemed capable to completely removing the source. This comparison was a checkpoint to ensure the ERD technologies, with a long operations period, would not approach costs of those technologies that could completely remove the source in TTZ-1. The alternatives were evaluated based on effectiveness, implementability, cost, and uncertainty. The analysis of alternatives concluded that ERD, operated in recirculation mode, was the most cost effective alternative for achieving the RAOs. The OPT selected ERD, delivered through a recirculating delivery system, as the next step in the treatment train for TTZ-1. PERFORMANCE OBJECTIVES Performance objectives for Areas 1, 2, and 3 were defined to clearly articulate expectations and planned remediation endpoints. Satisfying performance objectives is a critical success factor in achieving RAOs for the remedy. In general, the performance objectives for remediation of this site include adequate substrate delivery in TTZ-1, with subsequent monitoring to indicate contaminant reduction is occurring and contaminant migration is minimized. The performance objectives for Area 2 focused on demonstrating continued natural attenuation that is capable of reducing contaminant levels to prevent offsite migration. The performance objective for Area 3 focused on monitoring in order to demonstrate that contaminants did not migrate past the boundary above GCTLs. OPTIMIZATION AND EXIT STRATEGIES The optimization strategies for the selected alternative were to reduce the frequency of monitoring, reduce the target analytes list for monitoring, and to continue future evaluation of the implemented remedy to determine refinements that may be appropriate in the future. There are no practical near-term exit strategies for the site. Given the size of the plume, and the nature of the high concentrations of TCE in the source area, it would be cost-prohibitive to treat the entire plume to the degree necessary to accelerate the time required to achieve long-term unrestricted land use. CONCLUSIONS AND RECOMMENDATIONS The lessons learned from this effort and the recommendations identified address the SA17 project as a whole (inclusive of the IRA phase). It was concluded that the IRA treatment goals were set unnecessarily low and it was not practical to expect that ISCO could achieve the 500 µg/L CVOC criteria, given the complexity of the site. Human
health and environment can be protected, as supported by computer modeling, with less source area contaminant reduction. The CSM refinement step was critical to properly evaluate and select the next step in the treatment train. The term “CSM” has wide ranging meanings and a CSM developed for purposes of developing a quantitative remedial design basis and optimizing a remedial action require significantly more detail than CSMs required to assess risks to human health and the environment. In addition, the computer model results were critical to properly frame the expectations of source area treatment. Consensus on the adequacy of site data, prior to initiating technology evaluation and selection, is critical to a successful optimization study. In the case of SA17, the Navy organized an optimization meeting which was attended by leading technologists from the OPT and the Navy, including technology leaders with no prior involvement in the project who could provide greater objectivity. The data were thoroughly discussed and dissected, initially at a one-day meeting and subsequently through finalizing meeting minutes and outcomes. When the optimization meeting/results activities were completed, all of the technologists who were involved had the same understanding of the site and endorsed the CSM. This was critical to completing the subsequent steps of the optimization study. A majority of remediation projects have some level of uncertainty related to discrete components of the project. These uncertainties should be clearly articulated so that reviewers and stakeholders can better understand the limits of the recommendations. Finally, project sites with potential DNAPL contamination or very high levels of contamination where in situ treatment applications are diffusion-limited, will generally require a treatment train to achieve RAOs. It is unlikely that a single technology will be effective in reducing significant contaminant levels to drinking water standards. REFERENCES Chapelle, F.H., M.A. Widdowson, J.S. Brauner, E. Mendez, and C.C. Casey. 2003. Methodology for estimating times of remediation associated with monitored natural attenuation: U.S. Geological Survey Water-Resources Investigations Report 03-4057. Chief of Naval Operations. 2004. Policy for Optimizing Remedial and Removal Actions under the Environmental Restoration Programs. 23 April. Naval Facilities Engineering Command (NAVFAC). 2001. Guidance for Optimizing Remedial Action Operation (RAO). April. Naval Facilities Engineering Command (NAVFAC). 2004. Guidance for Optimizing Remedy Evaluation, Selection, and Design. April.