Visualization in Biomedical Computing (VBC’96), K.-H. Höhne, R. Kikinis (Eds.), LNCS 1131 (Springer Verlag, Berlin, 1996) p. 235-240.
Using an Entropy Similarity Measure to Enhance the Quality of DSA Images with an Algorithm Based on Template Matching Thorsten M. Buzug, Jürgen Weese, Carola Fassnacht and Cristian Lorenz Philips Research, Technical Systems Hamburg, Röntgenstraße 24-26, 22335 Hamburg, Germany
[email protected] Abstract. The reduction of motion artifacts arising in DSA requires registration of mask- and contrast image prior to subtraction. An algorithm has been developed consisting of a) partitioning an interactively chosen region-ofinterest (ROI) and exclusion of low-contrast partitions, b) assignment of homologous landmarks or control points, c) estimation of parameters of an affine transformation and application of the transformation on the mask image (inside the ROI), and d) subtraction of contrast- and corrected mask image. For assigning homologous landmarks, we use the entropy as similarity measure and compare the results to other frequently used measures.
1
Introduction
To enhance the quality of digital subtraction images (DSA) patient motion during image acquisition must be corrected. This is usually done by a registration procedure of mask and corresponding contrast image prior to subtraction. Often only a part of the image is of clinical interest and, therefore, a region-of-interest (ROI) is interactively selected. After this selection the registration procedure should be fully automated. An important constraint is the computational efficiency of the algorithm to be implemented on digital angiography systems for clinical routine. The main problem of the automatic registration procedure is that the ROI always contains the vascular structures of interest contrasted with opaque dye. That makes both images to be compared dissimilar and the used similarity measure must cope with these grey-value distortions. We present a 4-step algorithm which meets the above requirements.
2
DSA Algorithm Using Entropy Similarity Measure
Subdivision of region-of-interest. The interactively defined region-of-interest in the contrast image is divided into quadratic, non-overlapping templates of a given size. Due to the well known fact from signal-processing theory that for matched filters the so-called correlation gain depends on the product of template size and signal bandwidth [1], only those templates should be incorporated in our algorithm which have sufficient contrast variation. We propose an exclusion technique using an estimate of the mask-image contrast variation calculated via the entropy h = -Σ pg log pg, where pg is the fraction of pixels with grey-value g and the sum runs from 0 to gmax, the maximum grey-value of the mask image. Templates with a high contrast show a broad histogram whereas templates with a low contrast show a narrow distribution of grey-
235
values. Therefore, only those templates having an entropy that exceeds a certain threshold are taken into account. Assigning homologous landmarks by template matching. The shift of the templates in the mask image with respect to the contrast image is determined by minimizing the entropy of the template after subtraction of the corresponding region in the contrast image. Let gc,gm be the grey-values of the contrast and the mask image, x,y the coordinates of the images, and r,s the (horizontal and vertical) shift of the template, respectively. Using these quantities the entropy measure is defined in a 3-step procedure [2]. Firstly, subtract images (only inside the template): de(x,y,r,s) = gc(x,y)gm(x+r,y+s). Secondly, calculate the grey-value histogram of the difference and normalize it according to Σpg=1, where pg is the fraction of pixels in image de(x,y,r,s) with grey-value g and the sum runs from gmin to gmax, the minimum and maximum grey-value of the difference image, respectively. And, thirdly, calculate the entropy: H ( r, s ) = −
gmax
∑ pg log pg
(1)
g = gmin
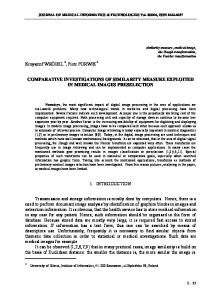
For the optimal shift, the subtraction image shows low contrast variation whereas in the case of misregistration the contrast variation is high. Therefore, in the case of misregistration, a broad histogram is expected. A perfect registration leads to a peaky histogram, containing peaks corresponding to the homogeneous background, and further peaks caused by the contrasted vessels that cannot (and should not) vanish after subtraction. Hence, the entropy function is minimized yielding shift values of the motion between corresponding templates of mask and contrast image. The template centers together with the resulting shifts define a set of homologous landmarks (or control points, not meant as anatomical landmarks) which is used to estimate the parameters of an affine transformation. In order to illustrate the result of template matching, we applied the algorithm to an image pair showing the vessel tree of a transplanted kidney. The images were acquired using a Philips Integris V3000 system. Fig. 1a/b shows the contrast and mask image with the set of homologous landmarks (dark crosses in the contrast image, bright crosses in the mask image). The local shift of each landmark is indicated in the contrast image by lines attached to the crosses. It can be recognized that only those landmarks have been selected which show sufficiently high contrast variation in the corresponding template. Estimation of affine transformation. The set of homologous landmarks resulting from the template matching is used to estimate the parameters of an affine transformation relating the points of the mask image to the corresponding points in the contrast image inside the region-of-interest. As there are much more than three homologous landmarks, this is an overdetermined problem and a singular value decomposition is used to produce a solution that is the best result in the least-squares sense [3]. The affine transformation can cope with distortions like translation, rotation, scaling and skewing. Higher-order polynomes or elastic approaches may be used [4] to further improve the quality of DSA, especially for more complex distortions.
236
a
c
b
ROI
Template
d
Fig. 1. X-ray projection images of the abdomen and corresponding subtraction images (cutouts of 1024x1024-pixel images can be seen). a) Mask image: The catheter is visible on the right-hand side. b) Contrast image: Opaque dye is injected into the vessel tree of a transplanted kidney. Mask and contrast image are overlaid with the calculated set of homologous landmarks (or control points), indicated as white and dark crosses, respectively. Additionally, lines are attached to each landmark in b) to visualize the motion-vector field in the contrast image. As an example one of the (40x40-pixel) templates is drawn as a white square inside the indicated region-of-interest. c) Uncorrected DSA-image: Smaller vessels are covered by cloud-like artifacts that arise from moving air bubbles of the intestine (motion is caused by breathing and probably peristaltic motion). d) Corrected DSA-image: Affine correction of patient motion inside the indicated region-of-interest.
237
A general problem is, however, that distortions are inherently 3-dimensional. There are 3-dimensional patient motions leading to distortions which cannot be described by a position dependent shift in the 2-dimensional projection images. Therefore, it is not expected that DSA registration algorithms can ever be developed to the extent that they remove all motion artifacts [5]. Subtraction of images. In a last step, contrast and mask image are subtracted. Within the subtraction the affine transformation is used to compensate the geometric distortions. As an example the algorithm presented has been applied to the image pair of fig. 1a/b. In fig. 1c/d the uncorrected DSA-image and the image corrected inside the region-of-interest are compared. The example clearly demonstrates that the artifacts produced by the patient motion can be reduced significantly.
3
Comparison of Similarity Measures
Of course the question arises whether the entropy measure is better adapted to the DSA problem than other well-known similarity measures such as e.g. cross-correlation function [6], cross-structure function [7], and deterministic sign change (DSC) [8,9]. For that reason these similarity measures are briefly described and compared for another example in fig. 2a/b. The cross-correlation function is defined as: N M 1 G( r, s) = ( g ( x , y ) − mc )( gm ( x + r , y + s ) − mm ) (2) NM x =1 y =1 c where mc and mm are the mean grey-values of contrast and mask image, respectively. It can be calculated very fast via the Wiener-Khintchine theorem, but has the disadvantage that it exists only, if the images are spatially stationary. To overcome this problem the cross-structure function can be applied. It is defined as 1 N M (3) S( r , s ) = ∑ ∑ (gc ( x, y) − gm ( x + r, y + s))2 NM x =1 y =1
∑∑
and exists also for data with drifts. For spatially stationary images the structure function and correlation function are equivalent. Both measures give excellent results if the images to be compared are not distorted. This is demonstrated in fig.2c/d which shows the normalized similarity measures for pixel shifts r,s∈[-15,15]. An optimum is expected at (r,s)=(0,0). Unfortunately, both measures will fail, if a structure is overlaid to one image as for DSA (fig.2g/h). In those situations the deterministic sign change (DSC) yields much better results. It is defined in three steps: Firstly, add a periodic pattern of depth δ to one of the images to be compared, i.e. g’c(x,y)=gc(x,y)+δ if x+y is even and, g’c(x,y)=gc(x,y)-δ if x+y is odd. Secondly, subtract images dd(x,y,r,s)=g’c(x,y)-gm(x+r,y+s). And, thirdly, evaluate the criterion D(r,s): Number of sign changes in dd(x,y,r,s) scanned line-by-line. Fig. 2e/i shows the success of this measure. The disadvantages in DSC are that the image depth δ is not known a priori and the mean value of the images to be compared must be adapted. However, even if these additional parameters are estimated, the objective function may not be smooth (see fig. 2i), and, therefore, be hard to optimize. In contrast, the entropy measure yields reliable results with a smooth basin also for very dissimilar templates as can be seen in fig. 2j.
238
a
b
s
T1
r
T2
c
d
g
h
f
i
j
s r
e
Fig. 2. X-ray projection (512x512-pixel) images of the abdomen and corresponding evaluations of different objective functions for selected templates. a) Mask image: The aorta catheter is visible over the vertebra. b) Contrast image: Opaque dye is injected into the aorta. c) Cross-correlation function G(r,s). d) (Inverted) cross-structure function -S(r,s). e) Deterministic sign change D(r,s). f) (Inverted) entropy -H(r,s). Fig. c) to f) refer to the (40x40-pixel) template T1 indicated in the contrast image. g) to j) Respective similarity measures for the (40x40-pixel) template T2 indicated in the contrast image. S(r,s) and H(r,s) are inverted to allow for a visual comparison of all similarity measures. All functions are normalized to greyvalues in the range [0,255]. The origins of the similarity plots are placed in the center of each graphic, as indicated in fig. c). For template T1, where we have no grey-value distortion, all 4 similarity measures yield a conform result for the optimal shift value: (r,s)=(0,0). The entropy measure shows the sharpest optimum with a large, smooth attractive basin. Template T2 is chosen such that approximately one half of it’s area includes grey-values from the contrasted aorta. In this situation cross-correlation and cross-structure function, fig. g) and h), respectively, yield false results. We obtain the correct result from the DSC- and entropy measure, that succeed for such dissimilarities. While the DSC shows relatively rough surface, the entropy is again smooth which simplifies an optimization.
239
4 Conclusion We presented a 4-step algorithm to enhance the quality of DSA images that are degraded by patient motion. To compensate this motion a point-based registration is employed using homologous landmarks extracted by template matching from the mask and corresponding contrast image. The entropy has been proposed as exclusion criteria in the selection process of landmarks and also as similarity measure in the template-matching procedure. The examples of this paper demonstrate that this measure is especially suitable for image pairs which are dissimilar due to structures overlaid to one image. In this sense the entropy measure can be considered a datadriven approach adapted to DSA. So far an affine transformation has been used to correct for the motion artifacts. We think, however, that the result can be further improved using elastic transformations. Furthermore, the algorithm may be applied to other images as e.g. to CT/CTA which is the 3D analogous to the DSA problem. For this purpose the algorithm is straightforwardly extended to 3D.
Acknowledgments The authors would like to thank Dr. L. J. Schultze Kool, University Hospital Leiden, for providing us with the data sets. The algorithm was implemented on an experimental version of the EasyVision workstation from Philips Medical Systems and we would like to thank ICS (EasyVision/EasyGuide) Advanced Development, Philips Medical Systems, Best, for helpful discussions.
References 1. R. Gagliardi: Introduction in Communications Engineering. (John Wiley & Sons, New York, 1978). 2. T. M. Buzug and J. Weese: Improving DSA images with an automatic algorithm based on template matching and an entropy measure. In: Proc. of CAR’96 (Elsevier, Paris, 1996). 3. W. H. Press, B. P. Flannery, S. A. Teukolsky and W. T. Vetterling: Numerical Recipes in C. (Cambridge University Press, Cambridge, 1990) pp. 534-539. 4. K. Rohr, H. S. Stiehl, R. Sprengel, W. Beil, T. M. Buzug, J. Weese and M. H. Kuhn: PointBased Elastic Registration of Medical Image Data Using Approximating Thin-Plate Splines. In: Proc. of the 4th Int. Conf. on VBC’96, Lecture Notes in Computer Science (Springer, Berlin, 1996). 5. J. M. Fitzpatrick, J. J. Grefenstette, D. R. Pickens, M. Mazer and J. M. Perry: A system for image registration in digital subtraction angiography, in: Information processing in medical imaging. C. N. de Graaf and M. A. Viergever (eds.), (Plenum Press, New York, 1988) p. 415. 6. M. Yanagisawa, S. Shigemitsu and T. Akatsuka: Registration of locally distorted images by multiwindow pattern matching and displacement interpolation: The proposal of an algorithm and its application to digital subtraction angiography, in: 7th Int. Conf. of Pattern Recognition (IEEE Computer Society Press, Silver Spring Md., 1984) p. 1288. 7. E. O. Schulz-DuBois and I. Rehberg: Structure function in lieu of correlation function. Appl. Phys. 24 (1981) 323. 8. A. Venot and V. Leclerc: Automated correction of patient motion and gray values prior to subtraction in digitized angiography. IEEE Trans. on Med. Im. 4 (1984) 179. 9. K. J. Zuiderveld, B. M. ter Haar Romeny and M. A. Viergever: Fast rubber sheet masking for digital subtraction angiography. SPIE 1137, Science and Engineering of Medical Imaging (1989) 22.
240