Research
Using Antibody Arrays to Detect Microparticles from Acute Coronary Syndrome Patients Based on Cluster of Differentiation (CD) Antigen Expression* Sean Lal‡§, Angus Brown‡, Lisa Nguyen¶, Filip Braet储, Wayne Dyer**, and Cris dos Remedios‡ Microparticles circulate in plasma and have recently emerged as potential inflammatory markers in cardiovascular disease. They are fragments of cell membranes that express cluster of differentiation (CD) antigens and are present at elevated levels in patients with acute coronary syndrome. We have developed a novel method for the rapid detection of microparticles in plasma using a fluorescence-based antibody array system. Isolated microparticles are captured on anti-CD antibody spots immobilized on a nitrocellulose membrane. These CD antibodies are directed against extracellular epitopes, whereas the intracellular exposed surface of the microparticles is labeled with a fluorescent anti-annexin antibody. The array is then scanned and quantified. A pilot study was undertaken to compare microparticle CD antigen expression in acute coronary syndrome and healthy subjects. Ten CD antigens (44, 45, 54, 62E, 79, 102, 117, 130, 138, and 154) had significantly increased expression in the disease group relative to the healthy controls. These results were then verified using flow cytometry and scanning electron microscopy. Although we have focused our analysis on changes in microparticle CD antigen expression, this technique is amenable to analyzing other surface markers. Microparticles can be derived from a wide variety of cell types, so selection of the primary antibody can be tailored to the cell origin that is to be investigated. Molecular & Cellular Proteomics 8: 799 – 804, 2009.
Microparticles are membrane fragments derived mainly from platelets and endothelial cells but also from leukocytes, smooth muscle cells, and erythrocytes. They are formed during apoptosis and range in size from 0.1 to 1.0 m. Their outer leaflets contain phosphatidylserine, which may be labeled From the ‡School of Medical Sciences, Bosch Institute, ¶School of Molecular and Microbial Sciences, and 储Electron Microscopy Unit, The University of Sydney, Sydney 2006, Australia and **Immunovirology Laboratory, Australian Red Cross Blood Service, Sydney 2000, Australia Received, July 23, 2008 Published, MCP Papers in Press, December 17, 2008, DOI 10.1074/mcp.M800335-MCP200
© 2009 by The American Society for Biochemistry and Molecular Biology, Inc. This paper is available on line at http://www.mcponline.org
with the phospholipid probe annexin V. Microparticles circulate in plasma and have recently emerged as potential inflammatory markers in cardiovascular disease (1). Coronary artery disease is caused by atherosclerosis, a disease of the large arteries (2). It can manifest as stable angina or as acute coronary syndrome (ACS).1 The latter is a broad term describing a group of clinical symptoms consistent with acute myocardial ischemia. Its clinical spectrum includes unstable angina, non-ST elevation myocardial infarction, and ST elevation myocardial infarction. Coronary artery disease is more than just a problem of lipid storage (3). It involves an ongoing inflammatory response (4). Lipids are thus one of many contributing factors, the most important being endothelium dysfunction. Normally the endothelial cell barrier is an antithrombogenic surface, releasing vasodilatory mediators such as nitric oxide (NO). There is tight regulation of vascular tone, leukocyte migration, and platelet adherence. Dysfunction of these mechanisms is associated with vascular inflammation and contributes to the development of atherosclerosis (5). When the arterial endothelium encounters insults from bacterial products, dyslipidemia, hyperglycemia, acute phase reactant proteins, or vasoconstrictor hormones, there is an increased expression of vascular adhesion molecules (6). Disruption of the endothelial cell barrier now promotes lipid migration into the intimal layer, initiating the atherosclerotic process. This process is dependent upon migration of leukocytes. These cells are recruited to the site of endothelial cell damage eventually forming an atherosclerotic plaque. Leukocyte adhesion to the endothelium relies on interactions with immunoglobulin-like adhesion molecules (7). Receptors such as vascular cell adhesion molecule-1 and intercellular adhesion molecule-1 are up-regulated on the endothelium in response to noxious stimuli (8). These molecules couple with the integrins expressed on rolling leukocytes and adhere these leukocytes to the endothelium (9).
1 The abbreviations used are: ACS, acute coronary syndrome; CD, cluster of differentiation; NO, nitric oxide; PDP, platelet-depleted plasma.
Molecular & Cellular Proteomics 8.4
799
Circulating Microparticle Capture in Acute Coronary Syndrome
This process of adherence and migration is dependent on a range of cell membrane receptors known as CD antigens. CD antigens are membrane proteins mainly expressed on leukocytes. A small number are also expressed on endothelial cells, erythrocytes, stem cells, and dendritic cells. The functions of CD antigens include cell receptors, serum protein receptors, and ion channels. Because microparticles are fragments of cell membranes they also express CD antigens, and elevated levels are present in patients with coronary artery disease compared with age-matched healthy controls (1). Endothelium-derived microparticles are more abundant in patients with ACS and appear to mirror the level of endothelial dysfunction (10). In addition, plaque stability correlates with the level of circulating microparticles where the expression of specific CD antigens is significantly increased in patients with high risk lesions (11). Microparticles also have an active biological role, depending on the cellular origin of the microparticles. The vasodilatory effect of NO is disturbed by endothelial cell- and leukocyte-derived microparticles. The former appears to reduce endothelial-derived NO release, whereas the latter reduces nitric-oxide synthase expression; both result in endothelial dysfunction (1). In vitro T cell-derived microparticles cause vascular contraction by the inhibition of endothelium-dependent relaxation (12). Microparticles originating from platelets lead to endothelial activation through the production of inflammatory cytokines and adhesion molecules, both of which exacerbate endothelial dysfunction. The identification of specific microparticle-based CD antigens in coronary artery disease has not been extensively studied. The studies that do exist have only examined changes in the expression of three to four CD antigens because they were constrained by the analytical capacity of flow cytometry, the current “gold standard” for measuring the expression of CD antigens. Using the proteomic expression on an external cell membrane, the origin of the microparticles can be determined by using specific antibodies against epitopes located on these membranes. These can then be detected using flow cytometry or ELISA. We have developed a novel method for the rapid detection of cell membrane-derived microparticles using a fluorescence-based antibody array system. Isolated microparticles are captured on a nitrocellulose membrane on which anti-CD antibody spots are immobilized. A fluorescent secondary probe, Cy5-labeled anti-annexin V antibody, labels the captured microparticles. Scanning the array identifies and quantifies the fluorescent microparticles on those spots. Here we report a pilot study that compared CD antigen expression on microparticles derived from ACS and healthy subjects. We found increased expression levels of several different CD antigens in the disease group compared with samples from healthy subjects. These results were then verified using flow cytometry and electron microscopy.
800
Molecular & Cellular Proteomics 8.4
EXPERIMENTAL PROCEDURES
Construction of the Test Antibody Array—Initial construction of the test antibody array involved manually spotting 1-l anti-CD antigen antibody spots on a virgin nitrocellulose slide (FAST slide, Schleicher & Schuell). A plastic transparency template was used to mark the position of each spot. The array was then air-dried at room temperature before the entire slide was blocked for 4 h in 5% skim milk powder. The slide was thoroughly washed three times in PBS before air tight storage at 4 °C until further usage. For the pilot study involving the ACS and healthy control cohorts, commercially preprepared antibody arrays were purchased (DotScan, MEDSAIC). These arrays contain over 80 different anti-CD antibody spots, but because of limitations in our sample volume only 50 of these markers were utilized for the pilot study. The construction and use of these arrays has been described previously (13). Preparation of Blood Samples—Blood samples were drawn into 5-ml EDTA tubes and centrifuged (700 ⫻ g, 10 min, no brake) to isolate white blood cells and platelet-rich plasma. Platelet-rich plasma was aspirated and centrifuged again to pellet platelet-depleted plasma (PDP). Aliquots of 500 l of PDP were snap frozen in liquid nitrogen and stored at ⫺80 °C until further analysis. Isolation of Microparticles—The 500 l of frozen PDP was thawed at room temperature for 20 min and then centrifuged (1500 ⫻ g, 30 min, no brake). After centrifugation ⬃400 l of supernatant was removed leaving a concentrated pellet of microparticles. The suspension was diluted to the original volume of PDP with Annexin buffer (1 mM HEPES, 14 mM NaCl, 2.5 mM CaCl2, pH 7.4). This buffer replaces the Ca2⫹, which is essential for the Annexin V conjugation. Arraying the Microparticles—Microparticles were isolated and incubated on the antibody array for 30 min in a humidifier (25 °C). Approximately 300 l of sample was required to cover the desired surface area of the array. Following incubation the array was stood at a 45° angle, allowing excess (unbound) particles to be removed. The slide was then placed in a 5% formaldehyde solution and fixed overnight at 4 °C. The fixed antibody array was air-dried at room temperature. A 300-l solution of 1⫻ PBS with a 1:250 dilution of Annexin V-Cy5 (BD Biosciences) was prepared and added onto the array surface. It was allowed to incubate for 30 min in the dark. The slide was then thoroughly washed three times in PBS and allowed to air dry at room temperature. The arrays were imaged with an Axon GenePix 4000B scanner using the program GenePix 3.0 (Axon). A high intensity scan with photomultiplier tube gain (voltage) of ⬃600 V for the Cy5 wavelength (635 nm) was performed. The resultant spot intensities were quantified with GenePix 3.0 using a customized grid overlay. SDS-PAGE—Protein samples were separated by 10% (w/v) SDSPAGE based on their molecular weight. Gels were poured using the Bio-Rad gel cassette. Loading buffer (2% (w/v) SDS, 5% (v/v) -mercaptoethanol, 0.1% (w/v) bromphenol blue) was added to each sample prior to loading. Each lane was loaded with 4 g of protein (10 l). The gel was run for 60 min in Tris running buffer (0.025 M Tris-HCl, pH 8.3, 0.192 M glycine, 0.1% (w/v) SDS, pH 8.3) at 160 V. PVDF Membrane Transfer—The protein bands in the gel were transferred onto an equilibrated (methanol and transfer buffer (0.025 M Tris base, 0.192 M glycine, 0.05% (w/v) SDS)) PVDF membrane (Invitrogen). Transfer occurred at a constant current of 200 mA for 3 h at 4 °C in transfer buffer. The gels were then stained with Coomassie (Brilliant Blue G, Sigma-Aldrich) and destained in a solution containing 30% (v/v) methanol and 10% (v/v) acetic acid. This confirmed that all protein bands had been transferred. Western Blot—The PVDF membrane was blocked overnight in TBS-Tween (2 mM Tris base, 0.014 M NaCl, 0.05% (v/v) Tween 20, pH 7.5) with 5% (w/v) nonfat skim milk powder at 4 °C. This prevented
Circulating Microparticle Capture in Acute Coronary Syndrome
nonspecific binding of the primary antibody. The next morning the membrane was washed three times in TBS-Tween (2 ⫻ 5 min and 1 ⫻ 10 min). The membrane was then incubated with Cy5-labeled primary antibody annexin V (1:1000) diluted in TBS-Tween (5 ml) for 2.5 h at 4 °C. The membrane was washed again four times in TBS-Tween (2 ⫻ 5 min, 1 ⫻ 10 min, and 1 ⫻ 15 min) to remove excess antibody. The membrane was scanned using Cy5 (635 nm) excitatory wavelengths on a Typhoon imager (GE Healthcare). Optical densities of the bands were viewed using ImageQuant 5.1 software (GE Healthcare). Flow Cytometry—Microparticle suspensions were doubled labeled with annexin V antibody and one anti-CD antibody. Annexin V buffer, containing the microparticles, was added to 12 ⫻ 7.5-mm polypropylene tubes (BD Biosciences) and incubated with Annexin V-Cy5 (BD Biosciences) and FITC-conjugated CD44, CD79 (BD Biosciences), CD62E, and CD102 (Abcam). Following incubation, samples were resuspended in Annexin V binding buffer. To assess nonspecific binding anti-mouse isotype control antibodies were used as the negatively stained population. Microparticles were identified and quantified using a BD FACS Canto flow cytometer (BD Biosciences) based on two criteria: size and positive double antibody labeling. With respect to size, microparticles were identified by gating on forward scatter and side scatter with calibration beads (BD Biosciences). Gating identified particles ⬍1 m that were greater than the background noise of the machine. Using this gated population, two-parameter flow cytometry was performed. A negative sample with Annexin V buffer and one of the two antibodies used (Annexin V-Cy5 and anti-CD62E-FITC) was used to assess the possibility of aggregated antibody appearing as microparticles, but this number was negligible. The flow cytometry data were analyzed in Microsoft Excel. Microparticles were expressed as microparticles/l of PDP (microparticles/ l). For comparison between groups (healthy blood donors and ACS) a Student’s t test was performed using Microsoft Excel statistical settings. Electron Microscopy Imaging—An array similar to the test array described above was constructed. However, only two spots were placed on the surface (each 1 l in volume). Following air drying the slide was then blocked as described above. Microparticles were isolated from a fresh blood sample taken from a patient with ACS. Flow cytometry was then used to positively select microparticles based on size and binding to Annexin V-Cy5 as described above. One microliter from this population was then incubated on one of the antibody spots on the array for 30 min. The other spot served as a negative control. Following incubation, the slide was placed in a 2% glutaraldehyde sodium cacodylate buffer (0.1 and 0.1 M sucrose) solution and allowed to fix overnight at 4 °C. Further fixation of the array required 1% osmium in 0.1 M sodium cacodylate for 1 h. The slide was then dehydrated in graded ethanol solutions (70%, 80%, 90%, and 3 ⫻ 100%) for 10 min each. Samples were next dried in 100% hexamethyldisilazane for 3 min, transferred to a desiccator for 25 min, mounted on stubs, sputter coated with 10-nm gold, and examined with a Philips XL30 scanning electron microscope (Eindhoven, The Netherlands) at 30 kV. RESULTS
Capturing and Imaging Microparticles Test antibody arrays were constructed consisting of CD44 and CD45 antibodies to determine whether microparticles isolated from plasma can be captured and imaged. Construction of the Test Antibody Array—Each test array consisted of a virgin nitrocellulose slide onto which were placed duplicate anti-CD44 spots and a single anti-CD45
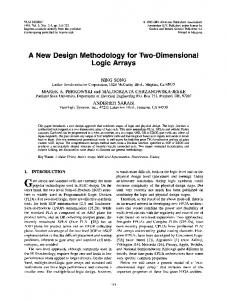
FIG. 1. Test microparticle antibody array. From left to right, the first two spots consist of anti-CD44 and anti-CD45 antibodies. The third antibody spot is also anti-CD45 but serves as a negative control to which no microparticles were added.
spot. These CD antigens were chosen because they are known to be universally expressed on leukocytes. Microparticles from the plasma of a healthy blood donor were arrayed on one CD44 and one CD45 spot. The third CD44 spot functioned as a negative control. Following fixation in 4% formaldehyde, the slide was next rinsed with PBS, and then a Cy5-labeled annexin antibody was applied to all three spots. The array was imaged using a Typhoon scanner and imported into Photoshop (Fig. 1). The slide demonstrates that the microparticles are specifically bound to both CD44 and CD45 antibodies. Microparticle Study—On the basis of the above test array, a pilot study was undertaken using microparticles isolated from nine ACS patients and nine aged-matched healthy controls. Blood samples from the former were taken from patients admitted to the Cardiology Department of Royal Prince Alfred Hospital, Camperdown (Sydney, Australia). Blood samples from the healthy controls were obtained through the Australian Red Cross. Both studies were approved by human ethics. To simultaneously analyze the expression of a large number of CD antigens, preprepared commercially available antibody arrays were purchased (DotScan, MEDSAIC). These arrays consist of over 80 CD antibodies robotically arrayed on a nitrocellulose-coated glass slide. These arrays have been used previously to analyze cell-based CD antigen expression in leukemia (13). Isolated microparticles from each cohort were arrayed on single DotScan slides. Following fixation, a Cy5-labeled annexin V antibody was applied to the area before the array was imaged using an Axon GenePix 4000B scanner. Two arrays are shown in Fig. 2. The image on the left shows a healthy control sample, whereas the right panel illustrates microparticles from an ACS patient. The result demonstrates that the microparticles bind specifically to the immobilized anti-CD antibodies. The different fluorescence intensities show that the spots exhibit a range of intensities depending on the anti-CD antigen expressed on the applied microparticles. For each array, the background fluorescence intensities were measured locally around each spot to generate an average intensity that was then normalized for the entire background of each array. This normalized intensity for each spot was
Molecular & Cellular Proteomics 8.4
801
Circulating Microparticle Capture in Acute Coronary Syndrome
TABLE II Flow cytometry confirmation of increased expression of CD antigens on microparticles CD antigen 44 62E 79 102
FIG. 2. Microparticle antibody arrays from the pilot study. The first panel represents a healthy control, whereas the second panel represents a patient with ACS. The third panel is a template indicating the location of each anti-CD antibody. TABLE I Changes in microparticle CD antigens in patients with acute coronary syndrome compared with healthy blood donors CD antigen 44 45 54 62E 79 102 117 130 138 154
Cellular origin Leukocytes (not platelets) Leukocytes (not platelets or endothelial cells) T and B cells, monocytes, and activated endothelial cells Exclusive to endothelial cells B cells Monocytes and endothelial cells Hematopoietic progenitor cells Activated B cells, leukocytes, and endothelial cells Plasma cells T cells
averaged across the cohort. -Fold intensity changes for each antibody spot could then be compared between the ACS and healthy cohorts. The results show that there were 10 CD antigens (44, 45, 54, 62E, 79, 102, 117, 130, 138, and 154) with significantly increased expression in the ACS group relative to the healthy controls (Table I).
Verification of the Microparticle Results Western blot analysis was used to verify the presence of annexin V in the sample and its binding to the Cy5-labeled annexin V antibody. Direct imaging of the microparticles captured on the antibody array was undertaken using scanning electron microscopy. Confirmation of the findings from the microparticle study was undertaken using flow cytometry. Western Blot—Western blot analysis revealed a band at ⬃35 kDa, corresponding to the molecular mass of annexin V (data not shown). Flow Cytometry—Flow cytometry analysis was undertaken on samples from four ACS patients and four healthy controls from the pilot study. Four of the 10 changes in CD antigen
802
Molecular & Cellular Proteomics 8.4
Mean cell count ACS
Control
23.63 247.90 53.71 115.49
11.71 99.36 11.41 61.33
p value 0.001 0.010 0.025 0.027
expression were analyzed: CD44, CD79, CD62E, and CD102. Verification of the results involved double staining of the isolated microparticles for both annexin V and the respective CD antigen marker. The results of the flow cytometry analysis are shown in Table II. The expression of the four CD antigens (CD44, CD79, CD62E, and CD102) was significantly increased in the microparticle populations of the ACS patients compared with the healthy blood donors. Scanning Electron Microscopy—Microparticles, isolated from the plasma of an ACS patient, were positively selected for fluorescently labeled annexin V using fluorescence-activated cell sorting. This selected sample was then placed on a test array consisting of two anti-CD44 antibody spots deposited on a nitrocellulose membrane. One spot was used as a negative control. To visualize the microparticles at high resolution, the array was investigated using scanning electron microscopy (Fig. 3). The images show that specific binding of the microparticles is limited to the antibody spot. The outer part of the spot contains phosphate crystals from the buffer solutions, but the inner sections (progressively from the upper left to the lower right) clearly show membrane fragments. These microparticles express annexin V on their inner (cytoplasmic) surface as well as the extracellular CD44 antigen on their outer surface. DISCUSSION
We have developed a novel method for analyzing microparticle membrane fragments based on their expression of CD antigens. The initial test array demonstrated that microparticles, isolated from human plasma, can be captured on a platform based on the surface antigens they express. The outer surfaces of the microparticles bind to the primary antibodies on the array, exposing the inner phospholipid membranes to the secondary antibody (annexin V). Conjugating this antibody to a fluorescent probe (Cy5) allows direct visualization of the binding. Using Western blots we confirmed the presence of annexin V using an anti-annexin-Cy5 antibody. The scanning electron microscopy images provide a more detailed view of the microparticles captured on the antibody array. These images show cell fragments of varying morphology expressing both CD44 and annexin V. Hence these microparticles are likely to be derived from leukocytes.
Circulating Microparticle Capture in Acute Coronary Syndrome
FIG. 3. Electron microscope images of arrayed microparticles. Images are from lower to higher magnifications (progressively from the upper left to the lower right). These images correspond with depicting specific binding of the microparticles to the antibody on the array to focusing on individual microparticles. Magn, magnification; Acc.V, acceleration voltage; WD, working distance; Det, detection; SE, secondary electron.
Although we have focused our analysis on changes in microparticle CD antigens, this technique is amenable to analyzing other surface markers. Microparticles can be derived from a wide variety of cell types, and selection of the primary antibody can be tailored to the cell origin that is to be investigated. Our study has demonstrated that 10 CD antigens are preferentially associated with microparticles isolated from patients with ACS compared with healthy controls. We confirm the increases in CD54 and CD62E reported in a recent study (14), but the remaining eight changes are, to the best of our knowledge, novel findings. We have already discussed how monocytes, granulocytes, and endothelial cells play an integral role in the pathogenesis of atherosclerosis. Our results include microparticles derived from these cell types demonstrating increased expression of CD antigens 44, 45, 54, 62E, 102, and 130. We also found increased expression of CD antigens derived from lymphocytic microparticles (CD79, CD130, CD138, and CD154). Early studies using immunocytochemical staining have shown T cells to be present within atherosclerotic plaques (15); and more recently, the role of the adaptive immune system in the development of atherosclerosis has been recognized (16). However, it is still
uncertain what part B cells play in atherosclerosis and hence how B cell-derived microparticles come to be found in the circulation of patients with ACS. Our results were validated using flow cytometry. Microparticles were identified based on gating of size relative to calibration beads as well as positive staining for both annexin V and specific CD antigens. Four of the 10 identified CD antigen changes from the microparticle study were attempted and confirmed using this technique. In this study we analyzed only a handful of CD antigens. There are some 334 CD antigens that have been designated. The technique we describe can be modified to simultaneously analyze changes in the expression of all of these CD antigens plus any other surface markers expressed by microparticles. In doing so, almost certainly more changes in microparticlebased CD antigen expression would be identified in patients with ACS. Furthermore this study included only healthy controls and patients with ACS. A more extensive study could be undertaken to compare microparticle-based CD antigen expression in patients with stable angina, unstable angina, and myocardial infarction. It is here that the diagnostic and possibly prognostic value of this technique could be realized.
Molecular & Cellular Proteomics 8.4
803
Circulating Microparticle Capture in Acute Coronary Syndrome
Acknowledgments—We are grateful to the staff of the cardiology department at Royal Prince Alfred Hospital Sydney for their assistance in collecting the ACS samples. We also thank the Australian Red Cross for assistance in collecting the healthy control samples. We also acknowledge access to the flow cytometry facilities as well as technical assistance from staff in the Centenary Institute of The University of Sydney. We are also indebted to Su Ying Ying and Dr. Deborah Barton from the Australian Key Centre for Microscopy and Microanalysis for expert assistance in the processing of samples for electron microscopy analysis. * This work was supported in part by Australian Research Council/ National Health and Medical Research Council Fluorescence Applications in Biotechnology and Life Sciences Network Grant RN0460002 and by an Australian Research Council Network grant (to C. d. R., F. B., and W. D.). § To whom correspondence should be addressed. Tel.: 61-293513266; Fax: 61-2-93516546; E-mail:
[email protected]. REFERENCES 1. Boulanger, C. M., Amabile, N., and Tedgui, A. (2006) Circulating microparticles: a potential prognostic marker for atherosclerotic vascular disease. Hypertension 48, 180 –186 2. Lusis, A. J. (2000) Atherosclerosis. Nature 407, 233–241 3. Hayden, M. R., and Reidy, M. (1995) Many roads lead to atheroma. Nat. Med. 1, 22–23 4. Libby, P. (2002) Inflammation in atherosclerosis. Nature 420, 868 – 874 5. Kharbanda, R. K., and Deanfield, J. E. (2001) Functions of the healthy endothelium. Coron. Artery. Dis. 12, 485– 491 6. Piro, M., Giubilato, G., Pinnelli, M., Giordano Sciacca, P., and Biasucci, M. (2005) Endothelium and inflammation. Panminerva Med. 47, 75– 80 7. Blankenberg, S., Barbaux, S., and Tiret, L. (2003) Adhesion molecules and atherosclerosis. Atherosclerosis 170, 191–203
804
Molecular & Cellular Proteomics 8.4
8. Li, H., Cybulsky, M., Gimbrone, A., and Libby, P. (1993) An atherogenic diet rapidly induces VCAM-1, a cytokine-regulatable mononuclear leukocyte adhesion molecule, in rabbit aortic endothelium. Arterioscler. Thromb. 13, 197–204 9. Eriksson, E., Xie, X., Werr, J., Thoren, P., and Lindbom, L. (2001) Importance of primary capture and L-selectin-dependent secondary capture in leukocyte accumulation in inflammation and atherosclerosis in vivo. J. Exp. Med. 194, 205–218 10. Bernal-Mizrachi, L., Jy, W., Jimenez, J. J., Pastor, J., Mauro, L., Horstman, L., de Marchena, E., and Ahn, Y. (2003) High levels of circulating endothelial microparticles in patients with acute coronary syndromes. Am. Heart J. 145, 962–970 11. Bernal-Mizrachi, L., Jy, W., Fierro, C., Macdonough, R., Velazques, A., Purow, J., Jimenez, J., Horstman, L., Ferreira, A., de Marchena, E., and Ahn, S. (2004) Endothelial microparticles correlate with high-risk angiographic lesion in acute coronary syndromes. Int. J. Cardiol. 97, 439 – 446 12. Martinez, C. M., Tesse, A., Zobairi, F., and Andriansitohaina, R. (2005) Shed membrane microparticles from circulating and vascular cells in regulating vascular function. Am. J. Heart Circ. Physiol. 288, 1004 –1009 13. Belov, L., de la Vega, O., dos Remedios, C. G., Mulligan, S. P., and Christopherson, R. I. (2001) Immunophenotyping of leukemias using a cluster of differentiation antibody microarray. Cancer Res. 61, 4483– 4489 14. Chirinos, J. A., De Marchena, E., Ferreira, A., Alfonso, C., Veerani, A., Arley, P., Rene, P., Wenche, J., Joaquin, J., Lawrence, H., and Yeon, A. (2006) Differential elevation of endothelial microparticles and their binding to leukocytes in acute coronary syndromes. Chest 130, 190S 15. Hansson, G., Jonasson, L., Lojsthed, B., Stemme, S., Kocher, O., and Gabbiani, G. (1988) Localization of T lymphocytes and macrophages in fibrous and complicated human atherosclerotic plaques. Atherosclerosis 72, 135–141 16. Binder, C. J., Chang M. K., Shaw P. X., Miller Y. I., Hartvigsen, K., Dewan, A., and Witztum, J. L. (2002) Innate and acquired immunity in atherogenesis. Nat. Med. 8, 1218 –1226