APPLIED PHYSICS LETTERS
VOLUME 78, NUMBER 1
1 JANUARY 2001
Intense blue-light emission from carbon-plasma-implanted porous silicon Weili Liu, Miao Zhang, and Chenglu Lin State Key Laboratory of Functional Materials for Imformatics, Shanghai Institute of Metallurgy, Chinese Academy of Science, Changning Road 865, Shanghai 200050, China
Zhaoming Zeng, Lianwei Wang, and Paul K. Chua) Department of Physics and Materials Science, City University of Hong Kong, 83 Tat Chee Avenue, Kowloon, Hong Kong
共Received 30 August 2000; accepted for publication 9 November 2000兲 We have investigated the room-temperature photoluminescence 共PL兲 characteristics of porous-silicon plasma implanted with carbon. Before implantation, the porous silicon made by anodizing emits intense orange light. After carbon-plasma-immersion ion implantation, the orange light disappears and blue light appears. Furthermore, intense blue light is obtained after annealing at 400 °C for 30 min. Analytical results show that the quenching of orange light and appearance of blue light are due to the reduction of the size of nanocrystallites caused by implantation. The effects of different annealing temperature on the light-emission properties of the implanted porous silicon are also studied. The intensity decreases with increased temperature from 600 to 1000 °C, but the PL intensity increases drastically again after annealing at 1250 °C due to the formation of a substance. © 2001 American Institute of Physics. 关DOI: 10.1063/1.1337622兴
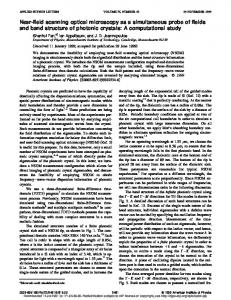
carbon-plasma-implanted porous silicon after annealing at 400 °C for 30 min. Phosphorus-doped 具100典 Si wafers, with resistivity of 1–3 ⍀ cm, were anodized in an electrolyte composed of HF:ethanol⫽1:1 at a current density of 10 mA/cm2 for 10 min without illumination to form porous silicon. The porous silicon was subsequently implanted with a carbon dose of 1⫻1017 cm⫺2 using a custom-designed plasma-immersion ion implanter with a base pressure of 1⫻10⫺5 . 9 The sample bias voltage, pulse duration, and the repetition rate were ⫺10 kV, 350 s, and 66 Hz, respectively. Compared to conventional beam-line ion implantation, plasma-ionimmersion implantation has many advantages, such as instrument simplicity, efficiency, throughput, and easy variation of implantation energy.8 The implanted samples were subsequently annealed at different temperatures from 400 to 1250 °C for 30 min in flowing N2. Photoluminescence 共PL兲 spectra were acquired at room temperature using a Hitachi F4010 fluorescence spectrophotometer using a Xe lamp as the excitation source. Fourier transformation infrared spectroscopy 共FTIR兲 and x-ray photoelectron spectroscopy 共XPS兲 were used to characterize the samples. Based on TRIM calculation, the projected range (R p ) of ⫹ C in single-crystal silicon is 31.6⫾17.4 nm, but should be larger in porous silicon. Based on the Rutherford backscattering results acquired from the as-implanted sample, the implanted carbon is distributed from the surface to a depth of 70 nm. Therefore, the excitation light used in this experiment passes through the implanted layer. Figure 1 shows the room-temperature PL spectra of the porous silicon before and after carbon PIII using an excitation wavelength of 250 nm. It can be observed that the unimplanted porous silicon emits orange light with the peak of the radiation at 603 nm, and the light is intense enough to observe with the naked eye. After implantation, the orange-light peak disappears completely and the results are consistent with reports in the
Porous silicon has been shown to exhibit efficient, visible, and room-temperature photoluminescence.1 Various kinds of porous silicon emitting light ranging from red to blue have been fabricated. However, strong photoluminescence emission is generally in the red-green region, and bluelight-emitting porous-silicon materials are difficult to prepare. Because porous silicon giving off blue light has large porosity, the material is very fragile and difficult to synthesize by anodizing in HF solution. Some approaches, such as high-temperature annealing,2 boiling-water treatment,3 and spark erosion4 have been attempted. The objective of these methods is the same, that is, to reduce the size of the silicon nanocrystals to further enlarge the band gap of Si, but unfortunately, the emission intensity is weak, and the stability and reproducibility are poor. The effects of implantation on the luminescence of porous silicon have been studied.5,6 The results show that implanting a small dose of dopant atoms such as B and P maintains or even increases the continuous-wave photoluminescence intensity and increases the time-dependent photoluminescence decay time, while high-dose dopant implantation quenches the photoluminescence efficiency.6 In Refs. 5 and 6, blue emission was not reported. Liao et al.7 reported that porous SiC on crystal Si could be obtained by annealing C⫹-implanted silicon and blue-light emission could result. However, there have been no reports on the luminescence of porous silicon implanted with carbon. In this work, porous silicon was implanted with carbon by plasma-immersion ion implantation 共PIII兲, and the luminescence properties of samples annealed at different temperatures were investigated. PIII is a simple and efficient implantation technique in which the implantation time is independent of the wafer size.8 Our results show that intense blue light is emitted from a兲
Author to whom correspondence should be addressed; electronic mail:
[email protected]
0003-6951/2001/78(1)/37/3/$18.00
37
© 2001 American Institute of Physics
38
Appl. Phys. Lett., Vol. 78, No. 1, 1 January 2001
Liu et al.
FIG. 1. PL spectra of porous silicon before and after implantation.
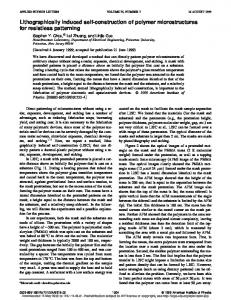
literature.5,6 Furthermore, in our PL spectrum, a peak at 454 nm appears after implantation, but the amplitude of the peak is quite small. Damage is inevitably created by implantation, and so we annealed the sample at different temperatures. As shown in Fig. 2, after annealing for 30 min at 400 °C, the PL intensity increases substantially and exceeds that of the orange light emitted from the unimplanted porous silicon illustrated in Fig. 1. This broad peak actually comprises four overlapping peaks with the strongest one located in the blue region. The PL intensity decreases with higher annealing temperature from 600 to 1000 °C. After annealing at 1000 °C, the intensity of the luminescence is very small and the location of the most intense peak has changed. Upon further annealing at 1250 °C, the PL intensity rises again. The results of Peng et al.6 show that annealing can restore the PL intensity partially. From our PL spectra, the orange light does not reappear even after high-temperature annealing, and so it is believed that the disappearance of the orange light is not caused by implantation-induced damage. Porous silicon is fragile and easily destroyed during implantation to become smaller crystallites. According to the quantum-confinement effects, the fundamental band gap of Si quantum wires at 300 K is a function of the wire size.10 Hence, the quenching of orange light and resurgence of blue light are probably due to the reduction of the size of the nanocrystallites in porous silicon by implantation. After annealing at 400 °C for 30 min, the damage caused by implan-
FIG. 2. PL spectra of implanted porous silicon annealed at different temperatures.
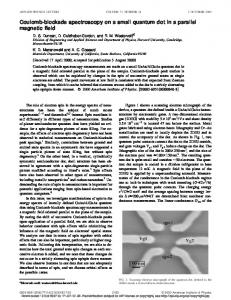
FIG. 3. FTIR spectra of the unimplanted sample, as-implanted sample, as well as sample annealed at different temperatures.
tation is removed partially, and so is the number of nonradiative centers. Therefore, the PL intensity increases precipitously. In addition, luminescence is usually related to the composition of the samples. In the FTIR spectra depicted in Fig. 3, peaks at 460, 627, 835, 870, 1040–1160, 2088– 2111, and 2250 cm⫺1 represent Si–O–Si bending, Si–H2 deformation, Si–H2 wagging, Si–H2 scissor, Si–O–Si stretching, Si–H stretching, and O–Si–H stretching, respectively. Compared with the unimplanted porous-silicon spectrum, no new peak appears after implantation, but the intensity of some peaks related to Si–Hx is reduced. In addition, the hydrogen content diminishes with annealing temperature. It has been reported that hydrogen can passivate the surface of silicon wires to enhance the luminescence of porous silicon.11 Thus, we believe that the behavior between 400 and 1000 °C is a competition between the elimination of implantation damage and reduction of surface hydrogen. When the annealing temperature is low, the former mechanism dominates, whereas the reduction of surface hydrogen takes precedence when the annealing temperature is higher than 600 °C. After annealing at 1250 °C, many new peaks such as those at 488, 687, and 847 cm⫺1 emerge in the FTIR spectrum. Among them, peaks at 687 and 847 cm⫺1 represent stretching vibration of Si–C bonds in compounds with Si, C, and H, while the peak at 488 cm⫺1 indicates Si–O–C vibration. FTIR conveys both surface and bulk information and XPS discloses more specifically the surface composition and chemical states. Before the XPS measurement, the samples were sputter etched for several minutes to remove surface contaminants. Figure 4 shows the Si 2p spectra acquired from carbon-plasma-implanted porous silicon 共a兲 without annealing, 共b兲 annealed at 1000 °C, and 共c兲 annealed at 1250 °C for 30 min. It can be readily observed that the three spectra are quite different. For the as-implanted sample, there is only one Si 2p peak at 99.2 eV, and the spectrum of the 1000 °C
Liu et al.
Appl. Phys. Lett., Vol. 78, No. 1, 1 January 2001
39
that in SiO2. Both the FTIR and XPS results suggest that there are substances created at 1250 °C and they may be silicon carbide with oxygen. Therefore, the increase in the PL intensity is likely due to the formation of these substances. Contrary to crystalline Si implanted with C⫹, 12 SiC is not detected directly in our experiments. It may be because the carbon atoms are dispersed throughout this surface layer and oxidation at high temperature is easier. In summary, we have presented a technique to prepare porous silicon that emits intense blue light and the materials have potentials in the display and white-light industry. Our experiments show that carbon-plasma-immersion ion implantation quenches the orange light in porous silicon, and intense blue-light emission is instead observed after annealing. Annealing within a certain temperature range increases the PL intensity because of the removal of damage created during implantation. However, the reduction of hydrogen at high temperature decreases the PL intensity. When the annealing temperature reaches 1250 °C, the PL intensity increases again, and our FTIR and XPS results indicate that it is due to the formation of silicon carbides with O or H. The work described in this letter was jointly supported by grants from the Chinese Natural Science Foundation 共69906005兲, Shanghai Science Developing Foundation 共99JC14012兲, Hong Kong Research Grants Council 共CERG No. 9040412 or CityU 1003/99E and No. 9040498 or CityU 1032/00E兲, as well as the City University of Hong Kong 共SRG No. 7001028兲. L. T. Canham, Appl. Phys. Lett. 57, 1046 共1990兲. M. K. Lee and K. R. Peng, Appl. Phys. Lett. 62, 3159 共1993兲. 3 X. Y. Hou, G. Shi, W. Wang, F. L. Zhang, P. H. Hao, D. M. Huang, and X. Wang, Appl. Phys. Lett. 62, 1097 共1993兲. 4 D. Ruter, T. Kunze, and W. Bauhofer, Appl. Phys. Lett. 64, 3006 共1994兲. 5 J. C. Barbour, D. Dimos, T. R. Guilinger, and M. J. Kelly, Nanotechnology 3, 202 共1992兲. 6 C. Peng, P. M. Fauchet, J. M. Rehm, G. L. McLendon, F. Seiferth, and S. K. Kurinec, Appl. Phys. Lett. 64, 1259 共1994兲. 7 L. S. Liao, X. M. Bao, Z. F. Yang, and N. B. Min, Appl. Phys. Lett. 66, 2382 共1995兲. 8 P. K. Chu, S. Qin, C. Chan, N. W. Cheung, and L. A. Larson, Mater. Sci. Eng., R. 17, 207 共1996兲. 9 P. K. Chu, B. Y. Tang, Y. C. Cheng, and P. K. Ko, Rev. Sci. Instrum. 68, 1866 共1997兲. 10 V. Lehmann and U. Gosele, Appl. Phys. Lett. 58, 856 共1991兲. 11 L. M. Peter, D. J. Blackwood, and S. Pons, Phys. Rev. Lett. 62, 308 共1989兲. 12 Y. H. Gao, Z. Zhang, L. S. Liao, and X. M. Bao, J. Mater. Res. 12, 1640 共1997兲. 1 2
FIG. 4. Si 2 p XPS spectra of the porous-silicon samples: 共a兲 as implanted, 共b兲 implanted and annealed at 1000 °C, and 共c兲 1250 °C.
sample can be deconvoluted into two peaks at 103.4 and 99.2 eV, indicating the existence of Si in SiO2 and crystal silicon, respectively. In the spectrum of the 1250 °C specimen, besides the two peaks observed in the 1000 °C sample shown in Fig. 4共b兲, there is an additional peak at 101 eV. Its binding energy is larger than that in SiC 共100.2 eV兲 and smaller than