Using Attitude Based Segmentation to Better Understand Viewers’ Usability Issues with Digital and Interactive TV Dr. Jonathan Freeman & Dr. Jane Lessiter i2 media research limited Department of Psychology Goldsmiths College University of London New Cross London SE14 6NW UK
[email protected]/
[email protected]
Abstract This paper describes the development of a consumer segmentation study based on category-specific attitudes towards digital and interactive TV, and attitudes to technology and general media consumption. The research was conducted for the Easy TV initiative – a joint initiative of the Independent Television Commission (ITC), Consumers’ Association and Design Council – whose aim is to promote easier to use digital television equipment. An earlier research survey (ITC-UsE, 2001) quantified the public's perceptions of the ease of use of digital and interactive TV. Perceived ease of use ratings for digital and interactive TV were much lower than for analogue TV; in fact, ratings were similar to those obtained for a personal computer. Subsequent research has focused on usability aspects relating to the user, the product and their interaction. In order to identify the ease of use issues affecting users with the biggest usability problems, a new large-scale attitudinal survey (n = 1333) was first conducted to identify distinct types of potential dTV user. Seven types ('clusters') of (existing and potential) dTV consumer were empirically derived from factor and cluster analyses of the survey data. The clusters generated were strongly differentiated in terms of dTV adoption, though the clustering itself was based solely on participants' attitudes. The clusters were then categorized into one of three groups according to their ratings of their perceived: (a) ease of use of dTV, (b) self-efficacy with technology, and (c) need and motivation for adopting dTV. These were labelled: (1) It's too complicated for me, (2) I can deal with it if there's content I want, and (3) It's too slow and clunky for me. These groupings have subsequently been applied to a series of dTV user trials, a detailed description of which is beyond the scope of the current paper.
Keywords ease of use, attitude(s), consumer segmentation, digital, interactive, television, TV, factor, cluster, analysis people have been actively motivated to switch to digital with incentives such as clearer picture and sound, increased choice, specialist content only available on dTV (e.g., religious interests), exclusive sports coverage, loyalty and interest in the full range of programmes offered by a particular broadcaster (e.g., trust in the BBC), and interactive services such as e-mail in homes where there is no personal computer (PC) available. More passive motivations include the need to replace an old or broken TV, being upgraded
Introduction There are now about 19 million adult viewers of digital TV (dTV) in the UK. This equates to approximately 43% of the UK population (MORI, 2002). There is currently a significant research effort focusing on issues relating to take-up of dTV, including explorations of consumers’ motivations, hurdles and barriers to adoption and use of dTV. Research has highlighted various factors which are pertinent to the adoption of dTV. Some 19
important attitudes that are directly relevant to the category being investigated, in this case digital TV.
from multi-channel analogue services by platform operators, and simply keeping up with the times. However, one person’s motivation can be another’s disincentive. For instance, the public appear fairly divided on the issue of increased choice. Some people feel that this increases their chance to watch what they want when they want (e.g., with repeats at different times of the day), while others feel they have sufficient choice with the five channels they have already – the key issue for them being quality not quantity.
One barrier to the adoption of dTV, or hurdle to overcome once dTV has been installed, is its perceived, or experienced, ease of use. Quantifying the scale of the ease of use issue with respect to dTV, and how it affects different types of consumer have been the foci of research to date for the Easy TV initiative. This initiative was launched in 2001 by the Independent Television Commission (ITC) in collaboration with the Consumers' Association (CA) and Design Council (DC). The prime goal of the initiative is to promote the need for easier to use domestic digital television equipment. Part of the research undertaken for this initiative has involved segmenting the market for dTV using a category specific approach. Attitudes directly relevant to the product category (i.e., dTV and interactive TV) and to the more general areas of media consumption and hi-tech product use were used to derive this segmentation. This approach was selected to gain an in-depth understanding of the range of consumer attitudes pertinent to the use of dTV.
A range of explanations have been cited as disincentives to switching to digital. These include high (perceived) cost, lack of knowledge (e.g., ‘I wouldn’t know how to get it even if I wanted it’), low interest because of perceived low need, desire or time, and perceptions that dTV is ‘complicated TV’. In addition, some of the new functions dTV provides are in competition with similar functions available on a PC. For users with access to a PC and the skills to use it the greater flexibility and speed of the PC set a high benchmark for dTV to meet. To examine the dTV market in terms of incentives, motivations, hurdles and barriers, consumer segmentation studies have been conducted. Traditionally, demographic segmentations have been employed. These involve dividing the market by factors such as gender, age, income, occupational status and education. For instance, e-MORI Technology Tracker monitors trends (by demographics) in the use and ownership of various technologies, including dTV. According to their January (2003) report, dTV penetration rates are 45% for AB, 41% for C1s, 45% for C2s and 31% for DEs. On some levels, demographics have relatively high predictive power (e.g., disposable income is likely to be higher for ABs compared with DEs) but for complex issues, demographics do not offer the same utility as do attitude-based segmentations.
Ease of Use – The ITC-UsE Survey As part of the first stage of the Easy TV research, a survey – the ITC-Usability Experiences Survey (ITC-UsE) – was commissioned by the ITC and conducted by researchers in the Psychology Department at Goldsmiths College, University of London. The ITC-UsE comprised four sections: (1) self-efficacy with technology; (2) perceived ease of use of a range of products; (3) knowledge about interactive and digital television; and (4) demographics and other background information. The content for the survey was informed by 10 interviews conducted to identify issues potentially related to dTV uptake. In addition, for section 2 (‘perceived ease of use’), a short Product Usability Survey was carried out using 51 people (17-77 years, mean age = 33 years, S.D = 11.8; 55% female). Respondents were required to generate any five products for each of the following categories: (a) easy to use, (b) moderately easy to use, (c) not very easy to use. Respondents were provided with some pointers to help them to decide how a product should be categorised. These included whether they considered the product: (a) was intuitive, (b) required help facilities/training, (c) was memorable, and (d) was easy to make mistakes with. They were
Consumer segmentation based on attitudes and values can be both category specific (as described here) and non-category specific (‘life’ attitudes) (e.g., Blamires, 2000). The latter segmentation approach has been based, for instance, on durable social values, beliefs and motivations (e.g., thevaluescompany.com, MORI-Socioconsult). Values based approaches such as these are likely to offer utility in understanding certain aspects of consumer behaviour. However, it is possible that a category specific approach, as utilised in the study reported here, is better able to reveal 20
tended to rate interactive TV as easier to use than others (e.g., people with prior experience vs. naïve respondents, younger vs. older people, men vs. women). However, people with prior interactive TV experience (32%) also rated other hi-tech products (e.g., ‘video recorder’, ‘mobile phone’) as easier to use compared with people who had no prior interactive TV experience. This suggests that interactive TV users may be more at ease and familiar with technology more generally. Nevertheless, the data from this first phase of Easy TV research suggested that low perceived ease of use constitutes a hurdle to adoption and/or use of dTV for some users.
instructed to think about the product group in general, rather than particular brands. A total of 217 products were generated across the categories – some were extremely familiar and commonly used (e.g., ‘kettle’), while others were much less so (e.g., ‘GPS satellite navigation’). The five most frequently nominated products within each category were selected for inclusion in the product list for the ‘perceived ease of use’ section of the ITC-UsE (e.g., easy to use – ‘hairdryer’; moderately easy to use – ‘washing machine’; not very easy to use – ‘video recorder’). ‘Photocopier’ and ‘cash point machine’ were added to this list to increase the number of non-domestic appliances. ‘Interactive TV’, and separately, ‘digital TV’ were added to examine how their perceived usability compared with these pre-rated products. Thus, relative rather than absolute ratings were explored.
Aims The ITC-UsE study raised issues that have been investigated further in research commissioned by ITC. Key research questions in this regard are what aspects of (a) the product(s), and (b) its users affect the extent to which digital and interactive television are perceived to be difficult to use? To address the issue of individual differences, the present study aimed to generate a typology based on (a) attitudes towards technology in general, (b) attitudes towards digital and interactive TV, and (c) viewers' motivations and barriers to the adoption and use of digital and interactive TV. This approach, which has been well used in the market research industry, is in contrast to more traditional demographic and non-category specific attitudinal based segmentation. It was anticipated that this classification would yield a better understanding of users most likely to face ease of use problems.
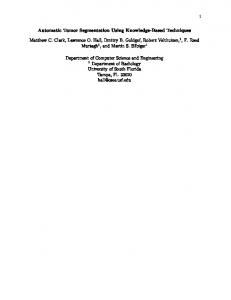
Over 1000 people were sampled across the UK for the ITC-UsE survey. In terms of perceived ease of use, in section 2, respondents were required to rate each product on the statement ‘This product is easy to use’ using a 4-point scale ranging from 1 (‘strongly disagree’) to 4 (‘strongly agree’). They were also required to indicate whether or not they had personally used this product before. As can be seen from Figure 1, digital and, separately, interactive TV fell among the top third most difficult to use products, while conventional analogue TV fell amongst the top third most easy to use. More specifically, on average dTV and interactive TV were perceived to be about as difficult to use as a PC. This was surprising given that the functionality of interactive TV is not as extensive as that of a PC. Some groups, however,
This product is easy to use... Ease of use rating 1=hard, 4=easy
4 3 2
TV R H ad i ai o rd ry e K r et To tle as te r
Se
A er
op M lan o w in t o e r g m bik ac e hi ne C om p u iT V te r Vi Dig /PC de it o al re TV co rd er M ob ile Ca r W Ph pho as o n hi toc e ng o m pie ac r M C hin C icr D P e as ow l a h po ave yer in o t m ve ac n hi ne
1
Figure 1. Perceived Ease of Use Ratings (ITC-UsE, 2001) 21
As the major focus of the research was ease of use a third stage of analysis was then conducted:
Method A 118-item questionnaire, the ITC-Media and Technology Experiences (ITC-MaTE), was developed. This consisted of three main attitude sections, namely, attitudes towards (a) technology (24 items: e.g., ‘I use hi-tech products to their full potential’), (b) media consumption (60 items: e.g., I tend to leave the TV on even if I’m not watching it’), and (c) interactive and digital television (34 items: e.g., ‘I am confused by the range of digital TV packages available’). A fourth section probed respondents for demographic information (e.g., age, sex, marital status, living arrangement, employment status and job title) and other potentially useful information (e.g., range of products and services available in their home).
•
Factor Analyses Three separate factor analyses (principal axis factoring: PAF) were run, one for each of the attitude sections. This was applied to explore and summarise the relationships between the questionnaire items. Section 1. Attitudes Towards Technology For section 1, the 24 items were entered into a PAF analysis with listwise deletion for cases with missing values (i.e., whole cases were excluded in all analyses for a missing response to a question). This was possible given the large sample size (n=1333) which is described as an ‘excellent’ number of cases for correlations to be reliably estimated (Comrey, 1973 in Tabachnick & Fidell, 1989). This value also greatly exceeds the rule of thumb method of estimating sample size suitability for factor analysis, which is five cases per observed variable (i.e., 24 x 5 = 120).
The 24-items from section 1 were empirically derived from a factor analysis of section 1 (‘Self Efficacy with Technology’) of the ITC-UsE (37 items). Items dropped for the ITC-MaTE were those that did not load significantly on any of the four factors derived from this data reduction procedure. The themes for sections 2 and 3 were based on earlier interview data and unprompted comments on the ITC-UsE which suggested that across different people television was viewed and valued differently as part of their overall lifestyles. The general importance of TV seemed to relate to knowledge about and attitudes towards dTV.
Inspection of the inter-item correlations revealed a large number of significant correlations suggesting good factorability of the data-set. The value for the Kaiser-Meyer-Olkin measure of Sampling Adequacy was greater then 0.5 (specifically, 0.97) and Bartlett’s test of Sphericity was highly significant (p < 0.000), both of which indicated that the data were suitable for PAF. (These ‘screening’ procedures were applied for each of the three sections subjected to PAF. The data were suitable for each analysis.)
Across each of the three attitudinal sections, the questionnaire consisted of a series of statements to which respondents were required to state the extent to which they agreed (‘5’) or disagreed (‘1’).
The well-known criterion of ‘eigenvalue greater than 1’ suggested a three factor solution for the data-set. However, the fourth factor had a borderline eigenvalue of 0.997 (followed by an eigenvalue that dropped to 0.744 for the fifth factor). Furthermore a four factor solution was anticipated given that a four factor solution previously described the data-set for the SelfEfficacy with Technology section in the ITC-UsE (albeit 37-items). Inspection of both the three and four factor solutions revealed that the four factor solution made more conceptual sense.
Sample Four thousand, eight hundred and seventy questionnaires were distributed across Great Britain during April and May 2002. There were 1333 returns giving a 27.4% response rate. The respondents were aged between 13 and 94 years (mean age = 53 years; S.D. = 19.07; 30 cases with exact age data missing). Forty-one percent of the sample were male (58% female, and 5 cases with missing sex data).
Results
With the four factor solution communality estimates for different variables ranged from 0.36 (‘I easily lose my temper when I use hi-tech products’) to 0.76 (‘I feel comfortable using most types of hi-tech product’). The four factors
The analysis of the ITC-MaTE to classify people into meaningful categories involved two stages:
•
Factor analyses of the three attitudinal sections of the ITC-MaTE.
•
Cluster analysis of the factors.
Subjective higher-order groupings of the clusters.
22
Factor 1: ‘Personal TV rejection’ - an anti-TV attitude in one’s life and a preference for alternative media (books, radio).
accounted for 55.9% of the variance in scores. They were then subjected to Varimax rotation. Many variables loaded higher than 0.3 on any factor in the rotated factor matrix, thus a more stringent cut-off of 0.4 was applied to establish themes and labels for the factors. In deciding which items would be used to compute a ‘factor score’, Bedford’s (1997) criterion of a primary loading being greater than 0.2 greater than any cross-loading was also applied (in addition to the 0.4 criterion).
Factor 2: ‘Why don’t you… moderate your TV intake’ - an attitude that everyone should cut down on TV. Factor 3: ‘Edu-info TV’ – an attitude that TV is a stimulating and thought-provoking medium. Factor 4: ‘Selective TV as part of a balanced healthy lifestyle’ - selective viewing patterns as part of a balanced, healthy lifestyle – the TV is only on when it’s being watched.
Factor 1: ‘Gadget Freakery – Active Technology Seeking’ - an above average positive attitude towards technology, a tendency to actively pursue the latest gadgetry, a desire to be an early user of that technology, and to get a ‘buzz’ from using and fully exploring novel and unfamiliar hi-tech products.
Factor 5: ‘Appointment TV’ – scheduled TV viewing and regular time shifting using a VCR. Factor 6: ‘Media quantity seeking’ – to enjoy having the choice from a variety of media at home. Factor 7: ‘Better costs more’ – a tendency to ‘believe the hype’; the ideal consumption attitude.
Factor 2: ‘Positive self-image as technology user’ – a sense of being comfortable, in control and competent in using and dealing with mistakes that arise in the use of hi-tech products.
Factor 8: ‘Active sociability’ – a preference for active and sociable pastimes over TV viewing. Factor 9: ‘Quality novel programme seeking’ – the tendency to value fresh ideas and to tire of repeats on TV.
Factor 3: ‘Techno-Angst’ - an anxious or cautious approach towards using technology. A sense of low self-confidence or low perceived self-efficacy in the use of hi-tech products rather than technology rejection.
Section 3. Attitudes Towards Interactive and Digital Television This section comprised 34 statements relating to interactive and digital TV. Items included those that explored motivations for adopting dTV, perceived ease of use, and interest in and relevance of (interactive and) dTV to respondents’ lives. All items were entered into a PAF with listwise deletion for cases with missing values. The data were suitable for PAF.
Factor 4: ‘Traditionalism’ - a reactionary traditionalist attitude and approach towards the use of hi-tech products; a preference for ‘tried and tested’ manual approaches. Section 2. Attitudes Towards Media Consumption The 60 items of this section were entered into PAF, again using listwise deletion for cases with missing values. Data were deemed suitable for PAF based on the criteria described in the last section. The criterion of ‘eigenvalue greater than 1’ suggested a 16 factor solution for the data-set. However, inspection of the Scree plot suggested fewer factors. A nine factor solution gave factors that were conceptually coherent.
The well-known criterion of ‘eigenvalue greater than 1’ suggested a six factor solution for the dataset. However, inspection of the Scree plot suggested four factors. A four factor solution gave factors that were conceptually coherent. The four factors accounted for 38.9% of the variance in scores. They were then subjected to Varimax rotation.
Some items were not well represented in the nine factor solution. This was reflected in low communality estimates (