cyclic voltammetry (CV) method by using an electro- ... CV curves of NiO electrodes at different scan ... mance with a high specific capacitance of 246 F/g after.
Vol.
125
(2014)
No. 2
ACTA PHYSICA POLONICA A
Proceedings of the 3rd International Congress APMAS2013, April 24�28, 2013, Antalya, Turkey
The Fabrication of NiO Microtubes Using Bacillus subtilis Bacteria a
b
a
b
F.E. Atalay , D. Asma , E. Aydogmus , H. Turanci a b
a
and H. Kaya
Inonu University, Science and Art Faculty, Department of Physics, Malatya 44280, Turkey Inonu University, Science and Art Faculty, Department of Biology, Malatya 44280, Turkey
The nickel oxide microtubes with high surface-to-volume ratio have been achieved using the Bacillus subtilis bacteria. Surface properties of the metal-oxide nanostructured materials were investigated by electron microscopy. The surface area of that was also studied by the Brunauer�Emmett�Teller analysis method. The materials were used at the construction of supercapacitor as an electrode active material. DOI: 10.12693/APhysPolA.125.235 PACS: 81.07.−b, 82.47.Uv, 88.80.fh 1. Introduction
Today, the most of the energy are obtained from coal, oil, natural gas, and nuclear energy. Recently, the fear of extinction of these sources has led to the search for new energy sources. The search for new sources of energy, inherent in the world of solar energy, wind energy, and geothermal energy are among those considered in the �rst place. However, such energies are not common and cheap. To store electrical energy using capacitors has been studied intensively in the last thirty years [1�6]. Depending on the development of technology, the desired electrode materials contain generally nanoparticles with high surface area and high energy density. In addition, other important features for supercapacitors is long life, low cost, and stability. In this project, we produced NiO nanostructured electrode materials by using the most common life forms known in nature as bacteria. The highest speci�c capacitance, 343 F/g, was observed at constant current� discharge with a current 0.35 mA/g in 6 M KOH. 2. Experimental
Gram positive bacterium, Bacillus subtilis (ATCC 6633) cells were incubated at 37 ◦C and 200 rpm for overnight in a shaking incubator at liquid medium of the nutrient broth. When the optical density of the culture reached 0.3�0.6 value, it was transferred into 250 ml �asks containing 50 ml nutrient broth. Cultures were agitated on rotary shaker at 200 rpm for 5 h, then subculturing was obtained. The bacterial cultures were centrifuged at 9000 rpm for 10 min at 4 ◦C. The cultures were resuspended in distilled water to adjust the optical density (OD 600 nm) to approximately 2.0. Later 200 ml of 250 mM NiCl2 solution was added to cultures at 10 ml/min by using burette. The mixture was continuously stirred at 800 rpm at room temperature. After the mixture was stirred 30 min, 100 ml of 25 mM NH4 OH solution was also added to mixture at 10 ml/min. All solutions were prepared by dissolving reagent-grade chemicals in deionised water. The NH4 OH was used as reducing agent. The result mixture was continuously stirred at
800 rpm for 36 h. This was followed by centrifugating and collecting of precipitate. Ni(OH)2 /bacteria precipitate was washed thoroughly with deionized water twice and then ethanol. Later, the formed Ni(OH)2 tubes precipitate dried for 24 h in an oven at 60 ◦C. It was heated from room temperature to 360 ◦C in air at a rate of 1 ◦C/min and maintained for 12 h. This was followed by cooling to room temperature at a rate of 10 ◦C/min. Later the Ni foam was degreased with acetone, etched with 3 M HCl for 10 min, and washed thoroughly with deionized water and acetone, again deionized water. Subsequently, the nanostructured NiO microtubes (75%), acetylene black (20%) and PTFE (5%) were grinded and mixed in a Zr2 O3 mortar for 30 min. 4.7 mg of this mixed material was placed on Ni foam sheet and compressed at a pressure of 10 MPa for 10 min. Ni foam was used as the current collector. The �nally obtained material was used as a cathode, with an exposed area of approximately 1 cm2 for the capacitance measurement. A three-electrode cell was used for the electrochemical experiments. The volume of the electrochemical bath was approximately 60 ml. An Ag/AgCl ceramic electrode (with ceramic frit, ALS, saturated KCl, and −45 mV versus SCE at 25 ◦C) was used as the reference electrode. A platinum electrode approximately 1 cm2 was used as an auxiliary electrode. The used electrolyte was 6 M KOH. Optical density of bacterial cultures was measured by UV-visible spectrophotometer (SHIMADZU, UV-1601). Capacitive properties of this bio-based supercapacitor was investigated by electrochemical impedance spectroscopy (EIS), galvanostatic charge�discharge tests and cyclic voltammetry (CV) method by using an electrochemical analyzer system, namely an Iviumstat potentiostat/galvanostat. The frequency limits were typically set between 10 mHz and 100 kHz. The AC oscillation amplitude was 5 mV. Surface properties of the NiO microtubes were investigated by scanning electron microscopy (SEM; JEOL JSEM 7001F). The surface area of that was also studied by the Brunauer�Emmett�Teller (BET) analysis method by Micromeritics TriStar 3000 (V3.01) system R (DFT Plus◦ V2.02).
(235)
236
F.E. Atalay et al.
3. Results and discussion
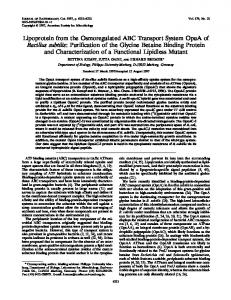
Figure 1 shows the SEM images of obtained NiO structures. SEM image of single microtube is shown in Fig. 1b. It can be seen in the �gures that the microtubes have a diameter of 1 µm and length 5�6 µm. Also the external surface of microtubes have porous and nano�ake structure (inset of Fig. 1b).
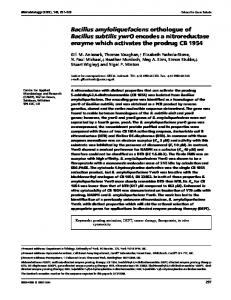
electrochemical capacitance of the NiO samples mainly results from the pseudocapacitance, which is based on redox mechanism. The area under curves increases with the potential scan rate. It is found that the increases in the CV currents are linearly proportional to the increase in the scan rate, re�ecting fast electrochemical reaction process of the nanostructured NiO electrode. The inset in Fig. 3 shows the e�ect of scan rate on the cathodic peak currents obtained from CV. The charge-storage mechanism of NiO is not through a surface redox reaction at the interface but a di�usion controlled reaction [5, 6].
Fig. 1. SEM images of nanostructured NiO microtubes.
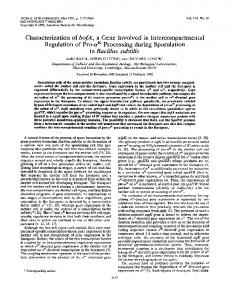
The speci�c surface area of the annealed nanostructured NiO microtubes was characterized using nitrogen gas sorption. Figure 2 shows the nitrogen adsorption isotherms of the annealed sample. The measured BET surface area of sample is ca. 49 m2 /g. The inset in Fig. 2 shows the pore size distribution plots calculated using the Barrett�Joyner�Halenda equation from the adsorption branch of the isotherms. The nitrogen adsorption isotherms and pore size distribution measurement indicate that the sample have porous structure mainly composed of mesopores with the average pore diameter around 25 nm.
Fig. 2. Nitrogen adsorption isotherm of nanostructured NiO microtubes. Inset shows the pore size distribution of NiO nanostructures.
Figure 3 shows the CV curves measured for nanostructured NiO electrode at di�erent scan rates. CV curves for PTFE and acetylene black electrode surface and Ni foam electrode surface at 10 mV/s show that the redox signal did not occur. The CV curves also indicate that the
Fig. 3. CV curves of NiO electrodes at di�erent scan rates. The inset shows cathodic peak current as a function of the square root of the scan rate.
The long term galvanostatic cycling stability of NiO electrode was investigated over 750 cycles as shown in Fig. 4. The inset of Fig. 4 shows ten charge and discharge curves of NiO electrode at 0.35 mA over the operating potential range 0�0.38 V (vs. Ag/AgCl). The discharge speci�c capacitance in the �rst cycle was 343 F/g. The capacitance of NiO electrode decreased gradually during the �rst 400 cycles and then reached the approximately stable value of 343 F/g. Voltammetric and galvanostatic results indicate that the porous structure of the NiO microtubes play is mainly responsible for obtaining optimum capacitance values. It exhibits good performance with a high speci�c capacitance of 246 F/g after 750 charge/discharge cycles, corresponding to retention of 74% of the maximum capacitance. Figure 5 presents the impedance spectra of NiO electrode at open circuit potential. These impedance plots were measured after 5 or 750 continuous charge and discharge cycles. As shown in Fig. 5, typical linear behavior at the low frequency range of electrochemical capacitors was observed in the Nyquist plot, where the slope gradually changes from 55◦ to 67◦ with the increase of cycles. The phase angle for the impedance plot of the NiO electrode was observed to be higher than 45◦ in the low frequencies, suggesting that the electrochemical capaci-
237
The Fabrication of NiO Microtubes . . .
tive behavior of the NiO nanostructured electrode is not controlled by di�usion process [6]. 4. Conclusion
In summary, bio-template based approach for generating NiO microtubes with nanoporosity has been described. Electrochemical data demonstrated that the porous nanostructured NiO electrodes could deliver a maximum speci�c capacitance of 343 F/g at current density 0.35 F/g. The Coulombic e�ciency remains above 74% within 750 cycles. These good electrochemical capacitive properties coupled with the low cost of the bio-template based approach may o�er the new possibilities for supercapacitor electrode design. Acknowledgments
Fig. 4. The variation of speci�c capacitance as a function of cycle number of NiO electrode. The inset shows the ten cyclic charge�discharge curves.
This work was supported by Inonu University with project number I.U.A.F- 2013/78. References
[1] B.E. Conway, Electrochemical Supercapacitors: Scienti�c Fundamentals and Technological Applications, Kluwer Academic/Plenum Pub., New York 1999. [2] X. Zhao, B.M. Sanchez, P.J. Dobson, P.S. Grant, Nanoscale 3, 839 (2011). [3] M. Jayalakshmi, K. Balasubramanian, Int. J. Electrochem. Sci. 3, 1196 (2008). [4] H.-W. Shim, Y.-H. Jin, S.-D. Seo, S.H. Lee, D.-W. Kim, ACS Nano 5, 443 (2011). [5] V. Yagmur, F.E. Atalay, H. Kaya, D. Avcu, E. Aydogmus, Acta Phys. Pol. A 123, 215 (2013). [6] J. Xu, L. Gao, J. Cao, W. Wang, Z. Chen, Electrochim. Acta 56, 732 (2010).
Fig. 5. Nyquist plots of NiO electrode at open circuit potential in 6 M KOH solution.