[11] W. Dickinson, D. Leon, and A. Podgurski. Finding fail- ... [20] D. Leon, A. Podgurski, and W. Dickinson. ... [38] C. Warrender, S. Forrest, and B. Pearlmutter.
Using Behavioral Profiles to Detect Software Flaws in Network Servers∗ João Antunes
Nuno Ferreira Neves
LaSIGE, University of Lisboa, Faculty of Sciences – Portugal {jantunes,nuno}@di.fc.ul.pt
Abstract
checking modules, normally written as scripts, is responsible for verifying if known flaws are present. More recently, some of these scanners have evolved to test for unknown bugs by employing methods based on fuzzing [1,30]. Fuzzing started as a technique for robustness testing by providing random input to command line applications [22]. Through the years, fuzzers have evolved to understand better the interface of the components, allowing the generation of more effective tests, and therefore being able to find many of the publicly reported vulnerabilities [32, 33]. One of the limitations of these tools, however, is that they focus mainly on the creation and execution of tests, usually providing limited support for the actual detection of flaws. Therefore, unless the test provokes a very visible effect on the target (e.g., a crash), the vulnerability can remain undisclosed. The testing team can also look for other hints of problems, but this is usually a tedious process and can require, for instance, the manual inspection of many log entries (e.g., look for a strange server response in a 100k line log file). Furthermore, several classes of security vulnerabilities tend to be quite elusive, since the effects of these faults are not immediately perceived nor have a direct impact on the server’s execution (e.g., a resource exhaustion or a code injection). In this paper, we present a methodology that can complement existing solutions for the discovery of vulnerabilities (e.g., fuzzers and scanners). The aim of the methodology is to find deviations from the expected server’s behavior, since they can give a strong indication that a flaw was activated while running a test case. Therefore, during a learning phase, we collect an extensive amount of information about the server’s correct execution, which includes both how the server responds to the clients and how the server uses the operating system and its resources (e.g., the system calls that are executed or the consumed memory). This information is used to build a profile of the server’s behavior that combines a model of the implemented protocol with local monitoring data. This extended specification is used in a testing phase to automatically detected if the server’s behavior deviates from the profile while processing the test cases (e.g., created by a fuzzer tool). Failing test cases with information about the expected and observed behaviors are provided to the developers, so that they can further investigate and correct the flaw.
Some software faults, namely security vulnerabilities, tend to elude conventional testing methods. Since the effects of these faults may not be immediately perceived nor have a direct impact on the server’s execution (e.g., a crash), they can remain hidden even if exercised by the test cases. Our detection approach consists in inferring a behavioral profile of a network server that models its correct execution by combining information about the implemented state machine protocol and the server’s internal execution. Flaws are automatically detected if the server’s behavior deviates from the profile while processing the test cases. This approach was implemented in a tool, which was used to analyze several FTP vulnerabilities, showing that it can effectively find various kinds of flaws.
1. Introduction Network servers play an important role on the organization of distributed systems and applications. Clients communicate with servers using protocols that define the correct format and order in which messages should be exchanged. Some of the most commonly used protocols were standardized by the Internet Engineering Task Force (IETF) and they cover areas such as computer bootstrap in a networked environment [12], distributed name resolution [23] or remote email access [24]. Due to the important roles that servers play in the networks, and since they often face the Internet, they are usually interesting targets of attack. Therefore, vulnerabilities found in these servers are highly coveted by hackers and potentially valuable items in underground marketplaces [15, 16]. Over the years, several techniques have been proposed for the discovery of flaws in network servers. For example, scanners aim at automating the task of identifying the presence of known vulnerabilities [9,14,26,28]. A set of vulnerability ∗ This work was partially supported by EC through project FP7-257475 (MASSIF) and by FCT through the Multi-annual and CMU-Portugal Programmes and the project PTDC/EIA-EIA/100894/2008 (DIVERSE).
1
USER .*/3.*
To evaluate the approach, we have implemented the methodology in a tool and used it to detect vulnerabilities in FTP servers [25]. We have looked at all publicly available descriptions of FTP vulnerabilities over the past 12 years (a total of 122) and organized them into nine different classes. Then, we selected some of these vulnerabilities whose fault pattern is representative of the different classes of vulnerabilities and devised five different experiments. Since the vulnerabilities occurred in different server applications, it was necessary to create several testbeds. The experiments show that an accurate behavioral profile can be an interesting solution for the automatic detection of vulnerabilities. Depending on the class of vulnerability different sources of data were more insightful in the detection, suggesting that there are gains in employing a holistic approach to build the profiles.
-/2.*
S1
S0
S2
PASS .*/5.* PASS .*/2.*
CWD .*/2.*|CWD .*/5.*|CDUP .*/2.*|CDUP .*/5.*| RMD .*/2.*|RMD .*/5.*|MKD .*/2.*|MKD .*/5.*| PWD/2.*|PWD/5.*|LIST .*/1.*|LIST .*/5.*| STOR.*/1.*|STOR.*/5.*|RETR .*/1.*|RETR .*/5.*| PORT [0-9,]+/2.*|PORT [0-9,]+/5.*| PASV/2.*|PASV/5.* RNFR .*/3.*
S4
S3 QUIT/2.*
RNTO .*/2.*|RNTO .*/5.*
S5
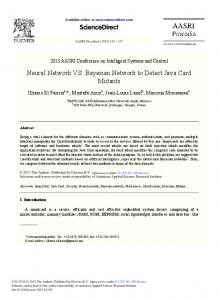
Figure 1. Subset of the FTP specification. USER .*/3.*/m2 -/2.*/m1
We use finite-state machines (FSM) to model protocol S1 S0 S2 PASS .*/5.*/m3 specifications because they are a useful mathematical rep4 resentation to describe the languagePASS of .*/2.*/m the protocol (i.e., theCWD format of5|CWD the.*/5.*/m accepted messages) and its state machine .*/2.*/m 6|CDUP .*/2.*/m7|CDUP .*/5.*/m8| RMD .*/2.*/m .*/5.*/m12| Usually, it is 9|RMD 10|MKD .*/2.*/m 11|MKD (i.e., the rules for.*/5.*/m exchanging those messages). PWD/2.*/m13|PWD/5.*/m14|LIST .*/1.*/m15|LIST .*/5.*/m16| advisable to define separate language automata STOR.*/1.*/m17|STOR.*/5.*/m18|RETR .*/1.*/m19|RETR .*/5.*/m20| for each enPORT [0-9,]+/2.*/m [0-9,]+/5.*/m 22| and the server language, tity, for example the21|PORT client language PASV/2.*/m23|PASV/5.*/m24 which may or may not overlap. The specification should also address the relations among theS3 different types of messages, RNFR .*/3.*/m 25 QUIT/2.*/m28 both from the same entity (e.g., a client must send the username message before sending a password message) and beS4 S5 RNTO .*/2.*/m26|RNTO .*/5.*/m27 tween the two entities (e.g., if the username message is correct, the server returns a message asking for the password). Mealy machines are regular FSM that can model the interactions between the two protocol entities—they define both a transition function (i.e., give the next state for a given state and input) and an output function (i.e., the output for a given state and input). Hence, we model the specification of the protocol as a Mealy machine, where each transition is defined by the client message (input), the server response message (output), and the following state. More formally, the Mealy machine (S, I, O, ft , fo , s0 , F ) is defined as: S is a finite, non-empty set of states, I is the input alphabet (finite set of requests), O is the output alphabet (finite set of responses), ft is the transition function: ft : S × I → S, fo is the output function: fo : S × I → O, s0 is the initial state, and F is the set of final states.
2. Methodology This section presents a methodology for automatic detection of vulnerabilities in target servers. The methodology consists of two phases: the Learning phase is responsible for deriving a specification of the communication protocol used to exchange messages between the server and clients. The specification is complemented with detailed operational data about the server, obtained by monitoring the execution while it processes regular requests from the clients. This extended specification is then used in the Testing phase to discover abnormal behavior while the server executes a battery of test cases (generated, for instance, by a fuzzer). A deviation from the expected behavior provides a strong indication about which test cases where effective at triggering faults, which can then be further investigated by the developers to correct them.
2.1. Extended specification In our methodology for vulnerability detection, we want to automatically obtain a rich set of information about the server’s execution, so that it can later be employed to provide evidence about incorrect behavior. Since we want to treat the server as a black box1 , thus avoiding dependencies on programming languages and runtime environments, the data that can be externally collected is: 1) the way the server interacts through the network (for example, in response to malicious requests); and 2) how the server relates to the local environment (namely, how it uses the resources offered by the operating system). Therefore, in our approach, we combine both sources of information by capturing the server message exchanges in a protocol specification, which is complemented with monitoring data.
Figure 1 shows an example of a Mealy machine that models a subset of the FTP protocol (taken from RFC 959 [25]). This automaton identifies the states and the input and output symbols (messages) for each transition (labeled as regular expressions in the form of input/output). The protocol has an initial login exchange (encompassing states S0 , S1 , and S2 ), states where the client can issue many different types
1 The reader, however, should notice that our approach can be easily extended if white box monitoring data is available, by incorporating it in our model as an extra data source.
2
Benign Test Cases Benign Test Cases
of commands to access the remote file system (states S3 and S4 ), and a final state (S5 ). Server replies start with a numeric code: “2” means a positive completion reply, “3” a positive intermediate reply, and “5” a permanent negative reply. For instance, after the server’s welcome banner in state S0 (labeled as “2.*”, a regular expression that recognizes messages similar to “220 Welcome to FTP server.”), the client must transmit its credentials. First, the client sends the username (e.g., “USER john” that is labeled as “USER .*”) and then the respective password (labeled as “PASS .*”). If the password is correct, the server responds with a positive completion reply (labeled as “2.*”) and the protocol goes to state S3 . If the password is incorrect, the server responds with a permanent negative reply (labeled as “5.*”) and the client must restart the login process. Automata, such as Mealy machines, are well suited representations for the expected external behavior of protocol implementations, such as the messages exchanged between the clients and the server, and for that reason they have been used in testing [3,7,17,19]. While an analysis based on these models may be sufficient to detect some types of anomalies (e.g., wrong message or lack of response), there are many other types of vulnerabilities that are difficult to address with this information alone. In fact, more elusive classes of flaws can trigger faults that either remain dormant or imperceptible, not immediately affecting the server’s compliance with the protocol specification (e.g., an attacker exploits a command injection flaw to force the server to execute some local program). To support the detection of a larger range of vulnerabilities, we propose to extend the Mealy machine with information about the server’s local execution. We call this extended Mealy machine the Behavioral Profile of the server and it is defined as the tuple (S, I, O, M, ft , fo , fm , s0 , F ), where:
I
I Behavioral Profile Behavioral Constructor Profile Constructor
I O
Server App.
O M
Test Case Executor Test Case
O S
M
Executor
S M
Server App. Monitor
I O
Monitor O.S.
M I/O/M
O.S.
I/O/M
Behavioral Profile Behavioral Profile
(a) Learning phase. Behavioral Profile
Test Cases
I/O/M Behavioral Profile
Test Cases
I/O/M
Manual Testing, …) I
I Behavioral Profile Behavioral Checker Profile
I O O M
(Attack Injection Tool, Fuzzer, Vuln. Scanner, (Attack Injection Tool, ManualVuln. Testing, …) Fuzzer, Scanner,
Test Case Executor Test Case
I O
Server App.
O S
Executor
S M
Server App. Monitor
M Checker Output violations Transition violations Output violations Monitoringviolations violations Transition
Monitor O.S.
M
O.S.
Monitoring (b)violations Testing phase. Input
Server Application
Input Main process + Figure 2. Output Architecture Server andApplication methodology to children and threads Main process + Output test a target server. Synchronize children and threads Synchronize Monitoring
Process Control Process Sync Open Files and Network Control Sockets Usage Open Files and Network Sockets Usage Sync
Syscalls Tracing Syscalls Memory Tracing Usage Memory Usage
Time Tracking Time Disk Tracking Usage Disk Monitor Usage
machine can Monitoring provide a more complete and accurate model of the server’s behavior, which can then be explored Monitorduring a Operating System testing phase to detect flaws. Operating System
2.2. Learning phase
M is the monitoring alphabet (finite set of monitoring data), and
The first phase of the methodology is the Learning phase, which is responsible for obtaining the Behavioral Profile of the server. As input to this phase, we need a set of Benign Test Cases that corresponds to sequences of interactions between the clients and the target server. Currently, they can be provided in two ways. Functional test cases, created by the developers to test the correct implementation of the server, can be used as benign test cases since they do not fail (i.e., they do not trigger any abnormal server’s behavior). Or, the simplest method (that we typically use), which is based on network traces where the messages of the clients can be extracted and replayed to the server. In both cases, however, these tests should exercise the whole protocol specification (or the part of the specification that is going to be analyzed in the testing phase2 ) and thus they should cause positive and negative responses from the server (e.g., login with correct
fm is the monitoring function: fm : S × I → M . This automaton is obtained by monitoring the server’s execution while it progresses through the various states (as defined in the original Mealy machine of Figure 1). Hence, besides the input and output symbols, we also associate to each transition the respective monitoring information (mi ). mi corresponds to a tuple (source1 , . . . , sourcen ), where each sourcei captures one of the dimensions of the server’s internal execution as it interacts with the underlying OS and hardware (e.g., the range of memory consumption or the execution of specific OS calls). This additional information can thus provide valuable insight to the discovery of vulnerabilities. Vulnerabilities that do not affect the server’s external messages, will nevertheless affect the server’s local execution [20]. Thus, depending on the type of monitoring information that is obtained (e.g., system calls, signals, CPU, open files), the extended Mealy
2 Naturally, any test case used later in the testing phase that exercises some missing part of the specification, cannot be automatically evaluated.
3
and wrong credentials). Figure 2a shows the main components involved in the learning phase. The Test Case Executor component is responsible for processing each test case and for synchronizing with the Monitor component. Before each test case is started, the Test Case Executor instructs the Monitor to setup the testing environment, such as putting the server into a predefined initial state (launch a new instance of the server, discarding any changes that were previously made) and prepare the monitoring tasks. Then, once the server is running and waiting for new requests, the Test Case Executor starts emulating a client by sending request messages to the server and storing the corresponding responses. In addition, at each response received from the server, the Test Case Executor asks for new monitoring data. The Monitor then sends all information it has gathered since the last monitoring request. Therefore, the monitoring data depicts the server’s progress and provides a snapshot of its current internal state (in a later section we provide more details about our monitoring implementation). Next, the Test Case Executor provides the input, output, and monitoring data of each test case to the Behavioral Profile Constructor component. This component uses the input and output to reverse engineer an approximate protocol specification [4] and adds the monitoring data to the respective transitions in the form: fm (sj , ik ) = ml with sj ∈ S, ik ∈ I, and ml ∈ M . If the server replies with more than one message to a request (because the response was split into multiple packets), the response messages are all concatenated as a single output symbol. Additionally, there should also be multiple instances of monitoring data for the same transition (typically, one after each split response), which are also combined into a single monitoring instance. In the existing implementation, the Behavior Profile Constructor uses two strategies for combining different instances of monitoring data. For resource usage, it just keeps track of the maximum observed values (e.g., maximum time, last count of CPU cycles, largest memory consumption, total disk utilization, total number of open files), or if the monitor tracks sequences of operations (such as instructions, system calls, or signals) they are concatenated since they belong to the same protocol transition. At the end of this phase, the Behavioral Profile Constructor produces the Behavioral Profile of the server, i.e., a Mealy machine modeling the server’s protocol execution with the additional monitoring data.
should mainly evaluate the server’s robustness when confronted with unexpected and/or malicious input in the form of malformed sequences of messages or messages containing exploit data for known vulnerabilities. These test cases can be generated by tools specialized at finding vulnerabilities, such as Fuzzers or Scanners [3, 10, 26], and they can also be complemented with manually designed tests. The Test Case Executor carries out each test case like in the previous phase, collecting the input, output, and the respective monitoring data. A synchronization with the Monitor guarantees that each test case starts executing in the same initial state. A special evaluator component, the Behavioral Profile Checker, analyzes the server’s behavior by looking at the current state of the protocol, the input and output messages, and at the respective execution data. If the server’s response is not in accordance with the Behavioral Profile, the evaluator found an output or transition violation. An output violation is characterized by having the server in the correct/expected state producing an erroneous response (e.g., provides an incorrect code). A transition violation occurs when the server moves to a state distinct than the anticipated, due to a flaw that was activated while processing a request. A transition violation can also cause the server to send erroneous responses, possibly because the problem was in a previous transition that made the server jump to the wrong state. In order to distinguish from the output violation, we employ the following approach: if the server response is not in accordance with any of the responses/output recognized in the same state, we consider that the server is in the wrong state, and thus it has a transition violation for that test case; otherwise it is an output violation. Conversely, if the server’s response is in accordance with the expected output, the evaluator checks the server’s local execution. Depending on the type of information provided by the monitor, the evaluator can verify if the resources used by the server have exceeded the expected values for that transition, or even compare the sequence of operations (e.g., system calls). If the server’s local execution deviates from the expected, the evaluator has found a monitoring violation. Besides the type of violation that was detected and the respective test case, this approach also provides valuable information to identify the source of the flaw. By looking at the protocol request (input) that triggered the faulty behavior, the server’s response (output), utilized resources, and signals or system calls (monitoring), one can better ascertain the type of the vulnerability and its location (e.g., a misconfiguration or a programming bug).
2.3. Testing phase
3. Implementation The test cases used in this phase are also designed to command the server to performing various tasks, while covering as much of the protocol space as possible (or they can be focused on a subset of the server’s functionality). However, besides exercising the normal server operations, they
We developed a tool that implements both phases of our methodology (see Figure 2). All components, with the exception of the Monitor, were developed in Java. In this section, we provide additional details about the tool. In particu4
Profile Checker
M
Executor
S
Monitor
M Output violations Transition violations Monitoring violations Input
lar, the Behavioral Profile Constructor that uses some reverse engineering techniques to infer a Mealy machine of the protocol specification, and the Monitor and Behavioral Profile Checker that resort to monitoring data gathered through OSspecific tracing and monitoring facilities. At this moment, we are focusing our research on servers that implement text-based protocols from the IETF (e.g., IMAP, POP, FTP, DNS). This type of protocols usually resorts to requests that are composed of a predefined command name followed by one or more arguments, and by responses containing a reply code number with some textual explanation. Our implementation of the Behavioral Profile Constructor uses protocol reverse engineering techniques that have evolved from ReverX [4], with the traffic generated from the benign test cases to obtain an approximate protocol specification3 . First, it builds two FSM to recognize the requests and responses transmitted to and from the server. Then, each state of these automata is analyzed to identify transitions that should be generalized in order to make the FSM accept the same types of messages with different values (namely to create regular expressions that express the command names and the argument fields). Command fields are distinguished from parameter fields if the ratio of the number of symbols at a state over the total frequency of that state is below a certain threshold. This results in two language FSM that express the message formats recognized by the server and the clients, respectively—a message format is a path in a FSM that corresponds to a sequence of message fields. The Behavioral Profile Constructor starts by inferring the protocol state machine by creating another automaton that accepts valid sequences of message formats (e.g., a login message, followed by a password message and a quit message). First, it takes the messages exchanged in each test case and converts them into the corresponding message formats (obtained from both language FSM). Next, a Mealy machine is created to accept every sequence of input and output message formats (i.e., tuples of requests and responses) is accepted. While performing this activity, monitoring data is obtained from the Monitor component and associated with the corresponding transitions. To later compare different instances of monitoring data, we resort to a resumed representation that maintains the maximum values of each resource utilization, the set of unique system calls and signals, and the sequence of system calls (in Section 4, we provide specific examples). The Behavioral Profile is obtained by extending each transition of the Mealy machine, which models the input and output of the protocol specification, with the respective monitoring data. In the testing phase, the Behavioral Profile Checker is able to detect abnormal behavior by analyzing the requests, responses, and monitoring data of the execution of the test
O.S.
Server Application
Output Synchronize Monitoring
Main process + children and threads Process Control
Syscalls Tracing
Time Tracking
Open Files and Network Sockets Usage
Memory Usage
Disk Usage
Sync
Monitor Operating System
Figure 3. Monitoring component. cases. It uses each input/output to follow the server’s execution of the protocol (Mealy machine) and to identify the current state and the relevant transition. Then, it compares the server’s current behavior with the one defined in the Behavioral Profile. The scope, accuracy, and thoroughness of the monitor determines the ability to detect deviations from the correct behavior. A more capable monitor can provide a more complete view of the server’s execution, which can be crucial to detect some classes of vulnerabilities. A memory leak, for instance, may only be detected if the monitor is able to obtain memory usage data. On the other hand, a detailed monitor may impose harder implementation and operational requirements (e.g., it needs low level OS information or a patched kernel) and may even cause some perturbation on the server that can affect the server’s execution (e.g., intrusive probing, increased system overhead). For instance, to access some low-level monitoring facilities, such as tracing the execution of processes, our Monitor component was developed in C++ for Unix-based platforms to make use of the monitoring facilities provided by that kind of OS. These tracing capabilities are achieved with the PTRACE4 family functions by catching any signals and system calls received and sent by the server process and any of its children/threads. System calls are interesting operations to monitor because they are requests made to the OS for services not available to user level processes, e.g., allocate memory, write to disk, or send a message to the network. The sequence (or more simply the set) of system calls also provides a pattern of the execution of the server for a given task [38]. If the server executes a set of instructions distinct from the expected, this could reveal for instance that the flow of control is being hijacked. Besides system calls, UNIX signals are also intercepted. A signal interrupts the process execution to indicate that a special condition, such as an error, was triggered. For example, a SIGSEGV signal indicates that a memory access violation has occurred, which may occur due to a integer overflow/underflow used in an allocation of memory. In addition, the Monitor also observes the resource usage of the server process and its children/threads by resort-
3 This approach is impervious to the existence of other types of traffic, since our tool selects only messages to and from the server’s predefined network port number.
4 http://www.kernel.org/doc/man-pages/online/pages/man2/ptrace.2.html
5
each type of vulnerability (forth column in Table 1) and devised a set of experiments covering the respective faulty behaviors (last column), such as the execution of a different set of instructions, an increase in some resource utilization, or an incorrect server response. For instance, vulnerabilities of buffer overflow, format string, SQL injection, or external application execution, force the server into inadvertently change its control flow of execution, making it execute code that was not intended by the developers. Unusual resource consumption is a clear faulty characteristic of resource exhaustion vulnerabilities and also of denial of service flaws (cpu/time is also a resource). Directory traversal and information disclosure vulnerabilities can be characterized by the server’s behavior in granting illegal access to some private resources. This behavior is depicted in the server’s output by responding positively when it should be denying access. The same faulty behavior is observed in misconfiguration issues, such as the existence of default accounts. We then created a series of experiments based on specific security flaws that are representative of the faulty patterns of the different classes of vulnerabilities:
Table 1. Reported known FTP vulnerabilities. Vulnerability
Bugtraq
113, 269, 599, 612, 679, 726, 747, 818, 961, 966, 1227, 1638, 1675, 1690, 1858, 2120, 2124, 2242, 2242, 2342, 2496, 2548, 2550, 2552, 2782, 3507, 3581, 3884, 4482, 5427, 7251, 7278, 7307, Buffer overflow 8315, 8668, 8679, 8893, 9483, 9675, 9767, 9953, 10078, 10834, 11069, 11508, 11589, 11645, 11772, 12139, 12155, 12463, 12487, 12632, 12704, 12755, 13454, 14077, 14138, 14339 1387, 1425, 1560, 2296, 6781, Format string 7776, 9800, 14380, 14381, 14381
SQL injection External app. execution Resource exhaustion Denial of service Directory traversal
CVE
Main faulty Experpattern iment
CVE-1999-0911, CVE-1999-1058, CVE-2001-0247, CVE-2001-0248, CVE-2001-0325, CVE-2001-0550, CVE-2003-0466, CVE-2003-0831, CVE-2004-0185, CVE-2004-0340, executes a CVE-2004-2111, CVE-2004-2111, different set CVE-2004-2533 1, 3, 4
of instructions
CVE-2000-0573, CVE-2000-0574, CVE-2005-2390, CVE-2005-2390
7974, 34288 2240, 2241 CVE-2003-0853, CVE-2003-0854, CVE-2004-0341 resource 217, 859, 1456, 1506, 1677, 3409, CVE-1999-0838, CVE-2000-0644, 6297, 6341, 7425, 7473, 7474, CVE-2000-0645, CVE-2000-0647, consumption 7900, 9573, 9585, 9627, 9651, CVE-2000-0648, CVE-2001-1156, increases 9657, 9668, 9980, 11065, 12384, CVE-2004-0252, CVE-2004-0342, 12790, 12865, 13054, 17398 CVE-2005-0779, CVE-2005-1034 301, 2444, 2489, 2618, 2655, 2786, 2789, 5168, 6648, 7472, 7718, CVE-2002-0558, CVE-2004-0148 9832, 11159, 12586, 13292, 16321 output 271, 2698, 8875, 14382
Information 1016, 1452, 2564, 3331, 3333, CVE-2000-0176, CVE-2000-0646 7825, 11430, 13479, 14124, 14653 disclosure Default account 7359, 5200, 20721
differs
3, 4
2, 5
• Experiment 1 - buffer overflow: a test case that triggers this vulnerability should either cause a memory access exception (e.g., SIGSEGV signal) or the execution of a different set of instructions;
ing to the LibGTop5 library functions. Given the performance impact of such calls, the monitor only probes for resource utilization at the relevant system calls (e.g., opening/closing files or allocating/deallocating memory). The Monitor tracks the following information regarding the resources: total number of processes, including forked children and threads of the target server; memory pages, given by the number of pages in the resident set minus the shared pages; files and network sockets, by analyzing open file descriptors; disk usage, specified by the number of bytes written to any of the file descriptors belonging to file disks; and execution time, which corresponds to the wall time taken by the server since the protocol request.
• Experiment 2 - directory traversal: this vulnerability can be detected by looking at the server’s output (e.g., if it grants access when it should deny it); • Experiment 3 - SQL injection: this kind of vulnerabilities usually cause the server to execute more instructions, such as additional SQL queries, and consequently, to consume more resources, even though the server may still respond in accordance; • Experiment 4 - illegal program execution: executing an external program will cause the server to fork its execution: the main process will continue to handle the protocol requests, while a child process carries out additional instructions;
4. Evaluation This section presents the results of the experimental evaluation of our methodology to detect different classes of security vulnerabilities. For this purpose, we exhaustively searched the Internet for known FTP vulnerabilities in specialized websites like SecurityFocus (Bugtraq) and Common Vulnerabilities and Exposures (CVE), and we found a total of 122 reported flaws, including traditionally elusive faults that do not affect the external behavior of the server. The vulnerabilities were grouped in the following classes: buffer overflow, format string, SQL injection, external application execution, resource exhaustion, denial of service, directory traversal, information disclosure, and default account vulnerabilities (see Table 1). Furthermore, we analyzed the typical fault patterns of 5 http://ftp.gnome.org/-
• Experiment 5 - default account: configuration vulnerabilities, such as accessible default accounts, typically permit some illegitimate protocol transition that may lead the server to reply and/or execute in some unexpected way.
4.1. Testbeds The experiments were devised to activate various security flaws, present in different FTP servers and configurations, that trigger distinct types of faulty behavior. Three of the five experiments are based on specific vulnerability reports, while the other two are general security problems, usually due to misconfiguration issues, and are therefore not specific
pub/GNOME/sources/libgtop/
6
to a particular server implementation. To replicate the environment conditions described in the vulnerability reports, we created five distinct virtual machine (VM) images (with Oracle’s VirtualBox virtualization product). Whenever stated, we installed the appropriate version of the OS, including the libraries and applications, and always compiled and installed the vulnerable version of server from source. In addition, we installed our monitor component and the required libraries in each VM. In the first and second experiment, we installed proftpd version 1.2pre1 (taken from the CVS repository) in two Ubuntu 10.10 VM images. The third experiment was also related with a vulnerability in proftpd server, however it also required the use of a database—as described in the vulnerability report, we configured the VM with Debian 5.0 and MySQL 5.0. The forth experiment was related to a vulnerability present in wu-ftpd, which we installed from the source files obtained from a mirror repository that contained old versions of the server. The server was configured to enable SITE EXEC commands, whose vulnerability would allow users to execute programs from /bin directory, instead of ˜/bin. Finally, for the fifth experiment, we used the most recent build of proftpd (1.3.3) in the latest Ubuntu version (11.04) to detect the existence of default (and unwanted) accounts, such as the anonymous FTP account. The same set of benign test cases was used to automatically infer the protocol specification and the internal server’s behavior. To correctly infer the FTP specification with a good protocol coverage we used a total of 1000 messages taken from publicly available FTP traces6 . The subset of messages we selected contained the most used types of FTP requests, which exercised the server into executing a series of tasks while our tool collected the requests, responses, and monitoring data. The messages covered most of the protocol specification, including positive and negative responses (e.g., from requests with correct and incorrect parameters, such as wrong usernames or non-existent files). For the testing phase, and since we are not focused on the test case generation, we manually defined the test cases based on the proofs of concept exploits that are provided in the vulnerability reports (but test cases generated from fuzzers or scanners could also be used).
easy to detect because they often crash the server while it tries to access an illegal memory address. However, modern FTP servers usually either create a child process to handle each client and/or intercept this specific type of signals to gracefully terminate and automatically restart the execution. This effectively masquerades the fault from the clients and makes the detection unfeasible only by looking at the external behavior. However, our tool was able to detect these monitoring violations because it intercepted different set of signals from those present in the behavioral profile for that particular protocol transition—the test case that triggered the abnormal behavior caused a signal 11 (segmentation fault). Additionally, the tool also provided evidence that the server executed significantly less code (i.e., less system calls), certainly due to the premature termination of the child process that received the signal 11. Also, because the server’s lack of response is not recognized by any of the acceptable responses for that protocol state, the tool identified a transition violation (instead of a simple output violation). The second experiment is related to a directory traversal vulnerability and illustrates the necessity of looking at the execution of the protocol, i.e., at the messages exchanged. The test case that triggered this vulnerability caused the server to respond affirmatively to an access request for a directory outside the user’s scope. The server responded with a “226 Transfer complete.” when it should have denied access with a reply of the type “450 .*”, thus it is an output violation. Because the server processed the request differently, it also executed a different sequence of system calls, thus the tool also identified a monitoring violation. The following two experiments are related to vulnerabilities that cause the server to execute additional code. In the third experiment, a server vulnerable to SQL injection is lead to execute additional SQL queries. The vulnerability, present in the USER command, cannot be detected by looking at the server’s response alone because it always accepts the username parameter (whether it contains SQL statements or not). However, the expected behavior for processing a USER command is to execute 1154 system calls, as observed during the learning phase. Yet, the test case caused the server to execute 1704 system calls, i.e., an additional 550 system calls (monitoring violation). In addition, due the server’s database logging mechanisms, our tool also detected a significantly larger number of bytes written to disk. This also illustrates the ability to detect discrepancies in the utilization of resources, such as memory or disk resource exhaustion vulnerabilities. The forth experiment also aimed at causing the server to execute additional code, although through the execution of an external program. In this case, the server has a vulnerability that allows a remote user to run a program outside the user’s bin directory. The previously inferred behavior of the server for processing a SITE EXEC command with an unauthorized program path, defined three processes and the execution of 1063 system calls. However, the test case caused
4.2. Results Figure 4 shows the relevant results of the test cases that triggered vulnerabilities in each of the five experiments. For the purpose of clarity and due to space constraints, we are ignoring some of the monitoring details, such as the actual sequence of systems calls or the utilization of some resources. In the first experiment we tested a FTP server with a buffer overflow vulnerability. Normally, these vulnerabilities are 6 http://ee.lbl.gov/anonymized-traces.html
7
output # processes # unique syscalls # seq of syscalls seq of signals memory usage disk usage
"331 .*" 2 ±0 49 ± 0 1154 ±0 5,19 1180 10702
"331 Password req..." 2 49 ± 0 1704 5,19 1188 19903
Experiment 1 - buffer overflow Server: proftpd 1.2pre1 Vulnerability: buffer overflow in command MKD (bugtraq 612) Behavior Profile Test Case output "2.*" # processes 2 ±0 2 # unique syscalls 51 ± 0 40 # seq of syscalls 1639 ±3 1015 seq of signals 5,19,13 5,19,11 memory usage 250 250 disk usage 0 0
Experiment 4 - illegal program execution Server: wu-ftpd 2.6.0 Vulnerability: Illegal acess in command SITE EXEC (bugtraq 2241) Behavior Profile Test Case output "200-.*" "200-bash -c id" # processes 3 ±0 5 # unique syscalls 30 ± 0 98 # seq of syscalls 1063 ±0 1970 seq of signals 5, 5, 19, 19, 17 5,5,19,19,19,19,17,17,17 memory usage 794 1206 disk usage 0 0
Experiment 2 - directory traversal Server: proftpd 1.2pre1 Vulnerability: accessing the root contents (bugtraq 2618, 2786, 5168, and 11159) Behavior Profile Test Case output "450 .*" "226 Transfer complete." # processes 2 ±0 2 # unique syscalls 49 ± 0 49 # seq of syscalls 1087 ±10 1244 seq of signals 5,19 5,19 memory usage 250 250 disk usage 0 0
Experiment 5 - default accounts Server: proftpd 1.3.3 Vulnerability: server accepts unexpected credentials (bugtraq 5200, 7359, and 20721) Behavior Profile Test Case output "530 .*" "230 User ..." # processes 2 ±0 2 # unique syscalls 43 ± 0 47 # seq of syscalls 264 ±0 412 seq of signals 5, 19 5, 14,19 memory usage 610 1088 disk usage 1024 996
Experiment 3 - SQL injection Server: proftpd 1.3.1 Vulnerability: SQL injection in USER command (bugtraq 33722) Behavior Profile Test Case output "331 .*" "331 Password req..." # processes 2 ±0 2 # unique syscalls 49 ± 0 49 ± 0 # seq of syscalls 1154 ±0 1704 seq of signals 5,19 5,19 memory usage 1180 1188 disk usage 10702 19903
faulty behavior can only be detected if the server’s internal execution is also observed and compared, such as by looking at the number of system calls and/or the amount of used resources. There also a couple of points to note. First, as in any approach that learns the correct behavior and tries to detect any deviations as anomalies, it is susceptible to false positives. However, in the case of testing and detecting vulnerabilities it is always better to later inspect a few false positives than to miss a false negative. Second, constantly probing the server for monitoring data is cpu intensive and may result in some overhead. This overhead, however, is acceptable as it does not prevent the tests from being carried out at a good pace7 —our aim is not to test live systems.
Experiment 4 - illegal program execution
Figure Server: 4. Vulnerability detection of test cases. wu-ftpd 2.6.0 Vulnerability: Illegal acess in command SITE EXEC (bugtraq 2241) Behavior Profile Test Case " -c and id" to exthe server tooutput fork two"200-.* additional child"200-bash processes # processes 3 ±0 5 ecute# unique an additional 907 system calls and four more signals, syscalls 30 ± 0 98 thus #reflecting These adseq of syscallsthe external 1063 ±0 program execution. 1970 of signals and5,code 5, 19, 19, 17 caused 5,5,19,19,19,19,17,17,17 ditionalseqprocess also the server to allocate memory usage 794 1206 more memory than the expected. Both discrepancies indicate disk usage 0 0
5. Related Work
a monitoring violation and therefore reveal that the test case Experiment - default accounts triggered an existing fault in5 the server. Server: proftpd 1.3.3 TheVulnerability: fifth and last experiment is also related with 5200, a widely server accepts unexpected credentials (bugtraq known class of vulnerabilities. 7359, and 20721) Some servers are configured Behavior Profile Test Case by default with special accounts, such as for testing or debugoutput "530 .*" "230 User ..." ging purposes, or simply with an anonymous # processes 2 ±0 2account, which unique 0 47 may#also besyscalls considered43a ±security risk. This particular experof syscalls 264 ±0 412 iment# seq shows that besides the server’s response being diverseq of signals 5, 19 5, 14,19 gent from the expected 610 on the behavioral profile memory usage 1088 (it accepts disk usagewhen it should 1024 996server’s interthe credentials, deny them), the nal execution is also in violation (it is carrying out a different protocol transition). In fact, the correct behavior for that test case would be to send a “530 .*” type of reply and to execute 264 system calls, which is being clearly violated by the server’s execution (output and monitoring violations). These five experiments demonstrate that although some vulnerabilities can be detected by looking solely at the server’s output (i.e., experiment 2 and 5), other kinds of
It is very common for traditional software testing techniques to miss vulnerabilities because the test cases that could trigger them would need to resort to more unconventional ways of interaction, such as illegal and unexpected input, or because their effects are unclear or too subtle to detect by conventional means. In this section, we provide an overview of the current state in testing and in vulnerability discovery to which our work may be related. Our work has been influenced by fault and attack injection techniques. Traditionally, fault injection has been utilized to emulate several kinds of hardware and software faults, ranging from transient memory corruptions to permanent stuck-at faults, for the verification of fault handling mechanisms [5, 8, 35]. By forcing and reproducing the occurrence of irregular and unusual events, fault injection can evaluate the target system’s ability to cope with the presence of faults. 7 Typically, one test case takes one or two seconds with a few more seconds to restart the environment conditions.
8
Our methodology also consists in injecting faults (test cases) at the interface of target systems. Robustness testing and fuzzers are some approaches that study the system’s ability in handling with erroneous input conditions at their interface [2, 18, 22]. Throughout the years, these approaches have evolved into more intelligent, and less random, vulnerability detectors [6, 31, 36]. However, in some cases they have become too specialized, and lack more thorough monitoring and detection mechanisms—usually only fatal crashes or predefined vulnerability behaviors are detected. Other works in fault injection use an established baseline of the correct behavior to detect problems while testing, by resorting to a golden run that is compared against the state of the faulty runs [29]. However, this approach can only be used in test cases that consist in valid execution runs where a single fault can be inserted. When the whole test case is the actual fault (i.e., a protocol request sent to the server), there is no easy way to devise a golden run. In our approach, we infer a model of the correct behavior of the system under testing. We rely on the capture and automatic analysis of program executions to derive the expected behavior. Analyzing the execution of applications has been addressed before. Some authors showed that failed runs tend to have execution profiles that diverge from the normal executions [11]. One work, for instance, uses the sequence of function calls performed by different program runs to observe how they cluster in a 2D multidimensional scatter plot, revealing how similar or dissimilar the executions are [20]. Besides program executions, other techniques were devised to identify failures caused by specific sequences of events that were reported in log files [21]. This approach consists first in using the logs of correct executions to automatically infer dependencies between events and values and to generate a model of the correct behavior. Then, the logs of the faulty executions are compared with the generated models to detect anomalous event sequences. This approach is more suitable to detect problems that exist in the interaction between components in larger networking systems, as long as they are properly logged. While our approach does not actually resort to log files (although they could be accommodated as part of the monitoring data), we do use other sources of information to detect abnormal behavior, more appropriate for the type of faults we wish to detect, i.e., vulnerabilities in a server under test. Other works are not focused on detecting new and unknown vulnerabilities, but on guaranteeing that known vulnerabilities do not slip into the systems. These solutions usually provide a great level of automation and require an extensive and constantly updated repository of known vulnerabilities with the respective test cases to detect them [26, 28, 34]. A set of vulnerability checking modules, written as scripts, is responsible for checking for specific known vulnerabilities. Some known vulnerabilities may even be fixed by special vulnerability fixing modules. Other solutions are used
in industry to automate the process of testing and to measure their products. In one published work, the authors propose an automated assessment infrastructure that provides a complete framework to manage a test case repository and to deploy the test cases automatically, from the initial configuration and setup to the respective execution, monitoring, and reporting [37]. Our approach uses a specification of the protocol as a formal model that represents the external behavior of a server under test that implements that protocol. Specification-based testing has been used before, both to generate test cases and to verify the compliance of the results (e.g., protocol testing [19], conformance testing [7], software testing [17], vulnerability discovery [3]). Specifications are usually written in special purpose tools that model and design test cases to validate high level functional specifications [13]. One approach resorts to formal specifications to generate input data for test cases [27]. Specifications are written in Lustre and are translated into test data generators that implement several testing strategies, such as random testing, operational profile, behavioral pattern or safety-property guided testing. Lutess then sends the generated input test sequences to the software under test and checks the corresponding output with a test oracle to detect faults. The test oracle is usually derived from previously specified safety properties. While our approach resorts to a specification of the protocol, these works could potentially be utilized as a complement since they can be used to write specifications and to automatically generate test cases based on those specifications.
6. Conclusions The paper presents a new approach that can complement existing testing tools that generate and execute test cases but lack monitoring and automatic analysis capabilities to discover security vulnerabilities. Our methodology infers a behavioral profile that models the server’s correct execution of the protocol combined with local monitoring data. This profile is then used as a reference to detect any deviation from the expected behavior while the server executes the test cases. Violations to the behavioral profile indicate that a test case has triggered some fault and provide additional information about the faulty behavior. Our experimental evaluation show that since this approach uses external and internal sources of execution information, it is able to detect the types of faulty behavior found in all 122 known FTP vulnerabilities, from wrong responses to the execution of an unexpected set of instructions or to the unusual amounts of resource utilization.
References [1] Acutenix. Acunetix web vulnerability http://www.acunetix.com/, retrieved on 2011.
9
scanner.
[20] D. Leon, A. Podgurski, and W. Dickinson. Visualizing similarity between program executions. In Proc. of the Int. Symp. on Software Reliability Engineering, pages 311– 321, 2005. [21] L. Mariani and F. Pastore. Automated identification of failure causes in system logs. In Proc. of the Int. Symp. on Software Reliability Engineering, pages 117–126, 2008. [22] B. P. Miller, L. Fredriksen, and B. So. An empirical study of the reliability of UNIX utilities. Communications of the ACM, 33(12):32–44, 1990. [23] P. Mockapetris. Domain names – implementation and specification (DNS). RFC 1035, 1987. [24] J. Myers and M. Rose. Post Office Protocol – Version 3 (POP). RFC 1939, 1996. [25] J. Postel and J. Reynolds. File Transfer Protocol (FTP). RFC 959, 1985. [26] T. N. Security. Nessus open source vulnerability scanner. http://www.tenable.com/products/nessus, retrieved on 2011. [27] B. Seljimi and I. Parissis. Using CLP to automatically generate test sequences for synchronous programs with numeric inputs and outputs. In Proc. of the Int. Symp. on Software Reliability Engineering, pages 105–116, 2006. [28] A. Sharma, J. Martin, N. Anand, M. Cukier, and W. Sanders. Ferret: a host vulnerability checking tool. In Proc. of theIEEE Pacific Rim Int. Symp. on Dependable Computing, pages 389–394, 2004. [29] V. Sieh, O. Tschäche, and F. Balbach. VERIFY: Evaluation of reliability using VHDL-models with embedded fault descriptions. In Proc. of the Int. Symp. on Fault-Tolerant Computing, pages 32–36, 1997. [30] C. Sullo and D. Lodge. Nikto2. http://www.cirt.net/nikto2, retrieved on 2011. [31] M. Sutton. FileFuzz. http://labs.idefense.com/software/fuzzing.php#more_filefuzz, retrieved on 2011. [32] M. Sutton, A. Greene, and P. Amini. Fuzzing: Brute Force Vulnerability Discovery. Addison-Wesley Professional, 2007. [33] A. Takanen, J. DeMott, and C. Miller. Fuzzing for software security testing and quality assurance. Artech House Publishers, 2008. [34] M. Tamizi, M. Weinstein, and M. Cukier. Automated checking for Windows host vulnerabilities. In Proc. of the Int. Symp. on Software Reliability Engineering, pages 139– 148, 2005. [35] T. K. Tsai and R. K. Iyer. Measuring fault tolerance with the FTAPE fault injection tool. In Int. Conf. on Modeling Techniques and Tools for Computer Performance Evaluation, volume 977 of LNCS, pages 26–40. 1995. [36] University of Oulu. PROTOS – security testing of protocol implementations. http://www.ee.oulu.fi/research/ouspg/protos/, 1999–2003. [37] X. Wang, H. Shi, T. Huang, and F. Lin. Integrated software vulnerability and security functionality assessment. In Proc. of the Int. Symp. on Software Reliability Engineering, pages 103–108, 2007. [38] C. Warrender, S. Forrest, and B. Pearlmutter. Detecting intrusions using system calls: Alternative data models. In IEEE Security and Privacy, pages 133–145, 1999.
[2] A. Albinet, J. Arlat, and J.-C. Fabre. Characterization of the impact of faulty drivers on the robustness of the Linux kernel. In Proc. of the Int. Conf. on Dependable Systems and Networks, pages 867–876, 2004. [3] J. Antunes, N. Neves, M. Correia, P. Verissimo, and R. Neves. Vulnerability removal with attack injection. IEEE Trans. on Software Engineering, 36:357–370, 2010. [4] J. Antunes, N. Neves, and P. Verissimo. ReverX: Reverse engineering of protocols. In Proc of the Working Conference on Reverse Engineering, 2011. [5] J. Arlat, A. Costes, Y. Crouzet, J.-C. Laprie, and D. Powell. Fault injection and dependability evaluation of fault-tolerant systems. IEEE Trans. on Computers, 42(8):913–923, 1993. [6] T. Biege. Radius fuzzer. http://www.suse.de/˜thomas/projects/radius-fuzzer/, retrieved on 2011. [7] B. Bosik and M. Umit Uyar. Finite state machine based formal methods in protocol conformance testing: From theory to implementation. Computer Networks and ISDN Systems, 22(1):7–33, 1991. [8] J. Carreira, H. Madeira, and J. G. Silva. Xception: A technique for the experimental evaluation of dependability in modern computers. IEEE Trans. on Software Engineering, 24(2):125–136, 1998. [9] Core Security Technologies. Core impact. http://www.coresecurity.com/content/core-impact-overview, retrieved on 2011. [10] K. Derderian, R. Hierons, M. Harman, and Q. Guo. Automated unique input output sequence generation for conformance testing of FSMs. The Computer Journal, 49(3):331, 2006. [11] W. Dickinson, D. Leon, and A. Podgurski. Finding failures by cluster analysis of execution profiles. In Proc. of theInt. Conf. on Software Engineering, pages 339–348, 2001. [12] R. Droms. Dynamic Host Configuration Protocol (DHCP). RFC 2131, 1997. [13] L. du Bousquet, F. Ouabdesselam, J. Richier, and N. Zuanon. Lutess: a testing environment for synchronous software. Tool Support for System Specification, Development and Verification, pages 48–61, 1998. [14] eEye Digital Security. Retina network security scanner. http://www.eeye.com/, retrieved on 2011. [15] M. Fossi, J. Blackbird, G. Egan, M. K. Low, K. Haley, D. Mazurek, E. Johnson, D. McKinney, T. Mack, P. Wood, and T. Adams. Symantec internet security threat report: Trends for 2010. Volume XVI, 2011. [16] M. Fossi, E. Johnson, D. Turner, T. Mack, J. Blackbird, D. McKinney, M. Low, T. Adams, M. Laucht, and J. Gough. Symantec report on the underground economy. Technical report, Symantec, 2008. [17] R. M. Hierons, K. Bogdanov, J. P. Bowen, R. Cleaveland, J. Derrick, J. Dick, M. Gheorghe, M. Harman, K. Kapoor, P. Krause, G. Lüttgen, A. J. H. Simons, S. A. Vilkomir, M. R. Woodward, and H. Zedan. Using formal specifications to support testing. ACM Computing Surveys, 41(2):1–76, 2009. [18] P. Koopman and J. DeVale. The exception handling effectiveness of POSIX operating systems. IEEE Trans. on Software Engineering, 26(9):837–848, 2000. [19] R. Lai. A survey of communication protocol testing. Journal of Systems and Software, 62(1):21–46, 2002.
10