Oct 3, 2013 ... ISO 20926 no no. Captures customer view. Expected. Expected. Definitely.
Useful for benchmarking outside the company. Could be. Could be.
1°International Conference on IT Data Collection, Analysis and Benchmarking Rio de Janeiro (Brazil) - October 3, 2013
Using Benchmarks to Accelerate Process Improvement Joe Schofield
[email protected]
IT Confidence 2013 – October 3, 2013
http://itconfidence2013.wordpress.com
1
Using Benchmarks to Accelerate Process Improvement
1. 2. 3. 4. 5. 6.
Goals of the Presentation
Establish a brief framework for benchmarking: definition, benefits, approach Using a real life story, explore some of the motivation for benchmarking Present several examples of why cost and schedule data, without some notion of product quality can be misleading Provide compelling evidence for the need for meaningful size attributes Provide insights regarding the need for benchmark data to support process improvement Identify what makes measurements useful (5 Cs) IT Confidence 2013 – October 3, 2013
http://itconfidence2013.wordpress.com
2
Abstract Using Benchmarks to Accelerate Process Improvement Organizations are constantly pressured to prove their value to their leadership and customers. A relative comparison to “peer groups” is often seen as useful and objective, thus benchmarking becomes an apparent alternative. Unfortunately, organizations new to benchmarking may have limited internal data for making valid comparisons. Feedback and subsequent “action” can quickly lead to the wrong results as organizations focus on improving their comparisons instead of improving their capability and consistency. Adding to the challenge of improving results, software organizations may rely on more readily available schedule and financial data rather than indicators of product quality and process consistency. This presentation provides measurement program lessons learned and insights to accelerate benchmark and quantification activities relevant to both new and mature measurement programs.
IT Confidence 2013 – October 3, 2013
http://itconfidence2013.wordpress.com
3
Benchmarking Defined Benchmarking is the process of comparing one's business processes and performance metrics to industry bests or best practices from other industries. Dimensions typically measured are quality, time and cost. In the process of best practice benchmarking, management identifies the best firms in their industry, or in another industry where similar processes exist, and compares the results and processes of those studied (the "targets") to one's own results and processes. In this way, they learn how well the targets perform and, more importantly, the business processes that explain why these firms are successful. Benchmarking is used to measure performance using a specific indicator (cost per unit of measure, productivity per unit of measure, cycle time of x per unit of measure or defects per unit of measure) resulting in a metric of performance that is then compared to others. Also referred to as "best practice benchmarking" or "process benchmarking", this process is used in management and particularly strategic management, in which organizations evaluate various aspects of their processes in relation to best practice companies' processes, usually within a peer group defined for the purposes of comparison. This then allows organizations to develop plans on how to make improvements or adapt specific best practices, usually with the aim of increasing some aspect of performance. Benchmarking may be a one-off event, but is often treated as a continuous process in which organizations continually seek to improve their practices. Wikipedia: 5/31/2013
IT Confidence 2013 – October 3, 2013
http://itconfidence2013.wordpress.com
4
Benchmarking and Other Tools In 2008, a comprehensive survey on benchmarking was commissioned by The Global Benchmarking Network, a network of benchmarking centers representing 22 countries. Over 450 organizations responded from over 40 countries. The results showed that organizations using 20 improvement tools: •77% use Mission and Vision Statements and Customer (Client) Surveys •72% use SWOT analysis •68% use Informal Benchmarking (68%) •49 % use Performance Benchmarking •39% use Best Practice Benchmarking The tools that are likely to increase in popularity the most over the next three years are: •Performance Benchmarking •Informal Benchmarking •SWOT •Best Practice Benchmarking Over 60% of organizations that are not currently using these tools indicated they are likely to use them in the next three years. Wikipedia: 5/31/2013 IT Confidence 2013 – October 3, 2013
http://itconfidence2013.wordpress.com
5
Benchmarking Approaches Identify problem areas: Because benchmarking can be applied to any business process or function, a range of research techniques may be required. They include informal conversations with customers, employees, or suppliers; exploratory research techniques such as focus groups; or in-depth marketing research, quantitative research, surveys, questionnaires, re-engineering analysis, process mapping, quality control variance reports, financial ratio analysis, or simply reviewing cycle times or other performance indicators. Before embarking on comparison with other organizations it is essential to know the organization's function and processes; base lining performance provides a point against which improvement effort can be measured. Identify other industries that have similar processes: For instance, if one were interested in improving hand-offs in addiction treatment one would identify other fields that also have hand-off challenges. These could include air traffic control, cell phone switching between towers, transfer of patients from surgery to recovery rooms. Identify organizations that are leaders in these areas: Look for the very best in any industry and in any country. Consult customers, suppliers, financial analysts, trade associations, and magazines to determine which companies are worthy of study. Survey companies for measures and practices: Companies target specific business processes using detailed surveys of measures and practices used to identify business process alternatives and leading companies. Surveys are typically masked to protect confidential data by neutral associations and consultants. Visit the "best practice" companies to identify leading edge practices: Companies typically agree to mutually exchange information beneficial to all parties in a benchmarking group and share the results within the group. Implement new and improved business practices: Take the leading edge practices and develop implementation plans which include identification of specific opportunities, funding the project and selling the ideas to the organization for the purpose of gaining demonstrated value from the process. Wikipedia: 5/31/2013 IT Confidence 2013 – October 3, 2013
http://itconfidence2013.wordpress.com
6
Selected Benchmarking Types 1 0f 2 Process benchmarking - the initiating firm focuses its observation and investigation of business processes with a goal of identifying and observing the best practices from one or more benchmark firms. Activity analysis will be required where the objective is to benchmark cost and efficiency; increasingly applied to back-office processes where outsourcing may be a consideration. Financial benchmarking - performing a financial analysis and comparing the results in an effort to assess your overall competitiveness and productivity. Performance benchmarking - allows the initiator firm to assess their competitive position by comparing products and services with those of target firms. Product benchmarking - the process of designing new products or upgrades to current ones. This process can sometimes involve reverse engineering which is taking apart competitors products to find strengths and weaknesses. Wikipedia: 5/31/2013
IT Confidence 2013 – October 3, 2013
http://itconfidence2013.wordpress.com
7
Benchmarking Types 2 0f 2 Strategic benchmarking - involves observing how others compete. This type is usually not industry specific, meaning it is best to look at other industries. Functional benchmarking - a company will focus its benchmarking on a single function to improve the operation of that particular function. Complex functions such as Human Resources, Finance and Accounting and Information and Communication Technology are unlikely to be directly comparable in cost and efficiency terms and may need to be disaggregated into processes to make valid comparison. Best-in-class benchmarking - involves studying the leading competitor or the company that best carries out a specific function. Operational benchmarking - embraces everything from staffing and productivity to office flow and analysis of procedures performed.
Wikipedia: 5/31/2013
IT Confidence 2013 – October 3, 2013
http://itconfidence2013.wordpress.com
8
Benchmarking Comments • Organizations are reluctant to publicly share their data; therefore, purchase data from ISBSG Deeper Reading: Effective Applications Development and Maintenance; The IFPUG Guide to IT and Software Measurement; Pam Morris; 2012
• It is much more difficult to obtain correct and reliable information with regard to external organizations. Benchmark defect turnaround times, defect age. Deeper Reading: Benchmarking Techniques and Their Applications in IT; The IFPUG Guide to IT and Software Measurement; Nishant Pandey; 2012
• Improvement Needs Measurement : Measurement Needs Improvement, me 6-13-2013
IT Confidence 2013 – October 3, 2013
http://itconfidence2013.wordpress.com
9
If Published Data is True . . . Barry Boehm – requirements defects that made their way into the field could cost 50200 times as much to correct as defects that were corrected close to the point of creation. Boehm, Barry W. and Philip N. Papaccio. "Understanding and Controlling Software Costs," IEEE Transactions on Software Engineering, v. 14, no. 10, October 1988, pp. 1462-1477.
An example: These four Projects (A, B, C, D) produced the same product using the same technology, but different verification processes
Project
Cost
Person Months
Project A
$250K
10
Often and disciplined (rigorous, CRM, . . .)
Project B
$500K
20
Often but not disciplined
100 %
Project C
$1,000K
40
Not often and not disciplined
400 %
Project D
$50,000K 2000
Worst case per Boehm (100x)
2000 %
Reviews
IT Confidence 2013 – October 3, 2013
Variation
http://itconfidence2013.wordpress.com
10
If Published Data is True . . . Capers Jones – reworking defective requirements, design, and code typically consumes 40 to 50 percent or more of the total cost of most software projects and is the single largest cost driver.
Jones, Capers. Estimating Software Costs, New York: McGrawHill, 1998.
An example: These two Projects produced the same product using the same technology, but used different requirements elicitation techniques
Project
Cost
Person Months
Project A
$250K
10
Captured and understood early
Project B
$500K
20
Requirements volatility at high-end (50%)
Requirements
IT Confidence 2013 – October 3, 2013
Variation 100 %
http://itconfidence2013.wordpress.com
11
If Research is True . . . Capers Jones – as a rule of thumb, every hour you spend on technical reviews upstream will reduce your total defect repair time from three to ten hours. Jones, Capers. Assessment and Control of Software Risks. Englewood Cliffs, N.J.: Yourdon Press, 1994.
An example: These three Projects produced the same product using the same technology, but one used technical reviews, the others did not
Project
Cost
Person Months
Project A
$25K
1
Spent 1 person month in reviews
Project B
$75K
3
Did not conduct reviews (3 months of repair time)
300 %
Project C
$250K
10
Worst case with data
1000 %
Reviews
IT Confidence 2013 – October 3, 2013
Variation
http://itconfidence2013.wordpress.com
12
If Research is True . . . Don O’Neill – calculated the ROI for software inspections between four and eight to one.
O’Neill, Don; National Software Quality Experiment: Results 1992 – 1999: Software Technology Conference, Salt Lake City, 1995, 1996, 2000
An example: These three Projects produced the same product using the same technology, but one used inspections, the others did not
Project
Cost
Person Months
Project A
$25K
1
Spent 1 person month in reviews
Project B
$100K
4
Did not conduct (4 months repair time)
400 %
Project C
$200K
8
Worst case with data (8 months repair)
800 %
Inspections
IT Confidence 2013 – October 3, 2013
Variation
http://itconfidence2013.wordpress.com
13
Summary of Defect-Related Data
“You don’t know the status of your project (D, I)until you know the fidelity of your process (K, W).” Assertion – In the absence of defect data: • Productivity metrics are misleading • Quality metrics are inadequate • Value is impossible to ascertain
Opportunity – Reduce development and support costs
• Industry data has demonstrated a ROI for peer reviews of 2:1 to 3:1 • 30 – 60 percent of all development work is rework from changing or misunderstood requirements • Instead of removing defects early in product development, organizations often rely on more testing to improve the quality of their products. It’s the other 50 percent of defects from requirements and design that aren’t found by testing, and which are the most expensive to resolve.
Fidelity – Quantifying how often we do what we say . . .
• We have a policy for product development, how often do we follow it? • We have a process for product development, how often do we use it? • We have criteria for tailoring our work, how often do we apply it? • During a crisis, do we rely on process or abandon it? • Is it useful or possible to benchmark with other organizations if we characterize our own capability?
“7” Types of Waste – Toyota 1.Overproduction 2.Inventory 3.Wait Time 4.Transportation 5.Processing 6.Motion 7.Defects 8.Underutilized People
Ref: Fidelity & Defect Metrics; Information Technology Measurement and Governance – International Strategies; Ottawa, Canada, May 1, 2013; Joe Schofield
IT Confidence 2013 – October 3, 2013
http://itconfidence2013.wordpress.com
14
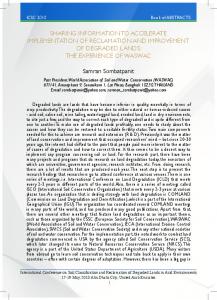
Inappropriate size measures will distort your data: lines of code, story points, page size
Deeper Reading: The Statistically Unreliable Nature of Lines of Code; CrossTalk; April, 2005 - NIST Citation IT Confidence 2013 – October 3, 2013
http://itconfidence2013.wordpress.com
15
Inappropriate size measures will distort your data: lines of code, story points, page size Characteristic
Function Points
Use Case Points
Story Points
Useful at the project level for estimating or planning
With historical FP data
With historical UCP data
With historical SP data
ISO / Standards based
ISO 20926
no
no
Captures customer view
Expected
Expected
Definitely
Useful for benchmarking outside the company
Could be
Could be
Less so
Easy to calculate
Less so
More so
Yes
Easy to validate for repeatability / consistency
More so
More so
Less so
Objectivity
More so
More so
Less so (team / team member variability)
Yes
Yes
Maybe
Yes
Not exclusively (may include refactoring, design, and other work)
Technologically independent Functional measurement to customer
Yes
Deeper Reading Function Points, Use Case Points, Story Points: Observations from a Case Study; CrossTalk; May / June, 2013 IT Confidence 2013 – October 3, 2013
http://itconfidence2013.wordpress.com
16
Inappropriate size measures will distort your data: lines of code, story points, page size Initial settings
Margins
Font
Font Size
Spacing
Bolding
Char. Per page
.3 top & bottom; . 4 sides
Times New Roman
10
Single
none
7584
0
5450
28
5686
25
5177
32
4353
43
ON
7185
5
ON
1403
83
1” Verdana 12 Double
Initial settings
% Content Loss
1”
Verdana
12
Double
Read “% Content Loss” (last column) as variation!
Cumulative difference of one page to almost six
Consider still larger font, font size, spacing, charts, diagrams, pictures, etc.
Impact on PMC SP1.1 – Monitor actual values of project planning parameters against the project plan.
Deeper Reading Size - The Forgotten Measure; SEPG North America; Albuquerque, N. M.; March 15, 2012 IT Confidence 2013 – October 3, 2013
http://itconfidence2013.wordpress.com
17
5 C’s of Sizing Measures
Deeper Reading: : Size - The Forgotten Measure; SEPG North America; Albuquerque, N. M.; March 15, 2012 IT Confidence 2013 – October 3, 2013
http://itconfidence2013.wordpress.com
18
Takeaways • You won’t understand your benchmark data until you understand your process fidelity • Inappropriate size measures will distort your data: story points, lines of code, page size • The absence of quality-related data will distort your benchmark results • Allowing teams to retain their own measures and report them as needed to a measurement group will add a layer of inconsistency to your data • Benchmark to improve, not to impress
IT Confidence 2013 – October 3, 2013
http://itconfidence2013.wordpress.com
19
Questions
IT Confidence 2013 – October 3, 2013
http://itconfidence2013.wordpress.com
20
Further Readings Joe Schofield is the President of the International Function Point Users Group. He retired from Sandia National Laboratories as a Distinguished Member of the Technical Staff after a 31-year career. During twelve of those years he served as the SEPG Chair for an organization of about 400 personnel which was awarded a SW-CMM® Level 3 in 2005. He continued as the migration lead to CMMI® Level 4 until his departure. Joe has facilitated over 100 teams in the areas of software specification, team building and organizational planning by using lean six sigma and business process reengineering. Joe has taught graduate courses since 1990. He was a licensed girl’s mid-school basketball coach for 21 seasons--the last five undefeated, over a span of 50 games. He has over 80 published books, papers, conference presentations
http://joejr.com/presentd.htm (~55) and keynotes—including contributions to the books The IFPUG Guide
to IT and Software Measurement (2012), IT Measurement, Certified
http://joejr.com/publishd.htm (~36) Function Point Specialist Exam Guide, and The Economics of Software
Quality. He is a CMMI Institute-certified Instructor for the Introduction to the CMMI® and two other CMMI Institute courses, Certified Software Quality Analyst, Certified Function Point Specialist, and a Certified Software Measurement Specialist. Joe is a frequent presenter in the Software Best Practices Webinar Series sponsored by Computer Aid, Inc. Joe completed his Master’s degree in MIS at the University of Arizona in 1980. By "others" he is known as a husband, father, and grandfather.
IT Confidence 2013 – October 3, 2013
http://itconfidence2013.wordpress.com
21