JBI408.fm Page 441 Thursday, July 27, 2000 3:22 PM
Journal of Biogeography, 27, 441–455
Blackwell Science, Ltd
Using between-model comparisons to fine-tune linear models of species ranges Graeme S. Cumming* Department of Zoology, Oxford University, South Parks Road, Oxford OX1 3PS, U.K.
Original Article
Abstract Aim To offer an objective approach to some of the problems associated with the development of logistic regression models: how to compare different models, determination of sample size adequacy, the influence of the ratio of positive to negative cells on model accuracy, and the appropriate scale at which the hypothesis of a non-random distribution should be tested. Location Test data were taken from Southern Africa. Methods The approach relies mainly on the use of the AUC (Area under the Curve) statistic, based on ROC (threshold Receiver Operating Characteristic) plots, for between-model comparisons. Data for the distribution of the bont tick Amblyomma hebraeum Koch (Acari: Ixodidae) are used to illustrate the methods. Results Methods for the estimation of minimum sample sizes and more accurate hypothesis-testing are outlined. Logistic regression is robust to the assumption that uncollected cells can be scored as negative, provided that the sample size of cells scored as positive is adequate. The variation in temperature and rainfall at localities where A. hebraeum has been collected is significantly lower than expected from a random sample of points across the data set, suggesting that within-site variation may be an important determinant of its distribution. Main conclusions Between-model comparisons relying on AUCs can be used to enhance objectivity in the development and refinement of logistic regression models. Both between-site and within-site variability should be considered as potentially important factors determining species distributions. Keywords Logistic regression, ticks, Ixodidae, Amblyomma hebraeum, modelling, ROC plots, AUC.
INTRODUCTION Linear models of species ranges are emerging as valuable tools in broad-scale biology. Such models quantify the relationship between environmental data and known occurrences of the study species (Table 1). They can be used to estimate current species ranges, to predict future changes in their extent, and to establish the importance of particular variables in determining the distributions of individual organisms (Agresti, 1996). Their potential applications include predic-
Correspondence: G. S. Cumming, Center for Limnology, 680 North Park Street, Madison, Wisconsin 53706. E-mail:
[email protected] *Present address: Center for Limnology, 680 North Park Street, Madison, Wisconsin 53706, U.S.A. E-mail:
[email protected]
© 2000 Blackwell Science Ltd
tion of the effects of habitat alterations on the distributions of rare or endangered species; estimation of the likelihood of invasion by an alien species in a given area; the development of risk-maps for disease control; and tests of broad-scale hypotheses in ecology and biogeography. Linear species-range models produced using logistic regression or discriminant analysis have found useful applications in ecology (e.g. Osborne & Tigar, 1992; Haila et al., 1996; North & Reynolds, 1996; Berry & Bock, 1998) conservation biology (e.g. Austin et al., 1996; Wiser et al., 1998; Lindenmayer et al., 1999), epidemiology (e.g. Duchateau et al., 1997; Rogers et al., 1996; Robinson et al., 1997; Venier et al., 1998), and biogeography (e.g. Cumming, 1999). Despite the potential value of linear models for analyses that rely on the description of species ranges, few studies have compared different modelling methods (Guisan et al.,
JBI408.fm Page 442 Thursday, July 27, 2000 3:22 PM
442 Graeme S. Cumming
Table 1 Steps to produce a linear species-range model. Steps to produce a linear species-range model 1. 2. 3. 4.
The area of interest is divided into a set of unit-sized cells. Each cell is scored either ‘1’ if the species has been found there, or ‘0’ if it has not. Values of the environmental (predictive) data are obtained for each cell. These data may be numeric or categorical. The species occurrence data are compared to the environmental data using a logistic regression or discriminant analysis, where species occurrence is seen as a dependent variable ranging from 0 to 1. 5. A linear equation is produced. This equation gives the probability of occurrence of the species within each cell. 6. The probabilities of occurrence are mapped to produce an information-rich species range map.
1999) or taken advantage of the additional inferential power that comparison between models can bring. A procedure for ranking alternative options or strategies is an essential step in good decision-making (Goodwin & Wright, 1991). Quantitative comparisons between linear models (i.e. between models based on different variables for the same species, or different species and the same variables) can be used in two highly valuable ways; firstly, to fine-tune individual models and make the modelling approach more objective; and secondly, to compare and contrast broad-scale hypotheses across a range of species (Cumming, 1999). The use of between-model comparisons has been hindered by the lack of a standard approach to such comparisons. Many of the more traditional methods for establishing the internal integrity of an individual linear model are less applicable to between-model comparisons. Most of the statistics associated with a linear model are highly dependent on parameters such as the total number of cells considered and the relative proportion of cells scored ‘1’ to those scored ‘0’ (Fielding & Bell, 1997). The individual probability values obtained for a set of cells are also affected by the total sample size. Consequently, a useful between-model comparative technique should not rely on a single probability cut-off point; the value of 0.5, for example, becomes arbitrary when the proportion of positive cells is small relative to the whole area under consideration. A method that offers some promise as a standard between-model comparison technique is the use of ROC (threshold Receiver Operating Characteristic) plots, originally developed in the field of signal processing. ROC plots are relatively new to this arena and are detailed under the methods section. In this paper I show how between-model comparisons using ROC plots can be used to make the development and interpretation of linear models more rigorous and more objective. MATERIALS AND METHODS Data sources The methods are illustrated using the distribution of the bont tick, Amblyomma hebraeum, which is an important vector of livestock diseases in southern Africa (Norval, 1983). Its distribution is modelled using temperature and rainfall vari-
Table 2 Sources of collection data for Amblyomma hebraeum, giving the number of collection records obtained from each publication. Authority
Number of collections
Bedford (1932) Gallivan & Surgeoner (1995) Horak et al. (1984) Horak et al. (1991) Horak et al. (1983) Horak et al. (1983) Keirans (1985) Macleod (1970) Minshull (1981) Norval, 1983 Paine (1982) Santos Dias (1952) Tandon (1991) Theiler (1948) Theiler, 1962 Walker et al. (1978) Yeoman & Walker, 1967 Zumpt (1958)
5 2 2 1 2 7 13 1 1 288 55 20 7 314 7 25 2 13
ables on a quarter-degree grid covering Africa. Distribution data for A. hebraeum were obtained from mapped localities using a Calcomp III digitiser, or using collection localities and/or coordinates given by the author(s) (data sources are listed in Table 2). These data were plotted on the map of Africa (Fig. 1). Climatic data came from the Centre for Resources and Environmental Studies (CRES) database published on CD-ROM by Hutchinson et al. (1996). This database consists of 60-year mean (1920–80) interpolated estimates on a monthly basis for minimum temperature (from 1504 stations), maximum temperature (1499 stations), rainfall (6051 stations) and elevation (based on 1 : 1 m scale air navigation charts). The digital elevation model (DEM), and the variables that it is used to predict, cover Africa on a grid spanning 17.5W to 51.5E and 37.5N to 35.0S, at a spatial resolution of 0.05 degrees and with a standard error for elevation ranging between 20 and 150 m (Hutchinson et al., 1996). Madagascar © Blackwell Science Ltd 2000, Journal of Biogeography, 27, 441–455
JBI408.fm Page 443 Thursday, July 27, 2000 3:22 PM
Fine-tuning linear models 443
Figure 1 Collection records of the bont tick, Amblyomma hebraeum, derived from the sources listed in Table 1. Each collection locality is represented by a dot on the map. The quarter-degree grid shows the resolution at which analysis was undertaken.
was excluded from the analysis because of its different history and unique combination of indigenous and exotic ticks. The resolution of the original data was decreased to 0.25 × 0.25 degrees by taking the mean value for each variable of all points within a given sixteenth-degree cell. All analyses were performed using the software packages SPSS (version 7.5) or STATA (version 5.0). The dependence of ticks on climate has long been acknowledged (e.g. Theiler, 1962; Yeoman & Walker, 1967; Morel, 1969). The biology of A. hebraeum is intimately linked to temperature, rainfall and vegetation, suggesting that climatic data are a suitable basis from which to model its distribution. According to Norval (1983), numbers of A. hebraeum adults in Zimbabwe peak during FebruaryMay (i.e. during and following the wettest months of the year) and nymphs and larvae are most abundant in AugustNovember (i.e. before and at the start of the rainy season). Vegetation (through its effect on microclimate), daylength, temperature, and rainfall have all been implicated as important influences on the seasonal activity of A. hebraeum (Norval, 1977). Statistical methods This paper is primarily concerned with logistic regression models, which are discussed in detail by Agresti (1996). Since my purpose is to illustrate how between-model com© Blackwell Science Ltd 2000, Journal of Biogeography, 27, 441–455
parisons can be useful, I have used complex, multivariate models on a single theme for demonstration purposes. The emphasis is on the approach, rather than on the accuracy of the models themselves. For each model the value of the coefficient (B) for each variable is given, along with the associated standard error and Wald statistic. The Wald statistic, also termed z 2, is a test for the significance of B and has a largesample chi2 distribution (Agresti, 1996). It is obtained by dividing the coefficient by its standard error and squaring the result. The Wald statistic is a more reliable indicator of the variable’s importance than the beta coefficient because it is less sensitive to outliers or extreme values. Larger Wald values indicate that the variable contributes more to the final result, although this contribution may be positive or negative as determined by the sign of the coefficient. Comparison between different linear models requires an approach that is independent of a particular probability cutoff level. Unless an independent ground-truthing study is undertaken, the model’s accuracy can only be measured using known data. A good model should assign high probabilities to cells containing presences and to cells with similar environmental conditions to these; and low probabilities to outliers and cells remote from known collections or in significantly different environments. If all cells in which occurrences of the study species have been registered are termed positives, and all cells where the species has not been recorded are termed negatives, then sensitivity is defined as
JBI408.fm Page 444 Thursday, July 27, 2000 3:22 PM
444 Graeme S. Cumming
Table 3 Definition of the terms sensitivity and specificity. Where + indicates presence and—indicates absence, these are defined as sensitivity = a/(a +c) and specificity = d/(b + d). ROC plots use 1-specificity = b/(b +d). Total cases = N = a + b + c + d. Observed
Predicted
+ −
+
−
a c
b d
Figure 3 Example threshold Receiver Operating Characteristic (ROC) plot, calculated manually from the data in Table 4, comparing the discriminant analysis model in Figure 4 (∆) to the logistic regression model in Figure 5 (•). Further details in text.
Figure 2 Flowchart outlining the steps involved in producing a ROC (threshold receiver Operating Characteristic) plot. A worked example is given in Table 4.
the probability that the model produces a positive result in a positive locality and specificity is the probability that the model produces a negative result in a negative locality (Table 3; Agresti, 1996). The converse of specificity (i.e. 1specificity) is the probability that the model produces a positive result at a negative locality. Sensitivity and specificity can be considered at different probability cut-off levels within the data to produce a series of sensitivity/specificity pairs. As the probability cut-off threshold above which observations are considered is varied, different proportions of positive and negative cells are included. The balance between sensitivity and specificity over this range suggests a criterion by which a model’s performance can be assessed; its fit is optimal if sensitivity approaches 1 when (1-specificity) is close to 0, and random if sensitivity and (1-specificity) are equivalent. Plotting the sensitivity values on the y-axis against their equivalent (1-specificity) values for each probability threshold produces a ROC (threshold Receiver Operating Characteristic) plot (Fielding & Bell, 1997; Figs 2 and 3). The ROC plot for a well-fitting model will show a rapid increase and then little or no change in its gradient, while the curve for a random model will follow the diagonal between the origin and the point (1; 1). The area under the curve (termed AUC for ‘Area Under Curve’) of the ROC plot is particularly useful; it offers a quantitative, cut-off free assessment of model performance. A value of 0.8 for the
AUC means that in eight out of ten instances, a cell selected at random from the group of those originally scored ‘1’ will have a higher probability than a cell selected at random from the group originally scored ‘0’ (Fielding & Bell, 1997). Manual calculation of the AUC for ROC plots of two different models is described in Table 4. Fine-tuning of model parameters can be achieved by quantifying the way that the AUC changes when all but one of the variables in the model are held constant and the variable of interest is considered across its range. Model interpretation Climatic data are some of the most readily available and obvious data to use in modelling the species ranges of organisms that are highly dependent on temperature and moisture. Their use poses some statistical problems, however, because variables such as rainfall, temperature and elevation are highly correlated with one another. Adjacent regions are likely to experience similar climatic conditions, making spatial and temporal autocorrelation an issue (Legendre, 1993). When small numbers of variables are involved, autocorrelation can be removed by regressing one variable on another and using the residuals in place of the original variable. For larger numbers of variables, the most obvious solutions to these problems are either to include spatial correlation explicitly (e.g. Augustin et al., 1996), or to remove variables that contribute little to the final result or are highly correlated with one another (Agresti, 1996). Data reduction by averaging is of little use for climatic variables, as annual or bi-monthly means do not capture the seasonal variation and covariance that drive many systems and their use generally reduces the ability of the data to explain species distributions. One possibility is to use Principal Components Analysis (PCA) to translate the data onto orthogonal axes; but for the pan-African climatic data, PCA © Blackwell Science Ltd 2000, Journal of Biogeography, 27, 441–455
JBI408.fm Page 445 Thursday, July 27, 2000 3:22 PM
Fine-tuning linear models 445
Table 4 Data used for manual calculation of AUCs comparing logistic regression to linear discriminant analysis for A. hebraeum. The necessary values can be calculated in each case once the values indicated by (find) are obtained using the descriptive statistics command. The AUC is estimated by finding the area under the points as if they were connected by straight lines. P, probability; #, number; +ves, positives; −ves, negatives; AUC, Area Under Curve. Each locality (0.25 × 0.25 degree cell) in the study area is coded either 1 for presence/positive or 0 for absence/negative of the study species. The output from the analysis produces a probability for each locality. The column of known collection localities contains observed values (‘observed’ column); the probability column contains predicted values (‘predicted’). From the definitions in Table 1, the number of observations in the data set is N. Observations are considered above and below a series of increasingly more stringent probability cut-off points (the cut-off point is simply a threshold value that serves as a filter for inclusion or exclusion of points based on their associated probabilities). The number of positives that are both observed and predicted (a) is the sum of the observed column above the selected probability cut-off; the number of observed but not predicted positives (c) is the sum of the observed column below the given probability cutoff. The number of values that are neither observed nor predicted as positive (d) is the number of negatives below the probability cut-off; and the number of values predicted as positive but observed as negative (b) is the number of negatives above the probability cut-off (negatives are found by subtracting the sum of the 1– 0 column from the appropriate cut-off subtotal). The x value, 1-specificity, is b/(b + d); and the y-value, sensitivity, is a/(a + c). Calculation of these parameters for different probability cut-off points produces a succession of paired values that are plotted against one another to produce a ROC plot. All ROC plots start at the origin and end at the point (1; 1). Above p-cutoff
Calculation of points
Estimation of AUC
# +ves c 501-a
# −ves d 8918-n cases+c
1-specificity x b/(b + d)
sensitivity y a/(a + c)
Rectangle
Triangle
AUC
(x2 − x1)*y1
(x2 − x1)*(y2 − y1)/2
Sum areas
Linear Discriminant Analysis 1 0 0 0 0.9 534 246 288 0.8 775 304 471 0.7 1010 347 663 0.6 1265 373 892 0.5 1587 403 1184 0.4 1921 426 1495 0.3 2402 466 1936 0.2 3035 481 2554 0.1 4613 491 4122 0.05 6054 497 5557 0 8918 501 8417
501 255 197 154 128 98 75 35 20 10 4 0
8417 8129 7946 7754 7525 7233 6922 6481 5863 4295 2860 0
0 0.034 0.056 0.079 0.106 0.141 0.178 0.230 0.303 0.490 0.660 1.000
0 0.491 0.607 0.693 0.745 0.804 0.850 0.930 0.960 0.980 0.992 1.000
0 0.011 0.014 0.019 0.026 0.030 0.045 0.068 0.179 0.167 0.337
0.0084 0.001 0.001 0.001 0.001 0.001 0.002 0.001 0.002 0.001 0.001
Logistic Regression 1 0 0 0.9 4 4 0.8 48 33 0.7 109 73 0.6 171 114 0.5 235 158 0.4 346 198 0.3 526 260 0.2 828 347 0.1 1354 443 0.05 1796 475 0 8918 501
501 497 468 428 387 343 303 241 154 58 26 0
8417 8417 8402 8381 8360 8340 8269 8151 7936 7506 7096 0
0.000 0.000 0.002 0.004 0.007 0.009 0.018 0.032 0.057 0.108 0.157 1.000
0.000 0.008 0.066 0.146 0.228 0.315 0.395 0.519 0.693 0.884 0.948 1.000
0.000 0.000 0.000 0.000 0.001 0.003 0.006 0.013 0.035 0.043 0.799
n cases P>
(find)
# +ves a (find)
# −ves b n cases-a
Below p-cutoff
0 0 15 36 57 77 148 266 481 911 1321 8417
is of little use because the principal components are impossible to interpret (Table 5). A better approach is to eliminate variables from the equation, based on an iterative backwards removal process, according to their contribution to the final result as measured using a maximum-likelihood or Wald statistic. A model is first produced that incorporates all available variables; those that are least useful as predictors are then removed and a new model is produced. The procedure is continued until only those variables that explain a substantial proportion of the variance remain. The minimum © Blackwell Science Ltd 2000, Journal of Biogeography, 27, 441–455
0.915 0.000 0.000 0.000 0.000 0.000 0.000 0.001 0.002 0.005 0.002 0.022 0.932
number of variables to include is largely dependent on the objectives of the study. If biological inferences are to be drawn, reduction in the number of variables makes trends clearer and produces a more interpretable model. If accurate prediction is the primary objective, then the inclusion of more variables may produce an empirically more accurate model (despite the associated statistical problems). I have illustrated the methods using an inclusive model, and then demonstrate how this model can be simplified to offer additional interpretability.
JBI408.fm Page 446 Thursday, July 27, 2000 3:22 PM
446 Graeme S. Cumming
Table 5 The first five principal components extracted from climatic variables south of 8 degrees S. Component Variable
1
2
3
4
5
Maxt01 Maxt02 Maxt03 Maxt04 Maxt05 Maxt06 Maxt07 Maxt08 Maxt09 Maxt10 Maxt11 Maxt12 Mint01 Mint02 Mint03 Mint04 Mint05 Mint06 Mint07 Mint08 Mint09 Mint10 Mint11 Mint12 Rfall01 Rfall02 Rfall03 Rfall04 Rfall05 Rfall06 Rfall07 Rfall08 Rfall09 Rfall10 Rfall11 Rfall12
0.281907 0.374849 0.628439 0.894834 0.943607 0.932284 0.917368 0.889325 0.838456 0.800283 0.709943 0.441435 0.824932 0.855446 0.930926 0.930504 0.842531 0.795001 0.804424 0.857808 0.941775 0.966444 0.951753 0.913701 0.615073 0.635765 0.543083 0.402301 0.044398 − 0.07119 − 0.17548 − 0.19797 − 0.06334 0.044974 0.319598 0.550273
− 0.84517 − 0.80458 − 0.68757 − 0.33249 − 0.0043 0.160046 0.172465 0.029519 − 0.14787 − 0.36652 − 0.62671 − 0.81637 − 0.42604 − 0.34834 − 0.14241 0.148447 0.318336 0.344609 0.357759 0.351227 0.228661 0.006144 − 0.11869 − 0.27913 0.531912 0.531298 0.706515 0.627458 0.374059 0.061229 0.091125 0.304158 0.538792 0.632676 0.730986 0.648336
0.222374 0.253636 0.132212 − 0.07194 − 0.14677 − 0.13545 − 0.18993 − 0.28596 − 0.37846 − 0.31207 − 0.07149 0.153892 0.250354 0.279983 0.224168 0.179536 0.256119 0.292892 0.281926 0.202376 0.054888 − 0.02038 0.044603 0.145999 − 0.22639 − 0.20657 − 0.09432 0.213471 0.776186 0.873129 0.847044 0.78768 0.325335 − 0.01439 − 0.22953 − 0.27099
0.333944 0.321154 0.294637 0.22143 0.208764 0.157052 0.210814 0.307988 0.283651 0.18876 0.142705 0.258002 − 0.12754 − 0.13915 − 0.17398 − 0.22916 − 0.26807 − 0.32863 − 0.30565 − 0.23315 − 0.16754 − 0.14873 − 0.18099 − 0.13518 − 0.062 − 0.06873 0.057287 0.153771 0.121331 0.044581 0.094106 0.361835 0.654829 0.685972 0.493676 0.081289
− 0.00046 − 0.02105 − 0.0333 0.001007 − 0.06379 − 0.11519 − 0.08351 0.015628 0.142828 0.253232 0.186088 0.057507 − 0.03505 − 0.05132 − 0.0942 − 0.12604 − 0.17169 − 0.14893 − 0.14433 − 0.14396 − 0.08011 − 0.01322 0.013471 − 0.00964 0.495398 0.471424 0.142322 − 0.31193 − 0.01424 0.409288 0.403228 0.160817 − 0.25135 − 0.28193 0.008014 0.387818
RESULTS AND DISCUSSION Comparison of logistic regression and linear discriminant analysis Of the many available techniques for modelling habitat similarity, two of the most popular are discriminant analysis and logistic regression. Discriminant analysis may be linear, quadratic, or logistic, depending on the form of the discriminant function that is used (Everitt & Dunn, 1996). SPSS version 7.5 offers only the linear form, which is less powerful than the non-linear methods in addressing problems of this nature (cf. Williams, 1983; Rogers et al., 1996; Robinson et al., 1997). Results from discriminant analysis can be compared with those from logistic regression using ROC plots of the models for the same data; the better fit is provided by the model that yields the higher AUC value. To illustrate the quantitative comparison of models, the range of A. hebraeum was estimated using logistic regression
and linear discriminant analysis, respectively (Figs 4 and 5). Each of these maps was produced from the same data for thirty-six climatic variables (mean monthly minimum and maximum temperatures, and rainfall) at latitudes south of and including 8′S, and the presence records in Fig. 1. Manual ROC plots on each model (Table 4; Fig. 3) show that although performance is similar in this instance, the model using logistic regression is slightly better, yielding an AUC of 0.932 by comparison to the 0.915 from linear discriminant analysis. The apparently small difference in AUC values translates into a more obvious difference in the spatial extent of the probabilities associated with A. hebraeum occurrence by cell (Figs 4 and 5). Influence of sample size on model fit The output of a logistic regression is, like any other statistic, influenced by a number of variables. Particular consideration in habitat similarity models must be given to sample sizes. © Blackwell Science Ltd 2000, Journal of Biogeography, 27, 441–455
JBI408.fm Page 447 Thursday, July 27, 2000 3:22 PM
Figure 4 Results of a model produced using linear discriminant analysis on thirty-six climatic variables and all known presence records of A. hebraeum. Cells bordered in black are those originally scored as presences. The shading of each cell indicates the estimated probability of A. hebraeum occurrence within that cell.
Figure 5 Results of a model produced using logistic regression of thirty-six climatic variables and all known presence records of A. hebraeum. Cells bordered in black are those originally scored as presences. The shading of each cell indicates the estimated probability of A. hebraeum occurrence within that cell.
JBI408.fm Page 448 Thursday, July 27, 2000 3:22 PM
448 Graeme S. Cumming
Figure 6 Results of a logistic regression model using thirty-six climatic variables and assuming that all cells within the hypothetical range outline (dashed line) are positives. The range outline is set at 75 km from cells containing the original collection records, which are bordered in black.
The absolute and relative numbers of positive and negative records used may be of high importance for statistics that estimate the accuracy of the model, since logistic regression biases its result towards the larger data set (positives or negatives; cf. Fielding & Bell, 1997). To examine the influence of sample size on model fit, I use a hypothetical model in addition to the real A. hebraeum occurrence data. The area considered is defined initially as mainland Africa south of and including 8°S, a line that runs just to the north of the northern tip of Zambia. To produce a hypothetical approximation to the species range (Fig. 6), I included all points within 75 km of any known presence locality. The distance of 75 km was selected to include between two and three sampling units on the periphery of the range, since the width of a degree is approximately 120 km at the relevant latitude, and also because it is slightly further than the likely dispersal distances of adult ticks on large mammalian hosts (cf. Skinner & Smithers, 1990). This hypothetical range can be modelled closely using the set of thirty-six climatic variables (Fig. 6). I investigated the effect of the number of positives included by demarcating all sixteenth-degree cells in the hypothetical range as presences and assigning them value 1; all sixteenth-degree cells south of 8 degrees S and outside the
hypothetical range were demarcated absences and assigned value 0. In a series of steps, the values assigned to cells within the hypothetical range values were randomly converted from 1 to 0 (but not the inverse). After each set of conversions, a new logistic regression model was produced and successive AUCs were found. The results show clearly that the accuracy of the model decreases as the number of cells scored 1 decreases (Fig. 7). Larger sample sizes (the consideration of more positives or negatives) will produce a more reliable model. When more positive cases are added, the effects of outliers are reduced and the true relationships between occurrence and predictors of occurrence become clearer. The addition of more negative cases, as occurs when a larger area is considered, moves most statistics towards significance and dilutes the effects of changes in the number of positive cases (Fig. 7). The prediction that a species can not occur in a given area is as valid as the prediction that it can; neither effect is necessarily a problem, provided that it is recognized as statistical rather than biological and hence does not lead to the inaccurate acceptance or rejection of hypotheses. The use of a more stringent null model, outlined below, is one possible answer to the problem of distinguishing genuine correlation from statistical artefact. © Blackwell Science Ltd 2000, Journal of Biogeography, 27, 441–455
JBI408.fm Page 449 Thursday, July 27, 2000 3:22 PM
Fine-tuning linear models 449
Figure 7 Plots of AUC against number of positives for logistic regression models of the hypothetical range of A. hebraeum (Figure 5) using (∆) only climatic data south of 8 degrees south and (•) climatic data covering the whole of Africa. Points were randomly removed from within the range and successive models fitted to show the effects of decreasing the number of positive cases included in the model, while keeping total sample size constant.
Problems may arise when the number of either positive or negative records is relatively small by comparison to the total number of cases. Although the fit of the model decreases with decreasing numbers of positives, at very low numbers of positives the fit may actually improve as the variation in the positive localities is more easily partitioned amongst the predictor variables. Based on a quadratic curve fitted to the plot of AUC data against sample size (Fig. 8; hereafter called the AUC-sample size curve), the minimum AUC for a range of sample sizes was approximately 0.86, with n = 300 positive records (Fig. 8). The minimum sample size needed to produce a reliable habitat similarity model for A. hebraeum from these data is thus around 300 positive records. Models where the number of positive cases is proportionally small relative to the number of negatives should be tested following the same procedure of random conversion of positive cases to
Figure 8 Quadratic regression curve fitted to the AUC-sample size plot for the hypothetical range of A. hebraeum estimated using logistic regression on climate data south of 8 degrees south. The minimum in this curve indicates the point at which the results of the model become unreliable. The minimum sample size in this instance is just over 300.
negatives, to make sure that the data fall on the correct side of the minimum (Table 6). Hypotheses of correlation The most widely used null hypothesis in distribution models is that the species distribution is random with respect to a particular variable over the entire domain. Using ROC plots, random data will produce an AUC of 0.5 (Fielding & Bell, 1997). The weakness of this approach is that in a complex situation there remains a high chance of detecting correlation that is spurious. To illustrate this point, the models presented previously for A. hebraeum show that its distribution is non-random with
Table 6 Outline of methodology used to estimate the minimum number of positive records needed for habitat similarity modelling. Steps to estimate minimum number of positives 1. 2. 3. 4. 5. 6. 7. 8. 9.
Assemble available collection records. Determine how broad an area habitat similarity is to be estimated across –, i.e. define a domain. Obtain habitat variables (at suitable resolution) for the entire domain. Use all available information to make a first guess at the species range; known presences, expert opinion, and common sense. Start with the assumption that all cells inside the estimated range are positives and produce a first model using all records and all predictor variables. Do a ROC plot of the first model and find its AUC. Repeat the fitting process, each time randomly eliminating more and more variables and finding successive AUC values, until the number of positives is less than the number of variables considered. Plot the number of positives included in each model on the x-axis against their corresponding AUC values on the y-axis. Fit a quadratic regression and find the x-value at its minimum—this is a rough guide to the minimum number of positive localities needed for a reliable model.
© Blackwell Science Ltd 2000, Journal of Biogeography, 27, 441–455
JBI408.fm Page 450 Thursday, July 27, 2000 3:22 PM
450 Graeme S. Cumming
Table 7 Coefficients for different climatic variables used to estimate the range of A. hebraeum, sorted in descending order. B, beta coefficient; S.E., standard error of beta; Wald, Wald statistic. The mean and SD (Standard deviation) columns refer to the unstandardized values for variables (temperature in tenths of a degree Celsius, rainfall in cm) across Africa. Mint, mean minimum temperature; Maxt, mean maximum temperature; Rfall, mean rainfall; the numbers following variable names refer to months (01 = January, 12 = December). Data for a given point can be used to produce a probability estimate of occurrence (P) by subtracting the mean value and dividing by the standard deviation for each variable, and then entering the standardized values into the linear equation which has form B1variable1 + B2variable2 + … + B36variable36 = ?; P(y=1) = exp(?)/(1 + exp(?) ). Variable
B
SE
Wald
Mean
Maxt01 Rfall04 Mint09 Mint11 Rfall05 Maxt02 Maxt11 Mint07 Maxt05 Maxt08 Rfall09 Rfall07 Mint04 Mint01 Mint06 Mint08 Constant Maxt07 Rfall06 Mint02 Rfall08 Mint05 Rfall03 Maxt12 Mint10 Rfall12 Maxt03 Maxt06 Mint03 Rfall10 Maxt10 Rfall02 Maxt09 Mint12 Rfall01 Maxt04 Rfall11
15.3309 − 6.1968 − 12.4816 10.0484 10.3096 − 11.3938 − 9.8584 19.4245 12.7217 13.1398 11.5412 − 17.8874 − 7.6837 − 13.2681 − 10.0316 10.8385 − 7.017 − 10.024 8.4429 9.0849 − 14.3904 − 8.6187 − 1.4745 5.7045 2.8884 1.4283 − 3.4622 − 5.5145 3.5925 − 1.4858 − 1.2838 − 0.4805 − 1.2913 − 1.5343 0.1676 − 0.5328 0.0998
2.1693 0.9677 2.06 1.683 1.7466 2.0293 1.8113 3.6005 2.7555 3.0248 2.7381 4.2648 1.9055 3.3737 2.5908 2.9236 1.9333 3.101 2.8043 3.1011 4.967 2.9927 0.5587 2.1665 1.3875 0.697 1.7354 3.0733 2.5791 1.2722 1.3252 0.6763 1.8687 2.8506 0.6906 2.3517 0.8324
49.9472 41.0104 36.7131 35.6486 34.8411 31.525 29.6244 29.1056 21.3157 18.871 17.7671 17.5909 16.2602 15.4665 14.9925 13.7439 13.1738 10.449 9.0642 8.5825 8.3938 8.2941 6.9649 6.9328 4.3337 4.1986 3.9801 3.2197 1.9402 1.364 0.9385 0.5049 0.4775 0.2897 0.0589 0.0513 0.0144
276.9454 53.51785 186.4316 160.5743 44.26318 291.7364 296.9666 180.2717 324.0305 318.3134 60.26905 53.05267 175.195 137.2182 179.906 184.1776
56.73901 66.1111 46.63138 39.42672 61.7174 52.53551 41.82671 69.43028 59.33277 59.97644 89.72863 85.79285 44.73032 56.90436 67.80617 61.00429
317.709 40.25599 148.1532 67.21328 180.3885 58.25847 278.386 179.7508 50.44088 306.4419 322.8177 164.1641 53.27505 317.1115 48.38243 322.422 141.1432 48.94537 318.8118 49.95016
69.83381 68.71006 52.3419 101.0566 55.07148 73.12966 52.61227 35.80358 73.12197 49.63192 69.16904 46.36146 74.48739 39.17979 67.4113 47.35392 52.10711 73.5667 51.52596 67.702
respect to mean monthly temperature and mean monthly rainfall. Despite this correlation, it is possible that the species range is determined by some other factor; for example, by the presence or absence of suitable host species, the use of pesticides, or some geographical barrier that limits its spread. A definitive statement about cause is probably not possible at this scale of analysis, unless every possible limiting variable is considered. In this context, the interpretation of a non-random correlation as being of biological significance is a weak one. The south-eastern portion of Africa is climatically distinct; if the whole of Africa is considered, virtually any discrete area
SD
within the region will appear non-randomly correlated with climatic variables. Non-randomness over the whole of Africa is not a strong criterion on which to accept the hypothesis that the distribution of A. hebraeum is correlated with climatic factors. A better test of whether or not A. hebraeum has a distribution that is significantly correlated with climatic factors is to use a more rigorous null hypothesis: that A. hebraeum is randomly distributed within the discrete, broad-scale limits of its known range as defined by an estimate of its potential dispersal distance away from its current habitat, here taken © Blackwell Science Ltd 2000, Journal of Biogeography, 27, 441–455
JBI408.fm Page 451 Thursday, July 27, 2000 3:22 PM
Fine-tuning linear models 451
Table 8 Coefficients (B) with their associated standard errors (SE) and Wald statistics for a simplified logistic regression model using fourteen variables selected by stepwise backwards elimination. Further details in text.
Figure 9 Comparison of the effects of randomly removing positive records from (•) the real data for A. hebraeum and (u) the hypothetical data. The real data fall above and outside the 95% confidence limits for the null model (drawn on Figure 8), supporting the idea that there is a genuine correlation between climatic factors and A. hebraeum occurrence.
as 75 km. This hypothesis differs from the standard approach only in that it more rigorously defines the appropriate scale at which to reject the notion of randomness in a species distribution. The assumption is also made that the hypothetical range exhibits heterogeneity, with not all areas being equally suitable for the tick. The null model assumes as a starting point that every cell within the hypothetical range is inhabited. Modelling of this range produces, as expected, a non-random model with respect to climate (Fig. 6). Sequential 1–0 conversion of positive records in a random fashion and calculation of the AUC for each number of positives gives a series of points to which a quadratic AUC-sample size curve can be fitted. The same procedure of sequential removal is then followed using the actual collection localities (Fig. 9). These localities should be non-random by comparison to the null model. In other words, if the hypothesis of correlation with climatic factors is to be accepted, the sequential removal of genuine positive records should produce a series of points akin to those from the null model but that fit the data significantly better (i.e. fall above the 95% confidence limits for the AUC-sample size curve, based on a quadratic equation, for the null model). This result is predicted because if the species range is truly determined by climate, localities from which the species has been collected should be more similar than a random selection of localities within the same basic area. Because the results become erratic below a certain minimum sample size, only the points to the right hand side of the minimum should be considered in the comparison. Even if comparison to the stronger null hypothesis suggests that there is a correlation between climatic factors and species occurrence, there remains a chance that the correlation is spurious. If there is no difference between the null model and the actual one, however, then the correlation © Blackwell Science Ltd 2000, Journal of Biogeography, 27, 441–455
Variable
B
SE
Wald
Rfall04 Mint11 Maxt08 Maxt11 Mint09 Maxt01 Rfall05 Rfall09 Mint04 Maxt02 Rfall08 Mint08 Mint06 Mint07 Constant
− 9.2594 11.5878 7.606 − 7.4239 − 13.4323 15.893 11.2767 12.9123 − 10.8609 − 11.6442 − 22.4508 15.3499 − 12.1205 13.7696 − 5.1821
0.5446 0.76 0.6274 0.6448 1.1788 1.4343 1.0592 1.2479 1.2086 1.4005 3.0432 2.2719 1.8056 2.7531 1.4489
289.0491 232.4791 146.9512 132.5593 129.8488 122.7836 113.3562 107.0634 80.7482 69.1261 54.4247 45.6493 45.0586 25.0155 12.7921
can be disregarded unless there is an alternative explanation for the lack of difference (such as high habitat homogeneity). The reduction in total area under consideration provides a more rigorous basis for rejecting the null hypothesis of randomness in the species distribution. Reduction of variable number Applying stepwise removal to a logistic regression model of thirty-six climatic variables, the data can be reduced to fourteen variables of high predictive ability (Table 8). The AUC for this model is 0.942 compared to the AUC of 0.947 for all thirty-six variables, showing that there is little loss of accuracy as a consequence of removing the twenty-two least useful variables. Can even fewer variables be used without a great loss of accuracy? Some variables may not limit the tick’s range monotonically. For example, both low and high maximum temperatures could be detrimental, with the mean temperature being optimum. Agresti (1996) suggests that if variables are not monotonically related, one approach is to use their squares as independent variables. With a data set that is standardized around zero this will make extreme values positive while the means remain low, thus transforming the data to fit the logistic model better. To see if squares of variables performed better than the untransformed variables, I included the variables and their squares in a logistic model and performed the same backwards elimination procedure. The effects of variable removal on model accuracy are shown in Fig. 10. A basic set of seven variables including two squared values will give an AUC of 0.928; it appears that a model using only seven variables can approach the statistical accuracy of one using thirty-six variables (Table 9). From the Wald values associated with each variable, it appears that the key factors
JBI408.fm Page 452 Thursday, July 27, 2000 3:22 PM
452 Graeme S. Cumming
Figure 10 Plot showing the decrease in model accuracy as the number of variables in a logistic regression model for A. hebraeum is reduced using a backwards stepwise removal procedure. Accuracy is measured by the taking Area Under the Curve (AUC) of successive threshold Receiver Operating Characteristic (ROC) plots after each step. The variables used were mean monthly minimum temperature, maximum temperature and rainfall, and their squares; from the initial seventy-two variables, an acceptable model can be obtained using the best seven.
Table 9 Coefficients (B) with their associated standard errors (SE) and Wald statistics for a simplified logistic regression model using seven variables selected by stepwise backwards elimination. This model included the squares of variables as options for the selection algorithm. Further details in text. Variable
B
SE
Wald
Rfall092 Rfall04 Mint11 Maxt01 Maxt02 Mint032 Constant Rfall11
− 21.4799 − 8.4116 2.3106 14.0422 − 14.2131 − 2.2212 − 2.5937 1.1062
0.8204 0.5225 0.1464 1.0959 1.1238 0.2223 0.3705 0.2071
685.5895 259.1262 248.9437 164.1871 159.9438 99.861 49.0044 28.523
determining where A. hebraeum is found are April rainfall and the covariance between temperature and rainfall around the period from September to February, which is typically the hottest and wettest half of year.
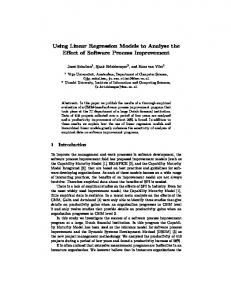
Figure 11 Plots comparing the mean values for mean monthly maximum temperature (a), mean monthly minimum temperature (b) and mean monthly rainfall (c) at positive collection localities (empty circles) to the rest of the points south of 8 degrees S (filled circles). There is no significant difference between the means in any instance (single factor anova on the whole data set; F = 0.153; P < 0.697). Positive collection localities are represented as blackbordered cells on Figure 1.
Possible importance of within-site variation The mean values of the climatic variables at collection sites of A. hebraeum are not significantly different from the rest of the data (Fig. 11; single factor anova between-groups F = 0.153; P < 0.7). Given this result, it seemed possible that what may be important for A. hebraeum is variability within rather than between areas. An area of occurrence may have an apparently harsh mean set of conditions, for example, but should not evidence vast fluctuations around this mean.
To test this idea I took the mean difference between the minimum and maximum values for each continuous variable across the range of A. hebraeum. I then randomly extracted the same number of observations (n = 501) twenty times from the data south of 8°S and calculated a mean and standard deviation of the difference between the minimum and maximum values derived from each of these data sets. Comparison of the randomly derived data to actual occurrences of A. hebraeum © Blackwell Science Ltd 2000, Journal of Biogeography, 27, 441–455
JBI408.fm Page 453 Thursday, July 27, 2000 3:22 PM
Fine-tuning linear models 453
to the beta coefficient for the same variable did not show a significant correlation. CONCLUSIONS Linear models of species ranges are potentially valuable tools in a variety of broad-scale contexts, allowing biologists to develop current and predictive probability maps of species occurrence. Unfortunately, many of the statistics associated with such models are dependent on a set of what are often arbitrary decisions about the number of positive records to include, the sample area to consider and the working resolution of the study. These decisions can be taken more objectively by using the AUC statistic from ROC plots to compare the behaviour of the model across a range of different scenarios. Understanding where the results of a particular model fit into the range of possible outcomes should lead to more accurate hypothesis-testing and improved accuracy in linear modelling. The interpretation of linear models is made simpler by reducing the number of variables in the model to a manageable number. Although the Wald values associated with the coefficients for each variable in the equation offer some indication of the variable’s importance in determining the distribution of the study species, for these data I found that within-site variation was significantly lower in areas where the species was found and that there was no significant correlation between this variation and the coefficient associated with each variable. These results imply that interpretation of the weightings of individual variables in complex models must be undertaken with some caution. If broad-scale linear models are to be reliable as predictors, they must incorporate a thorough understanding of the biology of the processes under consideration and should be supported by the results of studies at smaller scales (Buckland et al., 1996; Rogers et al., 1996; Randolph & Rogers, 1997). ACKNOWLEDGMENTS Figure 12 Plots comparing the variability in each of mean monthly maximum temperature (a), mean monthly minimum temperature (b) and mean monthly rainfall (c) from positive collection localities (empty circles) to an equivalent number of randomly selected points south of 8 degrees S (filled circles). Variability was measured by subtracting the greatest value from the smallest value for each variable in the given set of 501 localities. The random selection procedure was repeated twenty times to produce a mean (filled circles); the dotted lines indicated the standard deviation above and below this mean. The positive localities show significantly lower variability (single factor anova on the whole data set; F = 17.32; P < 0.00008). Positive collection localities are represented as black-bordered cells on Figure 1.
shows that the sites at which the tick occurs show significantly less variability than is expected within the same region (single factor anova F = 17.3, P < 0.0005; Fig. 12). Despite the high significance of the result, tests comparing variability © Blackwell Science Ltd 2000, Journal of Biogeography, 27, 441–455
I am grateful to Dr David Rogers for several useful discussions about statistical methods, to Drs Sarah Randolph, David Rogers and two anonymous referees for their comments on an earlier draft of this manuscript, and to the Rhodes trust for funding. REFERENCES Agresti, A. (1996) An introduction to categorical data analysis. John Wiley & Sons, New York. Augustin, N. H., Mugglestone, M. A. & Buckland, S. T. (1996) An autologistic model for the spatial distribution of wildlife. Journal of Applied Ecology, 33, 339–347. Austin, G. E., Thomas, C. J., Houston, D. C. & Thompson, D. B. A. (1996) Predicting the spatial distribution of buzzard Buteo buteo nesting areas using a geographical information system and remote sensing. Journal of Applied Ecology, 33, 1541– 1550. Bedford, G. A. H. (1932) ‘A synoptic check-list and host-list of the ectoparasites found on South African Mammalia, Aves,
JBI408.fm Page 454 Thursday, July 27, 2000 3:22 PM
454 Graeme S. Cumming
and Reptilia (2nd edn).’ 18th Report to the Director of Veterinary Services and Animal Industry, pp. 223–523. Berry, M. E. & Bock, C. E. (1998) Effects of habitat and landscape characteristics on avian breeding distributions in Colorado foothill sshrub. Southwestern Naturalist, 43, 453– 461. Buckland, S. T., Elston, D. A. & Beaney, S. J. (1996) Predicting distributional change, with application to bird distributions in northeast Scotland. Global Ecology and Biogeography Letters, 5, 66–84. Cumming, G. S. (1999) The evolutionary ecology of African ticks. Doctoral Thesis, University of Oxford. Duchateau, L., Kruska, R. L. & Perry, B. D. (1997) Reducing a spatial database to its effective dimensionality for logisticregression analysis of incidence of livestock disease. Preventive Veterinary Medicine, 32, 207–218. Everitt, B. S. & Dunn, G. (1996) Applied multivariate data analysis. Arnold, London. Fielding, A. H. & Bell, J. F. (1997) A review of methods for the assessment of prediction errors in conservation presence/ absence models. Environmental Conservation, 24, 38– 49. Gallivan, G. J. & Surgeoner, G. A. (1995) Ixodid ticks and other ectoparasites of wild ungulates in Swaziland: regional, host and seasonal patterns. South African Journal of Zoology, 30, 169–177. Goodwin, P. & Wright, G. (1991) Decision analysis for management judgement. John Wiley and Sons, New York. Guisan, A., Weiss, S. B. & Weiss, A. D. (1999) GLM versus CCA spatial modelling of plant species distribution. Plant Ecology, 143, 107–122. Haila, Y., Nicholls, A. O., Hanski, I. K. & Ravio, S. (1996) Stochasticity in bird habitat selection: year-to-year changes in territory locations in a boreal forest bird assemblage. Oikos, 76, 536–552. Horak, I. G., De Vos, V. & Brown, M. R. (1983) Parasites of domestic and wild animals in South Africa. XVI. Helminth and arthropod parasites of blue and black wildebeeste (Connochaetes taurinus and Connochaetes gnu). Onderstepoort Journal of Veterinary Research, 50, 243–255. Horak, I. G., De Vos, V. & De Klerk, B. D. (1984) Parasites of domestic and wild animals in South Africa. XVII. Arthropod parasites of Burchell’s zebra, Equus burchelli, in the eastern Transvaal lowveld. Onderstepoort Journal of Veterinary Research, 51, 145–154. Horak, I. G., Knight, M. M. & Williams, E. J. (1991) Parasites of domestic and wild animals in South Africa. XXVIII. Helminth and arthropod parasites of angora goats and kids in valley bushveld. Onderstepoort Journal of Veterinary Research, 58, 253–260. Horak, I. G., Potgeiter, F. T., Walker, J. B., De Vos, V. & Boomker, J. (1983) The ixodid tick burdens of various large ruminant species in South African nature reserves. Onderstepoort Journal of Veterinary Science, 50, 221–228. Hutchinson, M. F., Nix, H. A., MacMahon, J. P. & Ord, K. D. (1996) A topographic and climatic database for Africa— Version 1.1. Australian National University, Canberra. Keirans, J. E. (1985) George Henry Falkiner Nuttall and the Nuttall Tick catalogue. United States Department of Agriculture, Agricultural Research Service Miscellaneous Publication, 1438, 1785 pp. Legendre, P. (1993) Spatial autocorrelation: trouble or new paradigm? Ecology, 74, 1615–1673.
Lindenmayer, D. B., Cunningham, R. B. & McCarthy, M. A. (1999) The conservation of arboreal marsupials in the montane ash forests of the central highlands of victoria, south-eastern Australia. VIII. Landscape analysis of the occurrence of arboreal marsupials. Biological Conservation, 89, 83–92. Macleod, J. (1970) Tick infestation patterns in the southern province of Zambia. Bulletin of Entomological Research, 60, 253–274. Minshull, J. I. (1981) Seasonal occurrence, habitat distribution and host range of four ixodid tick species at Kyle recreational park in south eastern Zimbabwe. Zimbabwe Veterinary Journal, 12, 58–63. Morel, P. C. (1969) Contribution à la conaissance de la distribution de tiques (Acariens, Ixodidae et Amblyommidae) en Afrique Ethiopienne Continentale. Institut d’Elevage et de Medecine Vétérinaire des Pays Tropicaux, Paris. North, M. P. & Reynolds, J. H. (1996) Microhabitat analysis using radiotelemetry locations and polytomous logistic regression. Journal of Wildlife Management, 60, 639–653. Norval, R. A. I. (1977) Ecology of the tick Amblyomma hebraeum Koch in the Eastern Cape Province of South Africa. I. Distribution and seasonal activity. Journal of Parasitology, 63, 734 –739. Norval, R. A. I. (1983) The ticks of Zimbabwe. VII. The genus Amblyomma. Zimbabwe Veterinary Journal, 14, 3–18. Osborne, P. E. & Tigar, B. J. (1992) Interpreting bird atlas data using logistic models: an example from Lesotho, Southern Africa. Journal of Applied Ecology, 29, 55–62. Paine, G. D. (1982) Ticks (Acari: Ixodoidea) in Botswana. Bulletin of Entomological Research, 72, 1–16. Randolph, S. E. & Rogers, D. J. (1997) A generic population model for the African tick Rhipicephalus appendiculatus. Parasitology, 115, 265–279. Robinson, T., Rogers, D. J. & Williams, B. (1997) Mapping tsetse suitability in the common fly belt of Souther Africa using multivariate analysis of climate and remotely sensed data. Medical and Veterinary Entomology, 11, 235–245. Rogers, D. J., Hay, S. I. & Packer, M. J. (1996) Predicting the distribution of tsetse flies in West Africa using temporal Fourier processed meteorological satellite data. Annals of Tropical Medicine and Parasitology, 90, 225–241. Santos Dias, J. A. T. (1952) Lista das carraças de Moçambique e respectivos hospedeiros (II). Anals Dos Serviços de Veterinaria e Indústria Animal, 4, 121–166. Skinner, J. D. & Smithers, R. N. (1990) The mammals of Southern Africa. University of Pretoria, Pretoria. Tandon, S. K. (1991) The ixodid ticks of Zambia (Acarina: Ixodidae). A study of distribution, ecology and host relationships. Records of the Zoological Survey of India, Occasional Paper, 134, 1–175. Theiler, G. (1948) Zoological Survey of the Union of South Africa. Tick Survey—Part I. General Introduction and distribution of Amblyomma hebraeum, the heartwater tick. Onderstepoort Journal of Veterinary Science and Animal Industry, 23, 217–231. Theiler, G. (1962) ‘The Ixodoidea parasites of vertebrates in Africa south of the Sahara (Ethiopian region).’ Report to the Director of Veterinary Services, Onderstepoort, Project S. 9958, 260 pp. Venier, L. A., Hopkin, A. A., McKenney, D. W. & Wang, Y. (1998) A spatial, climate-determined risk rating for Scleroderris © Blackwell Science Ltd 2000, Journal of Biogeography, 27, 441–455
JBI408.fm Page 455 Thursday, July 27, 2000 3:22 PM
Fine-tuning linear models 455
disease of pines in Ontario. Canadian Journal of Forest Research, 28, 1398–1404. Walker, J. B., Mehlitz, D. & Jones, G. E. (1978) Notes on the ticks of Botswana. German Agency for Technical Cooperation, Eschborn. Williams, B. K. (1983) Some observations on the use of discriminant analysis in ecology. Ecology, 64, 1283–1291. Wiser, S. K., Peet, R. K. & White, P. S. (1998) Prediction of rare plant occurrence: a southern appalachian example. Ecological Applications, 8, 909–920. Yeoman, G. H. & Walker, J. B. (1967) The ixodid ticks of Tanzania. A Study of the zoogeography of the Ixodidae of an East African country. Commonwealth Institute of Entomology, Eastern Press, London and Reading. Zumpt, F. (1958) A preliminary survey of the distribution and host-specificity of ticks (Ixodoidea) in the Bechuanaland protectorate. Bulletin of Entomological Research, 49, 201–223.
© Blackwell Science Ltd 2000, Journal of Biogeography, 27, 441–455
BIOSKETCH
Graeme Cumming is currently a D. H. Smith postdoctoral fellow at the University of Wisconsin in Madison’s Center for Limnology, where he is working with the Nature Conservancy and Professor Steve Carpenter on applying species-based models to management and conservationrelated problems in freshwater systems. Graeme was awarded his undergraduate degree by Rhodes University in South Africa, and recently completed his doctorate, titled ‘The Evolutionary Ecology of African Ticks’, while on a Rhodes Scholarship at Oxford University in England. He has previously published papers on bats, effects of elephant on biodiversity, and ticks.