the electric power and industrial sectors will increase significantly until 2050. Because fossil fuel-fired power plants are responsible for around one-third of total.
ISSN 1923-8460[PRINT] ISSN 1923-8479[ONLINE] www.cscanada.net www.cscanada.org
Energy Science and Technology
Vol. 5, No. 1, 2013, pp. 26-32 DOI:10.3968/j.est.1923847920130501.708
Using Carbon Capture and Storage CCS Techniques in Mulla Abdulla and Taza Power Plants to Mitigate the Impact of Climate Change
Sameer S. Mustafa[a],*; Fawzi M. Omar[a]; Bilal A. Nasir[a] [a] Kirkuk technical college, Iraq Kirkuk technical college, Iraq Hawija Technical Institute, Iraq. * Corresponding author
Received 4 January 2013; accepted 25 February 2013
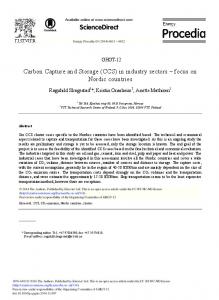
Abstract
In the IPCC Intergovernmental Panel on Climate Change Special Report on Emission Scenarios (SRES), it was projected that the number of CO2 emission sources from the electric power and industrial sectors will increase significantly until 2050. Because fossil fuel-fired power plants are responsible for around one-third of total global CO2 emissions, they are prime candidates for the application of CO2 capture and storage techniques. The aim of this work is to mitigate the impact of climate change by reducing the amount of CO2 emitted to the atmosphere in Mulla Abdulla and Taza power plants in Kirkuk/ Iraq using CCS techniques, and to calculate the cost of the system components. Key Words: CCS; Climate change; Mitigation Mustafa, S. S., Omar, F. M., & Nasir, B. A. (2013). Using Carbon Capture and Storage CCS Techniques in Mulla Abdulla and Taza Power Plants to Mitigate the Impact of Climate Change. Energy Science and Technology, 5(1), 26-32. Available from: URL: http://www.cscanada. net/index.php/est/article/view/10.3968/j.est.1923847920130501.708 DOI: http://dx.doi.org/10.3968/j.est.1923847920130501.708
INTRODUCTION Fossil fuel-fired power plants are responsible for producing a large percentage of the electricity that is currently being generated around the world. Demand for that electricity is increasing fast, in both the developed and developing countries. In many parts of the world, steadily growing demand for electricity is heightening the need for additional capacity. Fossil fuels will continue to play a crucial role in the development of many national
Copyright © Canadian Research & Development Center of Sciences and Cultures
26
economies well into the future. The fossil fuels currently supplying the major part of the world’s energy needs will remain in abundant supply well into the 21st century. It is therefore clear that fossil fuel resource constraints will not be the driver of emissions reductions in the foreseeable future. Indeed, if concerted action is not taken, atmospheric levels of CO2 will continue to increase. This will remain the case, in spite of anticipated cost increases, as the cheapest oil and gas reserves are depleted and transport distances increase for obtaining new supplies. Global electricity demand is rising, particularly in the developing world, where population and economic growth are greater than in developed countries and where the rate of migration from rural to urban areas is significantly higher. Developing and developed countries alike can be expected to continue using their abundant coal reserves. Continued fossil fuel use in a CO2 emissions-constrained world will call for more efficient fossil-fuel combustion technology, CO 2 capture and storage, and switching among fossil fuels. In a future “Hydrogen Economy”, control of CO2 will be needed as well because hydrogen will be produced mainly from fossil fuels. The capture of CO2 from commercial and industrial operations, followed by its storage in geological formations, is viewed as an important strategy for achieving substantial reductions in emissions levels. Widespread deployment of CO 2 capture and storage technologies will depend, however, on the widespread introduction of appropriate mandatory standards or mechanisms for pricing CO2 emissions. Numerous technology solutions offer substantial CO2-reductions potential, including renewable energies, fossil-fuel use with CO 2 capture and storage, nuclear fission, fusion energy, hydrogen, biofuels, fuel cells and efficient energy end use. No single technology can meet this challenge by itself. Different regions and countries will require different combinations of technologies to best serve their needs and best exploit their indigenous
Using Carbon Capture and Storage CCS Techniques in Mulla Abdulla and Taza Power Plants to Mitigate the Impact of Climate Change
resources. The energy systems of tomorrow will rely on a mix of different advanced, clean, efficient technologies for energy supply and use (Wikipedia, 2008; IEA, 2008; IPCC, 2005; Dooley et al., 2005; Chmalensee et al., 1995; Dooley & Dahowski, 2006). Appendix (A) is a part of the list of countries (1-44) of 213 by carbon dioxide emissions due to human activity. The data presented below corresponds to emissions in 2007. The data were collected by the CDIAC (Carbon Dioxide Information Analysis Centre) for the United Nations. The data consider only carbon dioxide emissions
from the burning of fossil fuels and cement manufacture. The top 10 countries in the world emit 67.07% of the world total. Other powerful greenhouse gases are not included in this data, including methane. Iraq is ranked as the 37th in the list. CCS, Carbon Capture and Storage involves the use of technology, first to collect and concentrate the CO2 produced in industrial and energy related sources, transports it to a suitable storage location, and then stores it away from the atmosphere for a long period of time as shown in figure 1 (IPCC, 2005).
Figure 1 The Three Main Components of the CCS Process: Capture, Transport and Storage
1. THE MAIN APPROACHES TO CAPTURING THE CO2
Figure 2 Overviews of CO2 Capture Processes and Systems
Copyright © Canadian Research & Development Center of Sciences and Cultures
27
Depending on the process or power plant application as shown in figure 2, there are three main approaches to capturing the CO2 generated from a primary fossil fuel (coal, natural gas or oil), biomass, or mixtures of these fuels:
Using Carbon Capture and Storage CCS Techniques in Mulla Abdulla and Taza Power Plants to Mitigate the Impact of Climate Change
(1) Post-Combustion systems separate CO2 from the flue gases produced by the combustion of the primary fuel in air. These systems normally use a liquid solvent to capture the small fraction of CO2 (typically 3–15% by volume) present in a flue gas stream in which the main constituent is nitrogen (from air). For a modern pulverized coal (PC) power plant or a natural gas combined cycle (NGCC) power plant, current post-combustion capture systems would typically employ an organic solvent such as mono ethanolamine (MEA). (2) Pre-combustion systems process the primary fuel in a reactor with steam and air or oxygen to produce a mixture consisting mainly of carbon monoxide and hydrogen (“synthesis gas”). Additional hydrogen, together with CO2, is produced by reacting the carbon monoxide with steam in a second reactor (a “shift reactor”). The resulting mixture of hydrogen and CO 2 can then be separated into a CO2 gas stream, and a stream of hydrogen. If the CO2 is stored, the hydrogen is a carbon-free energy carrier that can be combusted to generate power and/or heat. Although the initial fuel conversion steps are more elaborate and costly than in post-combustion systems, the high concentrations of CO2 produced by the shift reactor (typically 15 to 60% by volume on a dry basis) and the high pressures often encountered in these applications are more favourable for CO2 separation. Pre-combustion would be used at power plants that employ integrated gasification combined cycle (IGCC) technology. (3) Oxyfuel combustion systems use oxygen instead of air for combustion of the primary fuel to produce a flue gas that is mainly water vapour and CO2. This results in a flue gas with high CO2 concentrations (greater than 80% by volume). The water vapour is then removed by cooling and compressing the gas stream. Oxyfuel combustion requires the upstream separation of oxygen from air, with a purity of 95–99% oxygen assumed in most current designs. Further treatment of the flue gas may be needed to remove air pollutants and non condensed gases (such as nitrogen) from the flue gas before the CO2 is sent to storage. As a method of CO2 capture in boilers, oxyfuel combustion systems are in the demonstration phase. Oxyfuel systems are also being studied in gas turbine systems, but conceptual designs for such applications are still in the research phase. Figure 4 shows a schematic diagram of the main capture processes and systems. All
Copyright © Canadian Research & Development Center of Sciences and Cultures
28
require a step involving the separation of CO2, H2 or O2 from a bulk gas stream (such as flue gas, synthesis gas, air or raw natural gas). These separation steps can be accomplished by means of physical or chemical solvents, membranes, solid sorbents, or by cryogenic separation. The choice of a specific capture technology is determined largely by the process conditions under which it must operate. Current post-combustion and pre-combustion systems for power plants could capture 85–95% of the CO 2 that is produced. Higher capture efficiencies are possible, although separation devices become considerably larger, more energy intensive and more costly. Capture and compression need roughly 10–40% more energy than the equivalent plant without capture, depending on the type of system. Due to the associated CO2 emissions, the net amount of CO2 captured is approximately 80–90%. Oxyfuel combustion systems are, in principle, able to capture nearly all of the CO2 produced. However, the need for additional gas treatment systems to remove pollutants such as sulphur and nitrogen oxides lowers the level of CO2 captured to slightly more than 90% (IPCC, 2005; Parsons Brinckerhoff Ltd., 2009; Jordal et al., 2005).
2. TRANSPORT OF CO2 Except when plants are located directly above a geological storage site, captured CO 2 must be transported from the point of capture to a storage site. Pipelines today operate as a mature market technology and are the most common method for transporting CO2. Gaseous CO2 is typically compressed to a pressure above 8 Mpa (Parsons Brinckerhoff Ltd., 2009; Shuttleworth, 2009).
3. GEOLOGICAL STORAGE There are three types of geological formations that have received extensive consideration for the geological storage of CO2: oil and gas reservoirs, deep saline formations and unminable coal beds figures 3 and 4. In each case, geological storage of CO2 is accomplished by injecting it in dense form into a rock formation below the earth’s surface. Porous rock formations that hold or (as in the case of depleted oil and gas reservoirs) have previously held fluids, such as natural gas, oil or brines, are potential candidates for CO2 storage (Rubin et al., 2007; Stelmach & Wall, 2008).
Using Carbon Capture and Storage CCS Techniques in Mulla Abdulla and Taza Power Plants to Mitigate the Impact of Climate Change
Figur 3 Methods for Storing CO2 in Deep Underground Geological Formations
4. CALCULATING CO2 EMISSION To calculate the CO2 emission from a fuel the carbon content of the fuel must be multiplied with the ratio of molecular weight CO2 (44) to the molecular weight Carbon (12) = 44 / 12 = 3.7 Carbon Dioxide emission can be calculated as: qCO2 = cf / hf CCO2/Cm where qCO2 = specific CO2 emission (CO2 /kWh) cf = specific carbon content in the fuel (kgC/kg fuel) hf = specific energy content (kWh/kg fuel) Cm = specific mass Carbon (kg/mol Carbon) CCO2 = specific mass Carbon Dioxide (kg/mol CO2) Emissions of Carbon Dioxide - CO2 - when combustion some common fuels are indicated in table 1 (Shuttleworth, 2009; Rubin et al., 2007; Stelmach & Wall, 2008; IEA, 2003).
Figure 4 CO2 Storage per Type of Underground Reservoirs Table 1 CO2 Emission According to Fuel Type Fuel Coal (bituminous/ anthracite) Gasoline Light Oil Diesel LPG - Liquid Petroleum Gas Natural Gas, Methane Crude Oil Kerosene
Specific Carbon Content Specific Energy Content (kWh/kgfuel) (kgC/kgfuel)
Specific CO2 Emission (kgCO2 /kgfuel)
Specific CO2 Emission (kgCO2/kWh)
0.75
7.5
2.3
0.37
0.9 0.7 0.86
12.5 11.7 11.8
3.3 2.6 3.2
0.27 0.26 0.24
0.82
12.3
3.0
0.24
0.75
12
2.8
0.23 0.26 0.26
Copyright © Canadian Research & Development Center of Sciences and Cultures
29
Using Carbon Capture and Storage CCS Techniques in Mulla Abdulla and Taza Power Plants to Mitigate the Impact of Climate Change
5. ELECTRICAL POWER SYSTEM GENERATION IN IRAQ Electrical power system in Iraq consists of different types of power generating plants. Thermal steam, gas and hydro power plants. The majority of the existing power plants are thermal plants that use crude oil supported by gasfired and hydro plants. There are 32 steam units, 157 gas units and 37 hydro units. Average generation recorder in 2010 was: 3168 MW, 2220 MW and 942 MW for steam, gas and hydro power plants respectively. Generation percentage is shown in figure 5. According to CDIAC (Carbon Dioxide Information Analysis Centre) 2007 data, Iraq was ranked as the 37th country in CO2 emissions (Wikipedia, 2008). Our work is to collect and concentrate the CO 2 produced in Mulla Abdulla and Taza Electrical power plants in Kirkuk, transport it to a suitable storage location, and then store it away from the atmosphere for a long period of time.
6. CALCULATING CO 2 EMISSION FOR TAZA AND MOLLA ABDULLA POWER PLANTS Electrical power plants in Taza and Molla Abdulla use Natural Gas Fuel to generate electrical power. We use the relationship between CO2 emission and the type of fuel as shown in table 1 to calculate CO2 emission. The average electrical power production for Taza power plant = 5760000 KWh. / day. CO 2 emission from Taza power plant daily = 5760000×0.23 = 1324800 Kgm = 1324.8 tone CO2 / day = 483552 tone CO2 / year The average electrical power production for Molla Abdulla power plant = 3195000 KWh. / day. CO2 emission from Molla Abdulla power plant daily = 3195000×0.23 = 734850 Kgm = 734.85 tone CO2 / day = 268220 tone CO2 / year Total CO 2 emission from Taza and Molla Abdulla power plants= 483552 + 268220 = 751772 tone CO2 / year.
7. COST OF CCS SYSTEM FOR THIS PROJECT
Figure 5 Generation Percentage Data for Iraqi Electricity Sector
As was mentioned in table 2, in most CCS systems, the cost of capture including compression is the largest cost component (IPCC, 2005). Table 2 shows cost ranges for the components of a CCS system in 2002 as applied to a given type of power plant or industrial source. The costs in our case study in Molla Abdulla and Taza power plants as shown in tables 3 and 4 were calculated according to the cost ranges mentioned in table 2.
Table 2 Cost Ranges for the Components of a CCS System in 2002 as Applied to a Given Type of Power Plant or Industrial Source CCS system components Capture from a coal- or gas-fired power plant Capture from hydrogen and ammonia production or gas processing
15-75 US$/tCO2 net captured
Capture from other industrial sources
25-115 US$/tCO2 net captured
Transportation Geological storage Geological storage: monitoring and verification Ocean storage Mineral carbonation
Cost range
5-55 US$/tCO2 net captured
1-8 US$/tCO2 transported 0.5-8 US$/tCO2 net injected 0.1-0.3 US$/tCO2 net injected 5-30 US$/tCO2 net injected 50-100 US$/tCO2 net captured
Copyright © Canadian Research & Development Center of Sciences and Cultures
30
Remarks Net costs of captured CO2, compared to the same plant without capture. Applies to high-purity sources requiring simple drying and compression. Range reflects use of number of different technologies and fuels. Per 250 km pipeline or shipping for mass flow rates of 5 (high end) to 40 (low end) Mt CO2 yr-1 Excluding potential revenues from EOR or ECBM. This covers pre-injection, injection, and post-injection monitoring, and depends on the regulatory requirements. Including offshore transportation of 100-500 km, excluding monitoring and verification. Range for the best case studied, includes additional energy use for carbonation.
Using Carbon Capture and Storage CCS Techniques in Mulla Abdulla and Taza Power Plants to Mitigate the Impact of Climate Change
Table 3 Our Project Cost Ranges for the Components of a CCS NO.
CSS system components
Annual Cost range( Million Dollar)
1
Capture from gas fired power plant
11 – 56
2
Transportation
0.752 - 6
3
Geological storage
0.375 - 6
4
Geological storage monitoring and verification
0.075 – 0.225
Table 4 Our Project Range of Total Cost for Capture, Transport and Geological Storage NO.
Power Plants Cost Parameters
Annual Cost Parameters (Million Dollar)
1
Reference plant without CCS
2
Cost of electricity for power plant with capture & enhanced oil recovery Cost of CCS
3
101.325 – 163.428
8. CHOICE OF STORAGE LOCATION IN AREA OF KIRKUK Several factors are involved in choosing the underground storage location in salt units in figure 6, these factors can be listed below: (1) The proximity of the choice area to the location of the gas utilization project, where “LPG” and other liquid hydrocarbons might be stored, and this may serve using the CO2 in extinguishing fire processing in the future. Also to increase the oil production from old wells.
121 - 229 20 - 72
(2) T h e p r e s e n c e o f t h e t h i c k e s t s e c t i o n o f individual pure salt beds especially at south east flank of Kirkuk field. (3) The suitability of flat ground surface at the suggested store area. (4) The possibility of finding suitable brine disposal facilities like re-injection into the underground. (5) A safe and short distance either from target power plants or from seepages and diffusion of CO2 gas.
Figure 6 1) Molla Abdulla Power Plant; 2) Taza Power Plant; 3) North Oil Company in Kirkuk Oil Field (Storage Area), Total distance = 30 Km
Copyright © Canadian Research & Development Center of Sciences and Cultures
31
Using Carbon Capture and Storage CCS Techniques in Mulla Abdulla and Taza Power Plants to Mitigate the Impact of Climate Change
CONCLUSIONS CCS is proposed as a means of reducing the contribution of, primarily, fuel-fired electricity generation to climate change. Currently, there is little experience with fully integrated CCS systems. CCS technology is not expected to be commercially available for use in power generation before 2020. CCS predicts a good reduction in CO 2 emissions. However, CCS does nothing to improve a power plant’s overall efficiency. CCS is expected to consume between 10 and 40 per cent energy more than equivalent power stations without CCS. This analysis confirms that CCS is an important potential response to climate change throughout the 21st century and a technology that can help control the cost of addressing climate change. The emission of CO2 by electric power plants is not controlled because no standards or required reductions currently exist. Some technology is available to limit CO2 emissions, but it is extremely expensive. The options to limit the emission of CO2 from electricity generation are to encourage reduction of the overall consumption of electricity through energy efficiency and conservation initiatives, to improve combustion efficiency at existing plants or install new units that employ more efficient technologies, such as combined-cycle units and combined heat and power (CHP) systems, and to replace fossil-fueled generation with nonfossil-fueled alternatives, such as nuclear, hydroelectric, and other renewable energy sources. CCS is not a stand-alone technology. It needs to be combined with energy efficient conversion processes that generate concentrated CO2 flows. Integrated Gasification Combined Cycle (IGCC) and Ultra Supercritical Steam Cycle (USCSC) are two such technologies for the power sector.
REFERENCES [1] Wikipedia. (2008). List of Countries by Carbon Dioxide Emissions. Retrieved from http://en.wikipedia.org/wiki/ List_of_countries_by_carbon_dioxide_emissions [2] IEA. (2008). CO 2 Capture and Storage. Retrieved from http://www.iea.org/publications/freepublications/ publication/essentials1.pdf
Copyright © Canadian Research & Development Center of Sciences and Cultures
32
[3] Intergovernmental Panel on Climate Change (IPCC). (2005). Carbon Dioxide Capture and Storage. IPCC WGIII 8th Session Montreal, September 22nd –24th, 2005. [4] Dooley, J. J., Kim, S. H., Edmonds, J. A., Friedman, S. J., Wise, M. A. (2005). A First-Order Global Geological CO2Storage Potential Supply Curve and its Application in a Global Integrated Assessment Model. In the Proceedings of the 7th International Conference on Greenhouse Gas Control Technologies. [5] Chmalensee, R. S., Stoker, T. M., & Judson, R. A. (1995). World Energy Consumption and Carbon Dioxide Emissions: 1950-2050. Retrieved from http: web.mit.eduglobalchangewwwMITJPSPGC_Rpt5.pdf, 1995. [6] Dooley, J. J., Dahowski, R. T. (2006). Carbon Dioxide Capture and Geologic Storage. The Second Phase of the Global Energy Technology Strategy Program, April. Retrieved from http: www.battelle.orgnews06CCS_Climate_ Change06.pdf. [7] Parsons Brinckerhoff Ltd. (2009). Technical Analysis of Carbon Capture & Storage (CCS) Transportation Infrastructure Report No. 63571A, 2009, Department of Energy and Climate Change 1 Victoria Street London. [8] Jordal, K., Anheden, M., Yan, J. Y., Strömberg, L. (2005). Oxyfuel Combustion for Coal-Fired Power Generation with CO2 Capture-Opportunities and Challenges. Retrieved from http://www.vattenfall.com/en/ccs/file/OXYFUELCOMBUSTION-FOR-COAL-F_8470503.pdf [9] Shuttleworth, G. (2009). Developing a Regulatory Framework for CCS Transportation Infrastructure. USA: NERA Economic Consulting. [10] Rubin, E. S., Chen, C., Rao, A. B. (2007). Cost and Performance of Fossil Fuel Power Plants with CO2 Capture and Storage. Energy Policy, 35(9), 4444-4454. [11] Stelmach, A. P. E., & Wall, S. P. B. (2008). Action on Climate Change & Responsible Energy Development: Enabling Carbon Capture and Storage. Presentation to the Council of the Federation, July, 2008. [12] IEA. (2003). CO2 Capture at Power Stations and Other Major Point Sources. Retrieved from www.iea.orgpapers 2003CO2_Power_Fossil_Fuels.pdf