is, users click at different rank positions when viewing effective search .... behaviour of popular web search engines that return 10 items per answer page.
Using Clicks as Implicit Judgments: Expectations Versus Observations Falk Scholer1 , Milad Shokouhi2⋆ , Bodo Billerbeck2⋆⋆ , and Andrew Turpin1 1
School of Computer Science and IT, RMIT University, PO Box 2476v, Melbourne 3001, Australia 2 Microsoft Research, 7 J J Thompson Ave, Cambridge CB3 0FB, UK
Abstract. Clickthrough data has been the subject of increasing popularity as an implicit indicator of user feedback. Previous analysis has suggested that user click behaviour is subject to a quality bias—that is, users click at different rank positions when viewing effective search results than when viewing less effective search results. Based on this observation, it should be possible to use click data to infer the quality of the underlying search system. In this paper we carry out a user study to systematically investigate how click behaviour changes for different levels of search system effectiveness as measured by information retrieval performance metrics. Our results show that click behaviour does not vary systematically with the quality of search results. However, click behaviour does vary significantly between individual users, and between search topics. This suggests that using direct click behaviour—click rank and click frequency—to infer the quality of the underlying search system is problematic. Further analysis of our user click data indicates that the correspondence between clicks in a search result list and subsequent confirmation that the clicked resource is actually relevant is low. Using clicks as an implicit indication of relevance should therefore be done with caution.
1
Introduction
The behaviour of users as they interact with search systems has long been of interest to information retrieval practitioners. In particular, even subtle implicit indications of what users might like and dislike while engaged in a particular search activity could potentially be exploited to improve both the current and future search sessions. With the popularity of web search, an implicit indicator that has received much attention is clickthrough data, which indicates which items in a search result list the user clicks. The underlying assumption is that users are able to infer with some degree of accuracy which items in a list are good candidates for relevance—those items that are clicked—and which are not. Clickthrough has been used among other things as a basis for re-ranking result lists [10] and document expansion [13], as well as a proxy for relevance judgements [2; 11]. ⋆ ⋆⋆
This research was carried out while the author worked at RMIT University. This research was carried out while the author worked at Sensis Pty Ltd.
While the notion that click behaviour is indicative of user preferences is intuitively appealing, and has in previous work been shown to have some success in improving search results, many properties of clickthrough data have not been explored in detail. For example, if click data was an accurate proxy of relevance, then one might expect to observe significant differences in the click behaviour of users when engaged in a search task using a highly effective retrieval system with many relevant answers in the result list, compared with a poor retrieval system. Previous work has suggested that quality of ranking list does influence user decisions. Joachims et al. observed two sources of bias in clickthrough data: a trust bias, and a quality bias [12]. Trust bias arises from the confidence that users have in a search system producing a sensible ordering of results. This behaviour is demonstrated through the order in which users view items on a search results page; in previous work this has been demonstrated to be an increasing function of rank. In other words, users generally read a result page from top to bottom [11; 19]. While trust bias might vary between different search systems (in which users could have different levels of confidence), this bias is unlikely to arise across a single perceived search system. Quality bias arises from the overall quality of search results; when the top 10 answers of a Google results list are reversed, there is a statistically significant change in the average rank of a clicked document [11]. Motivated by this result, we carried out a user study to investigate how click behaviour changes as the underlying quality of the search system is varied in a controlled way. Such a relationship could be used to try and infer the underlying quality of a search system directly from user behaviour. The research questions that we aim to address in this paper are: 1. how does the rank at which users click vary as the quality of the underlying search system changes (clicked ranks versus precision); 2. how does the frequency with which users click vary as the quality of the underlying search system changes (click frequency versus precision); and 3. how reliable are user judgements as a proxy for relevance?
2
Related Work
Clickthrough. Two early studies use clickthrough data to alter document rankings; one using weight functions and support vector machines [10], and the other modifying the vector space model [13]. The underlying assumption that clicks imply relevance, however, was not investigated in these papers. Fox et al. [8] examined clickthrough and other user behaviour and found that a combination of implicit relevance judgements (clickthrough, time spent on search results page, and how a search session ended) correlated reasonably well with explicit judgements. Unfortunately, they found that usefulness of clickthrough as a relevance indicator was limited: only in 39% of instances where users clicked on a document were they satisfied with the document. In 29% of cases they were only partially satisfied, while 27% of the time they were dissatisfied. As discussed in the introduction, Joachims et al. [11; 12] demonstrate trust and quality bias in clickthrough data. Accordingly, relevance is only unreliably
deduced from clickthrough alone, but can be much more effective when used in combination with other user behaviour that may easily be collected along with clickthrough data, such as at what the position in the result set a click occurred, what other results the individual users clicked on, and in which order. So rather than considering clickthrough as absolute feedback, they use additional information to make relative feedback more robust. They reported around 80% agreement between the feedback obtained by the clickthrough and the human judges. This work has been extended by including query reformulation behavior in the form of query chains to add further insight on whether a click on a result is an indicator of relevance [16]. Craswell et al. apply random walks on the click graph to improve image search [6]. Their click graph contains nodes that are images and queries while the edges represent clicks. By using a Markov random walk, images that have not been clicked previously for a query can be effectively ranked. Instead of collecting clickthrough passively and then using this information to re-rank results in later search sessions for possibly different users, Radlinski et al. [17] gather implicit feedback in the form of clickthroughs about documents not necessarily ranked in the top spots. In order to maximise the learning opportunities provided by users in the form of clickthrough, they re-rank results while not impacting the quality of rankings significantly. Agichtein et al. [1; 2] show that taking into account general user behaviour— in particular the tendency of users to click on the top ranked documents most heavily with a quickly decreasing frequency when lower ranks are inspected—as well as clickthrough information can lead to increased quality of rankings. They also show that by using a whole range of implicit user feedback such as page dwell time, the precision of rankings can be increased significantly. Evaluation Metrics. Experimental work in information retrieval typically follows the “Cranfield” paradigm, where a search system is evaluated by running a set of queries over a fixed collection. A human judge assesses the relevance of each document for each query and, based on the position of relevant documents in the result list, a variety of performance metrics can be calculated. This experimental framework is also at the core of the ongoing annual TREC conferences [21]. Retrieval metrics are usually based on a calculation of the precision of the search system (the number of relevant document retrieved as a proportion of the total number of documents that have been retrieved) and the recall (the number of relevant documents retrieved as a proportion of the total number of relevant document for that query). Precision therefore reflects the accuracy of the search results, while recall reflects the completeness. The average precision (AP) for a query is the mean of the precision for each relevant document that is returned in an answer list, where relevant documents that aren’t found contribute a precision of zero. Mean average precision (MAP) is then the mean AP over a run of queries. MAP gives a single score for the overall performance of a retrieval system, and is one of the most widely-reported retrieval metrics [5]. In our experiments, we control the MAP of a search system to investigate how click behaviour varies with underlying system performance.
Precision at cutoff level N calculates the number of relevant documents that a retrieval system has found out of the top N items in the answer list. Commonlyreported values of N include 5 and 10; the latter corresponds to the default behaviour of popular web search engines that return 10 items per answer page. User Behaviour and Search Performance. Several other studies have used the idea of controlling the precision of lists presented to users in order to observe behaviour in certain scenarios. Allan et al. [3] compared the performance of users of different retrieval systems at carrying out a passage-based question answering task. Their study investigated systems with different performance levels measured by the bpref metric (bpref has been proposed as an alternative to MAP for search scenarios where complete relevance judgements are not available). Their analysis showed that statistically significant differences in user performance do not occur over a broad range of system bpref levels; for easier topics, there were significant effects between bpref levels of 0.5 and 0.6, while for harder topics there were significant effects at bpref of 0.90 and 0.98. Turpin and Scholer [18] investigated user performance on simple web search tasks, considering the time that a user takes to find a relevant document, and the number of relevant documents that a user can find within 5 minutes, across search systems operating at MAP in the range of 0.55 to 0.95. Results indicated that MAP level has no significant relationship with the time taken to find the first answer (a precision-oriented task), while there is a weak relationship with a recall-oriented task.
3
User Study
To investigate how the click behaviour of searchers varies as the quality of the underlying information retrieval system changes, we conducted a user study based on those used in previous papers [18]. The level of system performance is controlled, and user click behaviour is analysed based on click ranks (the positions in search results lists at which users view documents) and the click frequency (an aggregate of how many items users choose to view). The different levels of system performance are expected to introduce a quality bias in clickthrough data; recall that quality bias refers to a change in click behaviour that arises as the result of differences in the quality of the ranking of search results [11]. Click behaviour may also be subject to trust bias; however, all of our users interact with what is (to their view) the same search system. Therefore, any trust bias would be the same across users and topics, and should not lead to differences in observed click behaviour. Collections and Topics. Our study aims to investigate searcher behaviour in a web search setting. We therefore used the TREC WT10g collection, a 10 GB crawl of the Web in 1997 [4]. This collection was used for ad hoc retrieval in the TREC 9 and 10 Web tracks, and has 100 associated search topics and corresponding relevance judgements (topics 451–550). TREC topics have three components: a title field consisting of a few keywords that represent the information
need; a description field giving a one-sentence explanation of the topic; and a narrative that further specifies what makes a document relevant for the topic. In our experiments, we investigate how click behaviour varies under different levels of search system effectiveness; we focus on controlling the level of MAP (defined in Section 2). To construct answer lists that include high levels of this metric, large numbers of relevant documents are required. We therefore use the 50 topics with the highest number of available relevance judgements for our search task. Subjects. A total of 30 experimental subjects (the users of our search systems) were recruited from RMIT University, including a mixture of undergraduate and postgraduate students with a median age of 23. All subjects provided written informed consent, and the research was conducted under the guidelines of the RMIT Human Research Ethics Committee. Participants were asked to complete a pre-experiment questionnaire, to establish their familiarity with online searching. Most users were very experienced with electronic search systems, including web search engines, with a mean rating of 4.7 on a scale of 1 (no experience) to 5 (a great deal of experience). The mean frequency of conducting a search was one or more times a day. Users also indicated they strongly enjoy carrying out information searches (a mean rating of 4.2 on a scale of 1–5). Search Systems. To investigate the effect of system effectiveness on click behaviour, we control the level of system performance as measured by mean average precision (MAP). Based on the findings of Allan et al. [3], which suggested that the impact of varying system performance would only be likely to have an impact at high levels, we created search systems with MAP levels of 55%, 65%, 75%, 85% and 95%. To control the average precision (AP) of a system for a single query, we constructed answer lists, based on the available TREC relevance judgements. Relevant and irrelevant documents were chosen randomly from the judgements file so that the required level of AP was achieved. 200 such lists were created for each system and topic combination. Therefore, a user could enter more than one search query for a single topic, and be served with lists of a consistent AP level. The MAP of a system-topic combination is therefore the same as the AP of a single list. We note that, since we were investigating high levels of MAP, there are many relevant documents that occur towards the start of the search result lists. Since we are interested in investigating click behaviour in a web search environment, the search interface presented to users was modelled closely on the interfaces of popular web search engines such as Yahoo! or Google. Queries are entered into a simple text-box input field in a web browser, and a list of 100 answer resources is returned. Answer list entries consist of the document title, which is a hyperlink leading to the underlying resource. Together with each title, a short query-biased summary is displayed. The summaries are pre-generated, using the title field of each search topic as the query terms. The summaries consist of up to three sentences containing query terms; more weight is given to sentences that contain a greater number of query terms, and where query terms occur in closer proximity to each other [20].
Experimental Setup. Users in our study were asked to carry out a traditional web search task: given an information need, find documents that contain relevant information. Users were given 5 minutes to find as many relevant documents as possible. To reduce ordering effects, any document that contained information contributing to the resolution of the information need was to be considered relevant, even if it contained information that had been seen before. The user study followed a balanced design, to control for confounding factors such as user learning and order effects. Each subject conducted searches for 50 topics. However, due to unanticipated browser use, a small number of topics and sessions had be removed from the final analysis. This resulted in each systemtopic pair being used an average of 4.9(±0.1) times, with a mean number of users per topic of 24.3(±3.4). A search session proceeded as follows: first, a user was presented with an information need, consisting of the description and narrative field of a TREC topic. The user then had five minutes to interact with a search system (of a specific AP level, unknown to the user), identifying as many relevant documents as possible. In response to a user query, an answer list of the appropriate AP level was randomly selected from the pool of 200 lists created for each topic-system combination, and displayed. Users could browse the answer list, and view the underlying documents by clicking hyperlinks in the document title; this would open the document in a new window. After viewing a document, a user could choose to save it as being relevant to the information need using a save button, or simply close the document if it is not relevant. All interactions with the search system, in particular all clicks and views of documents, were stored in a log file and subsequently analysed.
4
Clicked Ranks versus Precision
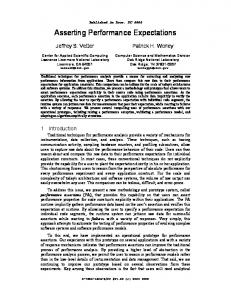
We first investigate whether the rank position at which users click is affected by the quality of the underlying search system that is being used. Figure 1 shows a boxplot of the system MAP level against the rank position at which users clicked on answer resources. For all boxplots used in this paper, the box shows the data falling between the 25th to 75th percentile, with the median indicated by a solid black line. Whiskers show the extent of the data range, and outlier values are shown as individual points. A multifactorial analysis of variance (ANOVA) indicates that there is no statistically significant relationship between the rank at which users click and the MAP level of the search system used (p > 0.1). A similar lack of difference is observed when evaluating the clicked rank against system performance as measured by precision at 10 documents retrieved, as shown in Figure 2 (p > 0.1). We note that there are no observations for P@10 below the level of 0.4; this is due to the construction of our lists, which were designed to correspond to particular MAP levels. It is therefore possible that click behaviour might differ for very low levels of this metric. However, the results demonstrate that for a large range of system quality as measured by P@10, changing the proportion of relevant documents in the top ranks of a
100 80 60
Clicked rank
40 20 0
55%
65%
75%
85%
95%
MAP
Fig. 1. Rank of the clicked documents for different systems. The x-axis shows the MAP value of systems according to TREC judgments.
search results list has no impact on the overall rank position at which users click when viewing results. As the users interacted with our search systems, for each document that a user viewed from a result list, they made a decision as to whether the document is relevant to the information need. An alternative way of viewing the level of system effectiveness is therefore to calculate the precision based on explicit user relevance judgements only, rather than TREC relevance judgements. Figure 3 shows the rank position at which users clicked for different levels of “P@5-clicked”; that is, the precision is calculated from explicit user judgements for the top 5 clicked documents. The results again show no relationship between the level of system effectiveness and the rank position at which users click; there is no significant difference in the average click rank across all levels of user judgement-derived P@5-clicked (p > 0.1). The lack of difference in the average clicked rank across starkly different levels of search system effectiveness is surprising. One possible explanation would be that click behaviour is subject to significant biases so that all systemic variation is hidden. If this was the case, we would also expect that there are no differences in click rank for other effects, such as between topics or between users. We therefore investigated how the clicked rank varies between topics. A boxplot of clicked rank for each search topic is shown in Figure 4, sorted by average clicked rank. ANOVA results indicate that there are highly significant user effects (p < 0.0001). A subsequent Tukey Honest Significant Differences test indicates
100
Clicked rank
80
60
40
20
1
0.9
0.8
0.7
0.6
0.5
0.4
0
P@10 (TREC judgments)
Fig. 2. Rank of the clicked documents for different system performance levels as measured by P@10. The x-axis shows the percentage of the top ten documents that are relevant according to TREC judgments.
65 significant pairwise differences (p < 0.05). There are therefore strong and numerous differences in the average click rank between topics. Possible user effects may also be present; the clicked ranks by individual users are shown in Figure 5. Again, ANOVA results indicate that there are significant differences in click ranks between users (p < 0.0001). A subsequent Tukey Honest Significant Differences test shows 110 significant differences (p < 0.05). Clicking behaviour varies strongly from user to user.
5
Click Frequency versus Precision
User click behaviour can be summarised in aggregate by two main measures: the rank at which users click, and the overall frequency with which users click. In general, we expect that a good search system (that is, one that returns a better result list) would demonstrate a higher click frequency, as the result of two complementary effects. First, a better result list will have more relevant answer documents near the start of the list; therefore, users need to spend less time reading down the list, and in a time-constrained search task, they would therefore have the opportunity to click on more items. A second, related, effect is that in a better result list, there are simply more “good” answer documents to look at. We compared the average click frequency of different search systems based on their MAP levels. According to our observations, the frequency remains
100 80 60
Clicked rank
40 20 0
0
0.2
0.4
0.6
0.8
1
P@5−clicked (user judgments)
Fig. 3. Rank of the clicked documents for different system performance levels as measured by P@5-clicked. The x-axis shows the percentage of the top five clicked documents that users explicitly judged as relevant. In the rightmost bar, all the top five clicked documents are detected to be relevant by users.
largely invariant as the MAP level changes; an ANOVA detects no statistically significant differences (p > 0.1). We also investigated the variation of the average click frequency for systems with varying levels of P@10. Again, the frequency is stable across different levels of search system effectiveness, and ANOVA detects no significant differences (p > 0.1).
6
User Judgments as a Proxy for Relevance
There is much interest in the IR community about using clickthrough data as an indication of relevance, either directly, or to generate preference relations. We therefore investigate the reliability of using clickthrough data as an indication of relevance, based on the data from our user-study. Overall, our experimental subjects clicked 3,778 times in the answer lists. Each click would bring up a document, and lead to a subsequent decision about whether to save the document (because it contains relevant information), or to discard it. 1,980 clicked documents were saved; therefore, the proportion of clicked documents that are actually considered to be relevant is only 52%. This is surprisingly low, and indicates that it is not safe to infer relevance directly from
100
Clicked rank
80
60
40
20
479 527 460 478 501 510 515 523 533 535 546 549 465 475 457 458 459 476 488 490 492 494 511 513 514 518 521 544 474 526 453 454 467 500 508 519 509 524 541 495 493 529 530 542 547 550 452
0
Topic
Fig. 4. The average rank of clicked documents across different topics.
recorded click information. The proportion of relevant to total clicks remains stable across different levels of system effectiveness, as shown in Table 1. TREC relevance judgements are used as a ground truth for a large proportion of information retrieval experiments that are reported in the literature. As such, it is also interesting to compare how well user click behaviour corresponds with official relevance judgements. In total, user clicks agree with TREC judgements— including both agreement on relevance and non-relevance of documents—2,219 times. The rate of agreement is therefore 58%. Interestingly, the rate of agreement seems to decrease slightly as the effectiveness of the underlying system gets higher, as indicated in Table 1. While not very high, the rate of agreement between overall clicks and the TREC judgements is greater than the underlying agreement between user and TREC judgements at the document level—when only unique document-topic combinations are counted—which is only 45% on the same data. These results support the view that TREC judgements are in general not directly transferable to other scenarios [9].
7
Conclusions
Clickthrough data is a popular implicit indicator of user preferences, and has been applied in a variety of situations to improve search results. Motivated by successes in previous work, we carried out a user study to investigate how
100
Clicked rank
80
60
40
20
10 13 25 4 9 15 22 27 11 12 17 20 6 16 24 29 2 18 30 28 5 1 3 8 14 23 26 7 21 19
0
User
Fig. 5. The average rank of clicked documents across different users.
click behaviour varies with changes in the quality of an underlying search system. To the best of our knowledge, this is the first study of how the click behaviour of users varies with controlled changes in system quality. Our results are surprising—we found no statistically significant relationship between clickthrough data and system performance, across different measures of click behaviour (click rank and click frequency) and across various measures of system performance, including metrics based on both TREC relevance judgements and user relevance judgements. This suggests that it is not safe to infer the quality of an underlying search system—at least as measured by currently popular IR system metrics—based on simple measures of click behaviour. Analysis of our user click data further showed that the action of clicking is not strongly correlated with relevance—only 52% of clicks in a search result list led to a document that the user actually found to be relevant. Attempts to use clicks as an implicit indication of relevance should therefore be treated with caution. In future work, we plan to investigate how more complex interpretations of clickthrough behaviour may relate to system performance. For example, other studies have found a relationship between the experience of users and click behaviour. We therefore intend to conduct a larger-scale user study incorporating groups of user with markedly different levels of search ability, to investigate whether there are any interactions between this factor, click behaviour and system performance.
Table 1. Agreement between user clicks and TREC relevance judgements. C: The total number of clicks, U: The total number of documents detected as relevant by users. A: The total number of agreements between TREC judgments and user judgments. MAP 55% 65% 75% 85% 95% Total
C 692 748 795 763 780 3778
U 348 366 432 409 425 1980
A 315 340 417 399 415 2219
U C
A C
0.50 0.48 0.54 0.53 0.54 0.52
0.61 0.58 0.58 0.57 0.56 0.58
References [1] E. Agichtein, E. Brill, and S. Dumais. Improving web search ranking by incorporating user behavior information. In Efthimiadis et al. [7], pages 19 – 26. [2] E. Agichtein, E. Brill, S. Dumais, and R. Ragno. Learning user interaction models for predicting web search result preferences. In Efthimiadis et al. [7], pages 3 – 10. [3] J. Allan, B. Carterette, and J. Lewis. When will information retrieval be “good enough”? In Marchionini et al. [15], pages 433–440. [4] P. Bailey, N. Craswell, and D. Hawking. Engineering a multi-purpose test collection for web retrieval experiments. Information Processing and Management, 39(6):853–871, 2003. [5] C. Buckley and E. M. Voorhees. Retrieval system evaluation. In TREC : experiment and evaluation in information retrieval [21]. [6] N. Craswell and M. Szummer. Random walks on the click graph. In Kraaij et al. [14], pages 239–246. [7] E. Efthimiadis, S. Dumais, D. Hawking, and K. J¨ arvelin, editors. Proceedings of the 29th Annual International ACM SIGIR Conference on Research and Development in Information Retrieval, Seattle, WA, 2006. [8] S. Fox, K. Karnawat, M. Mydland, S. Dumais, and T. White. Evaluating implicit measures to improve web search. ACM Transactions on Information Systems, 23(2):147–168, 2005. [9] Donna K. Harman. The TREC test collection. In TREC : experiment and evaluation in information retrieval [21]. [10] T. Joachims. Optimizing search engines using clickthrough data. In Proceedings of the eighth ACM SIGKDD international conference on Knowledge discovery and data mining, pages 133–142, Edmonton, Alberta, Canada, 2002. ACM. [11] T. Joachims, L. Granka, B. Pan, H. Hembrooke, and G. Gay. Accurately interpreting clickthrough data as implicit feedback. In Marchionini et al. [15], pages 154–161. [12] T. Joachims, L. Granka, B. Pan, H. Hembrooke, F. Radlinski, and G. Gay. Evaluating the accuracy of implicit feedback from clicks and query reformulations in web search. ACM Transactions on Information Systems, 25(2):7, 2007. [13] C. Kemp and K. Ramamohanarao. Long-term learning for web search engines. In Proceedings of the 6th European Conference on Principles of Data Mining and Knowledge Discovery, pages 263–274, London, UK, 2002. Springer-Verlag. [14] W. Kraaij, A. de Vries, C. Clarke, N. Fuhr, and N. Kando, editors. Proceedings of the 30th Annual International ACM SIGIR Conference on Research and Development in Information Retrieval, Amsterdam, The Netherlands, 2007. [15] G. Marchionini, A. Moffat, J. Tait, R. Baeza-Yates, and N. Ziviani, editors. Proceedings of the 28th Annual International ACM SIGIR Conference on Research and Development in Information Retrieval, Salvador, Brazil, 2005. [16] F. Radlinski and T. Joachims. Query chains: learning to rank from implicit feedback. In Proceeding of the eleventh ACM SIGKDD international conference on Knowledge discovery in data mining, pages 239–248, Chicago, Illinois, USA, 2005. [17] F. Radlinski and T. Joachims. Active exploration for learning rankings from clickthrough data. In Proceedings of the 13th ACM SIGKDD international conference on Knowledge discovery and data mining, pages 570–579, San Jose, California, 2007. [18] A. Turpin and F. Scholer. User performance versus precision measures for simple search tasks. In Efthimiadis et al. [7], pages 11 – 18. [19] A. Turpin, F. Scholer, B. Billerbeck, and L. Abel. Examining the pseudo-standard web search engine results page. In Proceedings of the 11th Australasian Document Computing Symposium, pages 9–16, Brisbane, Australia, 2006. [20] A. Turpin, Y. Tsegay, D. Hawking, and H. E. Williams. Fast generation of result snippets in web search. In Kraaij et al. [14], pages 127–134. [21] E. M. Voorhees and D. K. Harman. TREC : experiment and evaluation in information retrieval. MIT Press, 2005.