Feb 14, 2018 - Q-methodology was introduced in 1935 by William Stephenson [1] [2] to study subjective topics such as attitudes, perceptions, preferences, and ...
Open Journal of Applied Sciences, 2018, 8, 73-79 http://www.scirp.org/journal/ojapps ISSN Online: 2165-3925 ISSN Print: 2165-3917
Using Cohen’s Effect Size to Identify Distinguishing Statements in Q-Methodology Noori Akhtar-Danesh School of Nursing, McMaster University, Hamilton, Canada
How to cite this paper: Akhtar-Danesh, N. (2018) Using Cohen’s Effect Size to Identify Distinguishing Statements in Q-Methodology. Open Journal of Applied Sciences, 8, 73-79. https://doi.org/10.4236/ojapps.2018.82006 Received: January 18, 2018 Accepted: February 11, 2018 Published: February 14, 2018 Copyright © 2018 by author and Scientific Research Publishing Inc. This work is licensed under the Creative Commons Attribution International License (CC BY 4.0). http://creativecommons.org/licenses/by/4.0/ Open Access
Abstract Q-methodology was introduced more than 80 years ago to study subjective topics such as attitudes, perceptions, preferences, and feelings and there has not been much change in its statistical components since then. In Q-methodology, subjective topics are studied using a combination of qualitative and quantitative techniques. It involves development of a sample of statements and rank-ordering these statements by study participants using a grid known as Q-sort table. After completion of Q-sort tables by the participants, a by-person factor analysis (i.e., the factor analysis is performed on persons, not variables or traits) is used to analyze the data. Therefore, each factor represents a group of individuals with similar views, feelings, or preferences about the topic of the study. Then, each group (factor) is usually described by a set of statements, called distinguishing statements, or statements with high or low factor scores. In this article, we review one important statistical issue, i.e. the criteria for identifying distinguishing statements and provide a review of its mathematical calculation and statistical background. We show that the current approach for identifying distinguishing statements has no sound basis, which may result in erroneous findings and seems to be appropriate only when there are repeated evaluations of Q-sample from the same subjects. However, most Q-studies include independent subjects with no repeated evaluation. Finally, a new approach is suggested for identifying distinguishing statements based on Cohen’s effect size. We demonstrate the application of this new formula by applying the current and the suggested methods on a Q-dataset and explain the differences.
Keywords Q-Methodology, Distinguishing Statements, Cohen’s d, Cohen’s Effect Size
DOI: 10.4236/ojapps.2018.82006
Feb. 14, 2018
73
Open Journal of Applied Sciences
N. Akhtar-Danesh
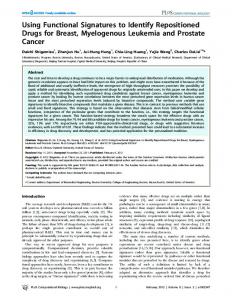
1. Introduction Q-methodology was introduced in 1935 by William Stephenson [1] [2] to study subjective topics such as attitudes, perceptions, preferences, and feelings. In Q-methodology, subjective topics are studied using a combination of qualitative and quantitative techniques [3]. It involves development of a sample of statements, called Q-sample, related to the topic of interest and rank-ordering these statements by a group of individuals, study participants, from their points of views or preferences using a grid (known as Q-sort table). This Q-sort table usually has a quasi-normal distribution (see Figure 1) and the completed data from a Q-sort table is known as Q-sort. After completion of Q-sort tables by the participants, a by-person factor analysis (i.e., the factor analysis is performed on persons, not variables or traits) is used to analyze the Q-sorts. Because each participant completes one Q-sort table, each Q-sort represents one individual rather than one variable or trait. Using a by-person factor analysis, similar Q-sorts (individuals) are grouped together as factors. Therefore, each factor represents a group of individuals with similar views, feelings, or preferences about the topic of the study. Statistically, one individual belongs to a factor if his/her factor loading on the factor is statistically significant (p ≤ 0.05). Next, each group (factor) is usually described by a set of statements, called distinguishing statements. Although Q-methodology was introduced more than 80 years ago, there have not been significant advances in its statistical components since then. Some of these issues have already been discussed elsewhere [4] [5]. In this article, we review another important statistical issue, i.e. the criteria for identifying distinguishing statements, and suggest appropriate changes.
2. Methods In the current practice of Q-methodology, a statement is identified as a distinguishing statement for a factor a compared to any other factor x, if
scorea − scorex ≥ 1.96 × sea2 + sex2
(1)
where 1.96 × sea2 + sex2 is called the margin of error or precision of estimate. However, the point is how to calculate se2 for each factor score. The current
Figure 1. Q-sort table with 19 cells. DOI: 10.4236/ojapps.2018.82006
74
Open Journal of Applied Sciences
N. Akhtar-Danesh
Q-programs calculate se2 based on a formula that Stephenson [6] adapted from Spearman [7], i.e. = se σ 1 − r where σ is the standard deviation of the scores for each factor and r (reliability coefficient = correlation of sums for test-retest) is defined as r=
0.80 p 1 + 0.80 ( p − 1)
(2)
where p is number of Q-sorts loaded on the factor. However, this formula adapted from Spearman does not seem to be appropriate in Q-methodology analysis because, first, Spearman’s formula is for correlation of sums or differences of a group of variables on the same subjects, but in Q-methodology Q-sorts on different factors are usually from different subjects and independent from each other. Second, using formula (1) for margin of error is highly dependent on the number of Q-sorts loaded on each factor. Table 1 shows the margin of error for two factors with different number of Q-sorts loaded on each factor and r values based on formula (2). As can be seen, using Stephenson’s formula, factors with smaller numbers of Q-sorts have a larger margin of error which results in smaller numbers of distinguishing statements. On the other hand, use of a proper statistical test is not applicable for identifying distinguishing statements because in Q-methodology each statement is compared separately between factors. Therefore, from a statistical point of view, sample size is equal to unity, and the margin of error will be relatively large. In addition, in most cases factors are orthogonal and factor scores are supposed to be (at least in theory) independent from each other with a standard deviation (σ) equal to unity. Hence, the correct standard error for the difference between any two factor scores will be
SEdiff =
σ 2 +σ 2 =
sea2 + seb2 =
1 + 1 = 1.41
Table 1. Margin of error for identifying distinguishing statements based on number of Q-sorts loaded on factors (p1 and p2) using Stephenson’s formula.
DOI: 10.4236/ojapps.2018.82006
p1
p2
r1
r2
Margin of error
3
3
0.923
0.923
0.769
5
5
0.952
0.952
0.605
5
10
0.952
0.976
0.526
5
20
0.952
0.988
0.480
10
10
0.976
0.976
0.433
10
15
0.976
0.984
0.396
10
20
0.976
0.988
0.376
15
15
0.984
0.984
0.355
15
20
0.984
0.988
0.332
20
20
0.988
0.988
0.308
50
50
0.995
0.995
0.196
100
100
0.998
0.998
0.138
75
Open Journal of Applied Sciences
N. Akhtar-Danesh
and a statement will be identified as distinguishing if scorea − scoreb ≥ 1.96 × 1.41 = 2.76
A margin of error of 2.76 is very large and hardly any distinguishing statement can be found using this criterion. To overcome the abovementioned problems, we suggest using Cohen’s d (or Cohen’s effect size), which is very popular in psychology and clinical sciences. Cohen’s d [8] which is defined as
d=
Mean1 − Mean2
σ
is used to compare the means of two groups based on d as effect size. Cohen suggested an effect size of 0.2 as small, 0.5 as medium, and 0.8 as large.
3. Results In this section, an example is provided where the salient viewpoints of a group of individuals who participated in several Q-methodology workshops, using marijuana legalization (ML) as an example, were explored and the distinguishing statements and consensus statements were identified. Example: 1) Marijuana Legalization First, to assemble a group of statements for Q-sample the World Wide Web was searched for statements about ML, specifically, to get a sense of supportive and opposing views. We found more than 50 statements and after a review for similarities and differences, 19 representative statements were selected for Q-sample and a Q-sort table was developed (Figure 1). Next, 38 individuals who participated in different Q-methodology workshops completed the Q-sort table. The raw data from these Q-sort tables were entered into Stata and qconvert program [9] was used to convert raw data into usable data for analysis by qfactor program [10]. 2) Factor extraction and factor rotation To identify distinguishing statements, we used both Stephenson’s formula and Cohen’s d criteria. Three factors were extracted using principal axis factoring and varimax rotation. The number of Q-sorts loaded on factors 1, 2, and 3 were 12, 8, and 9, respectively. 3) Distinguishing statements and consensus statements Using Stephenson’s approach, based on formulas (1) & (2), the margin of error for identifying distinguishing statements for Factor 1 is 0.439 (in comparison with Factor 2) and 0.425 (in comparison with Factor 3). Based on these criteria, the distinguishing statements for Factor 1 are listed in Table 2. Also, distinguishing statements for Factor 1 based on Cohen’s d = 0.80 are listed in Table 3. As we can see in these two tables, because a larger number is set to differentiate between statements’ scores based on Cohen’s d, a smaller number of statements emerged as distinguishing. This pattern was observed for the other two factors as well (the statements are not provided). We also listed the consensus statements DOI: 10.4236/ojapps.2018.82006
76
Open Journal of Applied Sciences
N. Akhtar-Danesh Table 2. Distinguishing statements for Factor 1 based on Stephenson’s formula. #
Factor Factor Factor 1 2 3
Statement
8
Education and regulation are better options than prohibition
3
1
0
1
The harms associated with marijuana are less than those associated with tobacco and alcohol, and they are not sufficient reason to justify making marijuana illegal
1
0
0
1
0
−1
0
−1
−1
There is an abundance of anecdotal evidence, as well as some 18 scientific research, indicating that marijuana can be effective as a treatment for some illnesses
0
2
3
10
If we legalize marijuana, we reduce the black market and the violence associated with the sale of marijuana
0
3
0
4
Taxpayers are forced to pay billions of dollars to persecute, prosecute, and lock up people for having marijuana. If marijuana were legal, this money, plus tax revenues from marijuana sales, could be used for other purposes such as education or health care
0
1
−2
By legalizing marijuana, there will be an increase in people using 15 the drug and therefore a need to increase rehabilitation programs which will come at the cost of taxpayers and the government
−1
−1
1
A decrease in the use of marijuana means fewer health risks such as slowed brain function or risk of cancer
−1
0
2
By legalizing marijuana, more people will use the drug and as a 14 result, become addicted and more families will become dysfunctional
−3
−1
1
It should become legal for those over the age of eighteen because 11 these individuals are considered adults and are able to make their own decisions regarding drug use 5
16
Marijuana does not cause violence. In fact, people who are high on marijuana tend to be relaxed, mellow, and too happy to want to fight
Score ranges from −3 to +3 and negative scores indicate disagreement.
using Stephenson’s formula and Cohen’s d in Table 4. Consensus statements are defined as the statements whose scores are not statistically different between any two factors. Because we used a larger difference to identify distinguishing statements based on Cohen’s effect size, there will be a larger number of statements that will not be statistically significant between factors. Hence, it is not surprising that based this approach, there are more consensus statements than Stephenson’s formula.
4. Discussion Q-methodology was introduced more than 80 years ago to study subjective issues using some statistical techniques. There has not been much change or improvement in the statistical component of Q-methodology since its introduction by Stephenson [1] [2] as its founding father. Only recently there have been some suggestions for using alternative techniques [4] [5] other than what has been DOI: 10.4236/ojapps.2018.82006
77
Open Journal of Applied Sciences
N. Akhtar-Danesh Table 3. Distinguishing statements for factor 1 based on Cohen’s d. #
Factor Factor Factor 1 2 3
Statement
It should become legal for those over the age of eighteen because 11 these individuals are considered adults and are able to make their own decisions regarding drug use
1
0
−1
0
−1
−1
0
2
3
0
1
−2
By legalizing marijuana, there will be an increase in people using 15 the drug and therefore a need to increase rehabilitation programs which will come at the cost of taxpayers and the government
−1
−1
1
By legalizing marijuana, more people will use the drug and as a 14 result, become addicted and more families will become dysfunctional
−3
−1
1
5
Marijuana does not cause violence. In fact, people who are high on marijuana tend to be relaxed, mellow, and too happy to want to fight
There is an abundance of anecdotal evidence, as well as some 18 scientific research, indicating that marijuana can be effective as a treatment for some illnesses 4
Taxpayers are forced to pay billions of dollars to persecute, prosecute, and lock up people for having marijuana. If marijuana were legal, this money, plus tax revenues from marijuana sales, could be used for other purposes such as education or health care
Table 4. Consensus statements based on Stephenson’s formula and Cohen’s d. #
Statements based on Stephenson’s formula
Factor Factor Factor 1 2 3
9
Prohibition is not an effective solution to the problems associated with marijuana use
2
1
1
12
The use of marijuana as a pain control may cause patients to rely solely on the drug rather than medical treatment
−2
−3
−2
Statements based on Cohen’s d 9
Prohibition is not an effective solution to the problems associated with marijuana use
2
1
1
1
The harms associated with marijuana are less than those associated with tobacco and alcohol, and they are not sufficient reason to justify making marijuana illegal
1
0
0
17
Individuals should be allowed to choose whether or not they use marijuana; individual liberty is a fundamental value
1
1
0
7
Certain people are able to function only with the aid of marijuana. If it is more difficult for them to access the drug, they may be unable to perform effectively in society
−1
0
−1
12
The use of marijuana as a pain control may cause patients to rely solely on the drug rather than medical treatment
−2
−3
−2
Score ranges from −3 to +3 and negative scores indicate disagreement.
traditionally available in Q-methodology. In this article, we critically reviewed an important component of Q-methodology, i.e. statistical criteria for identifying DOI: 10.4236/ojapps.2018.82006
78
Open Journal of Applied Sciences
N. Akhtar-Danesh
distinguishing statements. We showed that Stephenson’s formula [6] which was adapted from Spearman [7] is not theoretically appropriate in Q-methodology if multiple Q-sorts are not used from the same subjects. As a matter of fact, we conducted a literature search and found only a handful of studies based on multiple Q-sorts on the same subjects. In addition, number of distinguishing statements based on Stephenson’s formula is highly dependent on the number of Q-sorts loaded on each factor. For identifying distinguishing statements in Q-methodology, statement scores are compared between factors individually; therefore, from a statistical perspective, each statement represents a sample size of unity which requires a margin of error of 2.76. This is a very large margin of error, and hardly any distinguishing statements can be found using this criterion. Instead, we suggest use of Cohen’s d, which is quite popular in health and behavioral research. Cohen’s d is a simple criterion and the resultant number of distinguishing statements is independent of the number of Q-sorts loaded on each factor.
References [1]
Stephenson, W. (1935) Correlating Persons Instead of Tests. Character and Personality, 4, 17-24. https://doi.org/10.1111/j.1467-6494.1935.tb02022.x
[2]
Stephenson, W. (1935) Technique of Factor Analysis. Nature, 136, 297. https://doi.org/10.1038/136297b0
[3]
Akhtar-Danesh, N., Baumann, A. and Cordingley, L. (2008) Q-Methodology in Nursing Research: A Promising Method for the Study of Subjectivity. Western Journal of Nursing Research, 30, 759-773. https://doi.org/10.1177/0193945907312979
[4]
Akhtar-Danesh, N. (2016) An Overview of the Statistical Techniques in Q-Methodology: Is There a Better Way of Doing Q-Analysis? Operant Subjectivity, 38, 29-36.
[5]
Akthar-Danesh, N. (2017) A Comparison between Major Factor Extraction and Factor Rotation Techniques in Q-Methodology. Open Journal of Applied Sciences, 7, 147-156. https://doi.org/10.4236/ojapps.2017.74013
[6]
Stephenson, W. (1978) A Note on Estimating Standard Error of Factor Scores in Q-Method. Operant Subjectivity, 1, 29-37.
[7]
Spearman, C. (1913) Correlations of Sums and Differences. British Journal of Psychiatry, 5, 417-426. https://doi.org/10.1111/j.2044-8295.1913.tb00072.x
[8]
Cohen, J. (1977) Statistical Power Analysis for the Behavioral Sciences. Academic Press, New York.
[9]
Akhtar-Danesh, N. (2017) QCONVERT: Stata Module to Covert a Raw Data File of Q-Sorts into a Q-Sort File Ready for Analysis by QFACTOR Program https://ideas.repec.org/c/boc/bocode/s458325.html
[10] Akhtar-Danesh, N. (2018) QFACTOR: A Stata Command for Q-Methodology Analysis. Stata Journal. (In Press)
DOI: 10.4236/ojapps.2018.82006
79
Open Journal of Applied Sciences