CSIRO PUBLISHING
www.publish.csiro.au/journals/ajar
Australian Journal of Agricultural Research, 2005, 56, 465–473
Using computer simulation of the selection process and known gene information to assist in parental selection in wheat quality breeding J. WangA,C,D,E , H. A. EaglesB,D , R. TrethowanC,D , and M. van GinkelC,D A Institute
of Crop Science, Chinese Academy of Agricultural Sciences, No. 12 Zhongguancun South Street, Beijing 100081, China. B Department of Primary Industries, PB 260, Horsham, Vic. 3401, Australia. C International Maize and Wheat Improvement Center (CIMMYT), Apdo. Postal 6-641, 06600 Mexico, D.F., Mexico. D Molecular Plant Breeding CRC, Suite 21, 2 Park Drive, Bundoora, Vic. 3083, Australia. E Corresponding author. Email:
[email protected]
Abstract. Determining how to choose parents and conduct selections is a critical issue in plant breeding. The genetic and breeding simulation tool QuCim can predict the outcome of a cross under a specific selection scheme, when genetic information for the targetted traits is known. In this paper, we use genetic information from Australian wheat breeding programs about glutenin, as it relates to wheat quality, to predict the outcomes from some example crosses. The 8 Silverstar sister lines used in our study are morphologically very similar, but have different values for 2 important quality traits, maximum dough resistance (Rmax) and extensibility. Supposing we intend to use Silverstar in crosses with other adapted cultivars, without losing grain quality, which sister line should we use? Under the condition that high Rmax is the major breeding objective, QuCim simulation showed that Silverstar 3 and 7 should be chosen if the other parent does not have allele b at Glu-A3 and allele d at Glu-D1. If the other parent has allele b at Glu-A3 and allele d at Glu-D1, all 8 lines can be used. If the other parent does not have allele b at Glu-A3, but has allele d at Glu-D1, Silverstar 3, 4, 7, and 8 should be used, and if the other parent has allele b at Glu-A3, but does not have allele d at Glu-D1, Silverstar 1, 3, 5, and 7 should be used. Therefore, the optimum Silverstar line depends on the alleles present at glutenin loci in the other parent. Australian wheat cultivars Krichauff and Machete have a similar value for Rmax, but they differ substantially as a donor for improving Rmax in other parents. For crosses with Australian wheat cultivar Trident, Machete is the better choice, but for crosses with the Australian wheat cultivar Westonia, Krichauff is better. In conclusion, QuCim can accurately predict the outcome from a specific cross under a selection scheme when gene information is known. It can help breeders identify the best crosses and selection methods to achieve their breeding objectives. Additional keywords: breeding simulation, cross performance prediction, QuCim.
Introduction Selecting parents to make crosses is the first and essential step in plant breeding (Allard 1960; Fehr 1987). Given a lack of information on potential parents and fixed resources, one strategy is to make as many crosses as possible and to derive one line from each cross (Yonezawa and Yamagata 1978; Weber 1979). However, this is impossible in practice, as hundreds of parents are often under consideration for crossing, and the breeder has to select a subset from among all the potential parents. Due to incomplete gene information (i.e. some resistance genes and their effects on phenotype are known, whereas © CSIRO 2005
some are not; most genes for agronomic traits are unknown), many seemingly good crosses are discarded during the segregating phase of a breeding program. For example, in the bread wheat breeding program of the International Maize and Wheat Improvement Center (CIMMYT), ∼50–80% of crosses are discarded in generations F1 to F8 , following selection for agronomic traits (e.g. plant height, lodging tolerance, tillering, appropriate heading date, and balanced yield components), disease resistance (e.g. stem rust, leaf rust, and stripe rust), and end-use quality (e.g. dough strength and extensibility, protein quantity and quality). Then, after 2 cycles of yield trials (i.e. preliminary 10.1071/AR04285
0004-9409/05/050465
466
Australian Journal of Agricultural Research
yield trial in F8 and replicated yield trial in F9 ), only 10% of the initial crosses remain, from which 1–3% of the crosses originally made are released as cultivars from CIMMYT’s international nurseries (van Ginkel et al. 2002). Similar figures are common in other breeding programs. Significant resources can therefore be saved if the potential performance of a cross, using a defined selection strategy, could be more accurately predicted. Generally speaking, the cross with the highest progeny mean and largest genetic variance has the most potential to produce the best lines (Bernardo 2002). Under an additive genetic model, the midparent value is a good predictor of the progeny mean, but the variance cannot be deduced from the performance of the parents alone. The best way to estimate the progeny variance is to generate and test the progeny. Breeders normally use one of 2 types of parental selection: one based on parental information, such as parental performance or the genetic diversity among parents (Bhatt 1973); the other based on parental and progeny information (Utz et al. 2001). In the first case, previous studies found that both high × high and high × low crosses have the potential to produce the best lines (Busch et al. 1974; Tanksley and Nelson 1996), and the correlation between the genetic distance of parents and their progeny performance is not high (Bohn et al. 1999). In the second case, the progeny need to be grown and tested, which precludes parental selection. Due to complicated intragenic, intergenic, and gene × environment interactions, no method has given a precise prediction of cross performance. Cross performance can be accurately predicted when information about the genes controlling the traits of interest is known. If progeny arrays after selection in a breeding program could be predicted, then the efficiency of plant breeding would be greatly increased. The QuCim tool (Wang et al. 2004) provides a means by which these predictions can be calculated. It is based on QU-GENE (Podlich and Cooper 1998), and was specifically developed to simulate the wheat breeding programs at CIMMYT and in Australia. However, the breeding strategies defined in QuCim represent the operations of most breeding programs for self-pollinated crops, and thus, in principle, the program has much wider potential application. QuCim has been used to compare 2 breeding strategies commonly used in CIMMYT’s wheat breeding program (Wang et al. 2003), and to simulate the effects of dominance and epistasis on selection (Wang et al. 2004). For the majority of economically important traits in wheat breeding the genes controlling their expression remain unknown. However, for wheat quality this information is known, though incompletely, for certain aspects of wheat quality (Eagles et al. 2002a, 2002b, 2002c, 2004). In this study, we demonstrate how cross performance, following selection, can be predicted in wheat quality breeding by using QuCim, under the condition that all the gene information of key selection traits is known.
J. Wang et al.
Materials and methods Genes and their effects on wheat quality The quality of wheat flour for bread making depends on the viscoelastic properties of the dough, which are influenced by the quantity and quality of the gluten storage proteins in the endosperm. Two major types of glutenins have been recognised, i.e. high molecular weight glutenins and low molecular weight glutenins (Payne 1987; Eagles et al. 2002a). Genes coding for the low molecular weight glutenins, Glu-A3, Glu-B3, and Glu-D3, are located on the short arms of chromosomes 1A, 1B, and 1D, respectively (McIntosh et al. 2003). Those for high molecular weight glutenins are located at the Glu-A1, Glu-B1, and Glu-D1 loci on the long arms of the same chromosomes. These genes have multiple alleles (Eagles et al. 2002a), and their chromosomal locations were referenced from Hart et al. (1993), i.e. Glu-A3 is located at −52.4 cM on 1AS, Glu-A1 at 14.9 cM on 1AL, Glu-B3 at −46.4 cM on 1BS, Glu-B1 at 15.5 cM on 1BL, Glu-D3 at −33.6 cM on 1BS, and Glu-D1 at 18.7 cM on 1BL. The recombination frequencies between 2 genes on the same chromosome were then estimated using Kosambi’s mapping function r = 12 [(e4m − 1)/(e4m + 1)] where m is the distance in Morgan (1 M = 100 cM) between 2 loci, and r is the recombination frequency (Kosambi 1944). The effects of these alleles on dough rheological characters, maximum dough resistance (Rmax), and dough extensibility have been estimated using data from wheat breeding programs in Australia using mixed model statistical analyses (Eagles et al. 2002a, 2002b, 2002c, 2004). To maintain consistency with these earlier papers, we have continued to use the designation Glu-B1b for the allele with the 7 + 8 protein bands. Each allele has pleiotropic effects on both traits (Table 1) and di-genic epistatic effects exist for some pairs of the 6 genes (Eagles et al. 2002a). For this study, the effects were derived from the analysis of the southern Australian dataset, as described by Eagles et al. (2002c), and included digenic epistatic effects for
Table 1. Main effects of each allele of the 6 glutenin genes, adapted from table 1 of Eagles et al. (2004) Locus
Allele (syn. name, if any)
Rmax (BU)
Extensibility (cm)
Glu-A3
b c d e a (1) b (2*) c (Null) b d g h al b (7 + 8) c (7 + 9) e (20) f (13 + 16) i (17 + 18) a b c a (2 + 12) d (5 + 10)
10.46 −10.55 40.46 −40.55 14.46 25.46 −39.55 27.46 −23.55 −2.55 −0.55 111.46 −7.55 −26.55 −66.55 −3.55 −7.55 5.45 5.45 −11.55 −60.55 60.46
0.35 −0.05 0.35 −0.65 0.35 0.55 −0.86 −0.05 −0.05 0.25 −0.15 2.35 −0.45 −0.56 −0.15 −0.56 −0.56 0.25 −0.15 −0.15 0.15 −0.15
291.55
19.75
Glu-A1
Glu-B3
Glu-B1
Glu-D3
Glu-D1 Mean of the 210 parents
Simulation in parental selection in wheat quality breeding
Australian Journal of Agricultural Research
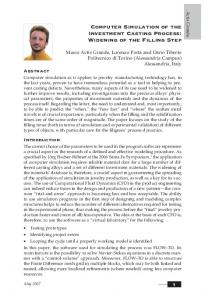
Glu-A1 × Glu-A3, Glu-A1 × Glu-D3, Glu-B1 × Glu-D1, Glu-B1 × Glu-B3, Glu-A3 × Glu-B3, and Glu-B3 × Glu-D3 for Rmax, and Glu-A1 × Glu-B1 for dough extensibility. The broad-sense heritability is ∼0.75 for Rmax and 0.42 for extensibility (Eagles et al. 2002b). Estimation of effects used both cultivars and unreleased breeding lines. For 210 cultivars, there is a wide range of variation for both predicted Rmax and extensibility (Fig. 1a). The average values were 302.67 BU in Rmax, and 20.02 cm in extensibility. The standard deviations were 44.03 BU in Rmax, and 0.68 cm in extensibility. The correlation between the 2 traits in the parental population is low [r = 0.10 (n.s.)]. As far as individual alleles are concerned, some have a positive (or negative) effect on both traits; some have a positive (or negative) effect on one trait but have negative (or positive) effects on the other (Fig. 1b). The correlation of allele effects on the 2 traits is high (r = 0.71**). However, the correlation between traits is dependent on the population used. The results reported here for 210 cultivars and allele effects cannot be transferred to other populations with different gene frequencies, especially those derived from any 2 specified parents.
Silverstar is a bread wheat cultivar derived from the cross between Pavon and TM56, where Pavon is a CIMMYT wheat with the pedigree Vicam//Ciano/Siete Cerros/3/Kalyansona/Bluebird and TM56 is a sister line of the Australian cultivar Cocamba [AUS10894/4*Condor (Cane et al. 2004)], from which 8 sister lines, called Silverstar 1 to Silverstar 8, have been identified. Six of these sister lines have been evaluated and they are very similar for heading date and morphological appearance (H. A. Eagles, unpublished). They all have the Cre1 gene for cereal cyst nematode resistance, which is located on chromosome 2B, and are resistant to this nematode. At loci Glu-A1, Glu-B3, and Glu-D3, they have the same alleles (Table 2). At Glu-B1, they have 2 different alleles, b and i, but these 2 alleles have a similar effect on Rmax (Table 1). The 8 lines have alleles b and c at locus Glu-A3, but allele b has a larger effect on Rmax than allele c; and they have alleles a and d at locus Glu-D1, but allele d has a larger effect than allele a (Table 1). So a practical question facing breeders is ‘which line is the best choice for crosses involving Silverstar without losing grain quality?’ Simulation I was specifically designed to find the answer to this question. Four cultivars, Westonia, Krichauff, Machete, and Diamondbird, were selected for simulated crosses with Silverstar in Simulation I. These are cultivars adapted to southern Australia and represent the types of germplasm likely to be crossed to Silverstar in a breeding program. Westonia does not have allele b at Glu-A3 and allele a at Glu-D1. Krichauff does not have allele b at Glu-A3, but has allele a
Parents in crossing
r = 0.10 (ns)
0.6
Allele effect in extensibility (cm)
Genotypic effect in extensibility (cm)
Two simulation experiments were designed to address 2 questions that breeders may commonly encounter. Parents used in the 2 simulations are described as follows.
2.5 (a) 2 1.5 1 0.5 0 –0.5 –1 –1.5 –2 –2.5 –150 –100
r = 0.71**
(b)
0.4 0.2 0.0 –0.2 –0.4 –0.6 –0.8
–50
0
50
–1.0 –80 –60 –40 –20
100
Genotypic effect in Rmax (BU)
0
20
40
60
80
Allele effect in Rmax (BU)
Fig. 1. Scattering distribution of Rmax and extensibility: (a) genotypic effects for Rmax and extensibility of 210 parents; (b) allele effects for Rmax and extensibility of the 6 glutenin loci.
Table 2. Some selected parents, their genotypes at the 6 glutenin loci, and their predicted genetic values for Rmax and extensibility Parent Silverstar 1 Silverstar 2 Silverstar 3 Silverstar 4 Silverstar 5 Silverstar 6 Silverstar 7 Silverstar 8 Westonia Krichauff Machete Diamondbird Trident
467
Glu-A3
Glu-A1
Glu-B3
Glu-B1
Glu-D3
Glu-D1
Rmax (BU)
Extensibility (cm)
b c b c b c b c c c b b e
a a a a a a a a b a b a a
h h h h h h h h h b b h h
b b b b i i i i i c i i c
b b b b b b b b c a b b c
a a d d a a d d a d a d d
309.80 270.20 382.70 343.10 300.60 261.00 368.90 329.30 283.71 312.26 312.03 368.88 306.97
20.78 20.31 20.24 19.77 20.69 20.22 20.15 19.68 19.70 19.39 19.95 20.16 18.71
468
Australian Journal of Agricultural Research
J. Wang et al.
at Glu-D1. Machete has allele b at Glu-A3 but does not have allele a at Glu-D1. Diamondbird has allele b at Glu-A3 and allele a at Glu-D1 (Table 2). Krichauff and Machete have very similar Rmax and extensibility values (Table 2). The question is: does it make any difference which variety is used as a parent for improving grain quality in a cross? Simulation II was designed to address this question, and the 2 Australian cultivars Trident and Westonia were used to cross with Krichauff and Machete (Table 2). Selection process Relevant single crosses were made by QuCim between the 4 selected parents and the 8 Silverstar sister lines. For each cross, 1000 F8 lines were developed from 1000 F2 individual plants by single seed descent (Fig. 2). Forty F8 lines were finally selected, based on line performance for Rmax and/or extensibility, resulting in a selected proportion of 0.04. Four selection schemes were considered in Fig. 2: (1) the 40 lines were selected based only on line performance for Rmax (R0.04); (2) 200 lines were first selected based on line performance for Rmax and subsequently 40 lines were selected based on extensibility (R0.2E0.2); (3) 200 lines were first selected based on line performance for extensibility and then the 40 lines were selected based on Rmax (E0.2R0.2); and (4) 40 lines were selected based only on line performance for extensibility (E0.04) (Fig. 2). To study differences resulting from various selected proportions, we also simulated a lower selected proportion of 0.25. The 4 selection methods corresponding to this proportion are R0.25, R0.5E0.5, E0.5R0.5, and E0.25. The selected proportion of 0.04 was only used in Simulation I, and 2 selected proportions were used in Simulation II. Each selection process was repeated 100 times, and the mean performance in the final selected population was used to compare the merits from each process.
Results Simulation I: Which Silverstar sister line to use in specific crosses? For crosses with Westonia, Silverstar 3 and 7 showed the largest improvement in Rmax when Rmax was used in selection (i.e. R0.04, R0.2E0.2, and E0.2R0.2) (Fig. 3a). They can also improve extensibility in combination with Westonia, particularly when selecting for extensibility (i.e. R0.2E0.2 and E0.2R0.2) (Fig. 3b). When high Rmax and extensibility together are the required quality traits but Rmax is more important, they are both parents of choice; however, Silverstar 3 is the better of the two. For crosses with Krichauff, if selection is solely for Rmax, or if it is selected first when both traits are targetted for selection (i.e. R0.04 and R0.2E0.2), Silverstar 1, 3, 5, and 7 can result in similar improvements in Rmax and extensibility (Fig. 3c, d). If selection is solely for extensibility, or if extensibility is selected for first when both traits are targetted for selection (i.e. E0.2R0.2 and E0.04), then Silverstar 3 and 7 are the best parents for improving both traits in crosses with Krichauff. For crosses with Machete, Silverstar 3, 4, 7, and 8 are the best parents to improve Rmax if it is the only trait selected, or if it is selected first when both traits are targetted for selection (i.e. R0.04 and R0.2E0.2) (Fig. 3e). However, to improve extensibility simultaneously, Rmax should be selected first and then extensibility (i.e. R0.2E0.2) (Fig. 3f). If extensibility is selected before Rmax, then Silverstar 4 and 8 should be chosen to improve both traits in crosses with Machete. For crosses with Diamondbird, the use of Silverstar 1, 2, 3, and 4 can cause a slight increase in Rmax and extensibility if Rmax is the trait targetted for selection (i.e. R0.04 and R0.2E0.2) (Fig. 3g, h). If extensibility is targetted
Parent 1 × Parent 2
F1
F2: 1000 individuals
F8: 1000 lines through SSD
R0.04 R0.2E0.2 E0.2R0.2 E0.04 Trait to be Lines Trait to be Lines Trait to be Lines Trait to be Lines selected selected selected selected selected selected selected selected 40 40 Step 1 Rmax Rmax 200 Extensibility 200 Extensibity 40 40 Step 2 n.a. Extensibility Rmax n.a. Fig. 2. Schematic representation of the selection process used in simulation.
Simulation in parental selection in wheat quality breeding
(a )
400
7
4
8
20.8
3
7
8 1
5
5
2 5
3
3 5 2 4
3 4
2 4 6
67
4 67
5 7
469
1 3
1 5
20.2
1 3
45
2
1
1 2
1
1 2
280
(b)
3
7 4
360
21.4
Westonia
3
320
Australian Journal of Agricultural Research
5 7
7
6 8
8
8
19.6
2
2 4
6 8
6
240
6
6 8
19.0
Krichauff
21.4
8
(c ) 400 360
1 3 5 7
3
1
2 4 6 8
2 4
3
7
5
3
7
7
6
45
8
20.8
4
8
20.2 1
Rmax (BU)
5
6 2
6
(e ) 7
34
8
78
34
Machete
360 320
8
4 12
56
12
12
123
280 240 400 360
21.4
5 7
2
5 23
5
3
67 4
6 8
67 4
8
8
6 8
(f ) 12
12
20.8 20.2
678 45
1
19.0
7
3 56
56
2 4
5 7
19.6
240 400
1 3 2 4
Extensibility (cm)
2
1 3
8
320 280
(d ) 1
1
56
12
5 3
1234 3
456
34
6
5678 7 8
78 4 7
19.6
8
19.0
(g ) 1234
Diamondbird 5 7 6 8
1234
34 78
34
78
21.4
78
12
20.8
56
20.2
320 1
280
(h)
2 5
6
12
12345 7
123456
78
12
56 34
78
56 34
78
6 8 56
240
19.6 19
R0.04
R0.2E0.2
E0.2R0.2
E0.04
R0.04
R0.2E0.2
E0.2R0.2
E0.04
Selection scheme (trait followed by selected proportion)
Fig. 3. Rmax and extensibility in the final selected population from each cross among the 4 selected parents Westonia, Krichauff, Machete, and Diamondbird, and the 8 Silverstar sister lines. The number on each bar represents the respective 8 Silverstar sister lines. X-axis crosses at the extensibility value of the parent to be crossed with Silverstar sister lines. For a selected trait: R, Rmax; E, extensibility; for a selected proportion, 0.2 means 20% of lines will be selected, and 0.04 means 4% of lines will be selected.
for selection (i.e. E0.2R0.2 and E0.04), then only Silverstar 3 and 4 improve both traits slightly. As mentioned above, the 8 Silverstar lines have differences at loci Glu-A3 and Glu-D1 (Table 2). At locus Glu-A3, allele b has an effect of 10.46 BU on Rmax, whereas allele c has an effect of −10.55 BU. At locus Glu-D1, allele d has an effect of 60.46 BU, whereas allele a has an effect of
−60.55 BU. Westonia does not have allele b at Glu-A3 and lacks allele a at Glu-D1. So the lines with allele b at Glu-A3 and allele a at Glu-D1 should have the largest potential to improve Rmax in combination with Westonia; these are Silverstar 3 and 7 (Fig. 3a). The difference between these 2 parents comes from pleiotropic effects on extensibility (Table 1). Krichauff does not have allele b at Glu-A3, so
470
Australian Journal of Agricultural Research
lines having b at Glu-A3, i.e. Silverstar 1, 3, 5, and 7, should have a similar potential to improve Rmax in crosses with this parent (Fig. 3c). Machete does not have allele a at Glu-D1, so the lines having b at Glu-D1, i.e. Silverstar 3, 4, 7, and 8, have the potential to improve Rmax (Fig. 3e). In contrast, Diamondbird has allele b at Glu-A3 and allele a at Glu-D1 (Table 1); neither line produces significant improvement in Rmax (Fig. 3g). When only one trait is considered as the breeding objective, the best Silverstar lines can be easily identified from Fig. 3 to improve the selected parents (Table 3). Firstly, the best lines should result in at least a 5% increase in the target trait (i.e. Diamondbird in Table 3). Secondly, if all 8 lines have significant differences, only the first 2 are chosen (i.e. Westonia in Table 3). Thirdly, if 2 or more lines are not different, all lines are chosen (i.e. Krichauff in Table 3). Clearly, parental selection depends on the breeding objective and definition of the selection scheme. In most instances, the lines that can improve Rmax are not the best lines for improving extensibility. Simulation II: Between Krichauff and Machete, which is the best parent to improve Rmax and extensibility in crosses with Trident and Westonia? In breeding, both general combining ability and specific ability are important. Krichauff and Machete have similar Rmax values, both predicted and actual (Eagles et al. 2002c), but differ in allele combinations (Table 2). Which of these 2 parents is better to use in crosses with 2 different backgrounds, Trident and Westonia (Table 2)? Figure 4a and b shows that both Krichauff and Machete can improve the 2 target quality traits in Trident for all selection schemes, except when extensibility is the only target trait. However, crosses with Machete give a greater improvement. In addition, selection for Rmax also results in improving extensibility, indicating a positive correlation between the 2 traits in this specific cross. The result is very different for Westonia (Fig. 4c, d). For selection methods in which Rmax is the only target
J. Wang et al.
trait for selection, or Rmax is selected first (i.e. R0.25, R0.5E0.5, R0.04, and R0.2E0.2), Krichauff is the better parent for improving Rmax. For R0.25 and R0.04 in which Rmax is the only trait targetted for selection, extensibility in the selected population will decrease. For R0.5E0.5 and R0.2E0.2, extensibility is kept at the same level as for Westonia. In this case, extensibility can only be improved through direct selection for this character. So the result here is that Trident should be crossed with Krichauff, and Westonia should be crossed with Machete, if Rmax is the most important target trait. On the other hand, if extensibility is more important, Trident should be crossed with Machete. For Westonia, both Krichauff and Machete can be used, but Krichauff has a greater potential to improve Rmax in Trident. Discussion Choosing the right parents to make crosses is essential in breeding, and so is the selection scheme to be applied. As demonstrated in this study, this even applies with very closely related parents, such as the Silverstar sister lines. Without a full understanding of the gene action and gene interaction of the traits involved in selection, it is impossible to precisely predict the outcome from a cross. The genetic model used in this study included linkage, multiple alleles, pleiotropy, and digenic epistasis. However, the same analyses were performed using only the main effects in Table 1, and similar results were obtained (results not presented), suggesting that they were not important for these particular crosses. However, they could be important for other crosses, and this study demonstrates how they can be included in making cross predictions, which are even more likely to be needed for complex traits like grain yield (Holland 2001). Gene × environment interactions were not included. However, these are important in breeding for the glutenin genes. Eagles et al. (2002b) found evidence for a Glu-D1 × environmental interaction. They suggested that this might be due to an interaction with temperature during the
Table 3. The best Silverstar sister lines for the 4 selected parents, under different breeding objectives Selected parent
Breeding objective
Westonia
High Rmax High extensibility High Rmax High extensibility High Rmax High extensibility High Rmax High extensibility
Krichauff Machete Diamondbird A
Selection scheme (trait followed by selected proportion)A R0.04 R0.2E0.2 E0.2R0.2 E0.04 3, 7 1 1, 3, 5, 7 1, 3, 5, 7 3, 4, 7, 8 1, 2, 5, 6 1, 2, 3, 4 None
3, 7 1, 5 1, 3, 5, 7 1, 3, 5, 7 3, 4, 7, 8 1, 2, 5, 6 1, 3, 4 None
3, 7 1, 3, 5 3, 7 1, 5 4, 8 1, 2, 3 3, 4 1, 2, 5, 6
1, 3 1, 3, 5, 7 3, 7 1, 5 None 1, 2, 3, 4 3, 4 1, 2, 5, 6
For a selected trait: R, Rmax; E, extensibility; for a selected proportion, 0.2 means 20% of lines will be selected, and 0.04 means 4% of lines will be selected.
Simulation in parental selection in wheat quality breeding
400
(a)
386
373
373
338
337
337
328
(b )
471
20.6 20.3
20.2
20.2
347
342 329
20.8
Trident crossed with Krichauff and Machete
357
356
360
Australian Journal of Agricultural Research
19.9
335
20.0
19.9
327
19.6
320
19.5 19.4
19.5
19.5
19.4
19.3
19.3
19.3
304 297
19.0
240 400
Krichauff
Machete Westonia crossed with Krichauff and Machete
(c ) 374
360
360
355
Extensibility (cm)
Rmax (BU)
280
19.0
18.9
18.4 20.8
Krichauff
Machete
(d ) 20.4 20.1
20.2
20.0
334
20.0
20.1
20.1 20.0 20.1
20.1
19.9
19.9
19.9 19.7 320
320
314
313
314
307
306
317
316
19.6
305
19.7
304 19.4
280
19.4
19.0 271 263
240
18.4 R0.25
R0.5E0.5 E0.5R0.5
E0.25
R0.04
R0.2E0.2 E0.2R0.2
E0.04
R0.25
R0.5E0.5 E0.5R0.5
E0.25
R0.04
R0.2E0.2 E0.2R0.2
E0.04
Selection scheme (trait followed by selected proportion)
Fig. 4. Rmax and extensibility in the final selected population from each cross between the 2 parents Trident and Westonia, and Krichauff and Machete. X-axis crosses at the extensibility value of Trident or Westonia. For a selected trait: R, Rmax; E, extensibility; for a selected proportion, 0.2 means 20% of lines will be selected, and 0.04 means 4% of lines will be selected.
early part of grain filling. Inclusion of these interactions is possible in QuCim, which would allow for a more comprehensive prediction. Again, this is likely to be more important for grain yield, in which genotype × environment interactions are known to be both complex and important in Australia (Basford and Cooper 1998). The outcome from a cross is dependent on how selection is conducted. When more than one trait is involved in selection, the order of the traits in selection can have a significant effect on the outcome in some crosses (e.g. Figs 3a, b, e, f, g, h; 4c, d), but may have a slight effect in other crosses (e.g. Figs 3c, d; 4a, b). When the order has a great effect, the more important trait should be selected first to optimise its improvement. When the order does not have a great effect, the trait for which phenotype determination is least expensive should be selected first to minimise cost. There are other cases where selection of one trait can cause improvement in another without direct selection (e.g. Fig. 4a, b). In these cases, selection can be conducted based on 1 trait instead of 2, thereby reducing costs. It is commonly accepted that high selection intensity results in high genetic gain. But when multiple traits are
involved in selection, high selection intensity of the first-order traits leaves little genetic variation in the selected population for secondary trait selection. When lower selection intensity achieves satisfactory results, the lower intensity should be applied, thereby providing opportunity to select other traits. The cross between Trident and Machete provided evidence for this type of outcome. For the selection scheme in which Rmax was selected first, followed by extensibility, and the total selected proportion was 0.04 (i.e. R0.2E0.2), Machete improved Rmax in Trident from 307 BU to 373 BU, or by 21% (Fig. 4a). In this instance, 40 lines were selected and were available for selecting for other traits such as yield and disease resistance. When the selected proportion was 0.25, Rmax in the selected population, which consisted of 250 lines, was 356 BU, or an increase of 16% (Fig. 4a); although not as great as when the selected proportion was 0.04, it was a significant increase. Nevertheless, more lines retained in the selected population (250 v. 40) will provide greater genetic diversity for the improvement of secondary traits. The 2 selection schemes R0.2E0.2 and E0.2R0.2 are independent culling level selection approaches (Falconer and Mackay 1996). It needs to be confirmed whether similar
472
Australian Journal of Agricultural Research
results will be achieved if a selection index is used. The 6 glutenin genes used in this simulation study account for about half of the variation in Rmax (Eagles et al. 2002b). More genes need to be identified. As the field of plant genomics develops, more genes for more traits will be detected. Currently, the limitation is not computer simulation; it is access to the gene information needed to provide accurate predictions (Wang et al. 2004). With more complete gene information, QuCim should give more precise predictions on cross performance under various selection schemes. Although wheat quality was used in this study, the approach introduced in this paper will have a much wider applicability in the near future in many traits and in many crops. With the advent of molecular technologies, we have an enormous amount of data, both on the phenotype and on the genotype (Cooper and Podlich 2002). It is not clear how we are going to combine all these sources of data such that the data become ‘knowledge’ that can be used by the breeding program. The transformation of data into knowledge requires powerful statistical analysis approaches that often necessitate the incorporation of gene × gene and gene × environment interaction effects. This is an important component in any such study and should not be underestimated. The whole validity of this approach relies on a reasonable gene-tophenotype model. The gene-to-phenotype statistical analysis alone does not necessarily help the breeding program. Instead there needs to be a ‘front-end’ analysis that enables breeders to extract the important and relevant aspects of the analysis in a format usable to the day-to-day operation of the breeding program. In this paper, we use computer simulation to investigate ‘what-if’ crossing scenarios. This allows many scenarios to be tested in silico in an extremely short amount of time. Thus, what we describe in this paper is the result of a tactical or decision support tool that uses a sophisticated gene-to-phenotype model, allelic information on relevant germplasm, and a front-end simulation to investigate questions and alternatives that a breeder may have. Our understanding of gene-to-phenotype relationships will further evolve. The preliminary results from this simulation study need to be further tested through field experimentation. Also the predictions need to be adjusted using more gene-to-phenotype information, as more becomes available. The identification of noted discrepancies between simulation and field evaluation will provide the basis for continued modification and development of our genetic model. Acknowledgments This research was funded by the Grains Research and Development Corporation (GRDC) and the Molecular Plant Breeding CRC (CRCMPB), Australia. We thank Dr Russell
J. Wang et al.
Eastwood, Australian Grain Technologies, for information on the Silverstar isolines, and Mr Geoff Cornish, South Australian Grain Technologies, for assistance with the glutenin classifications. References Allard RW (1960) ‘Principles of plant breeding.’ (John Wiley and Sons: New York) Basford KE, Cooper M (1998) Genotype × environment interactions and some considerations of their implications for wheat breeding in Australia. Australian Journal of Agricultural Research 49, 153–174. doi: 10.1071/A97035 Bernardo R (2002) ‘Breeding for quantitative traits in plants.’ (Stemma Press: Woodbury, MN) Bhatt GM (1973) Comparison of various methods of selecting parents for hybridization in common bread wheat (Triticum aestivum L.). Australian Journal of Agricultural Research 24, 457–464. doi: 10.1071/AR9730457 Bohn M, Utz HF, Melchinger AE (1999) Genetic similarities among winter wheat cultivars determined on the basis of RFLPs, AFLPs, and SSRs and their use for predicting progeny variance. Crop Science 39, 228–237. Busch RH, Janke JC, Frohberg RC (1974) Evaluation of crosses among high and low yielding parents of spring wheat (Triticum aestivum L.) and bulk prediction of line performance. Crop Science 14, 47–50. Cane K, Spackman M, Eagles HA (2004) Puroindoline genes and their effects on grain quality in southern Australian wheat cultivars. Australian Journal of Agricultural Research 55, 89–95. doi: 10.1071/AR03108 Cooper M, Podlich DW (2002) The E(NK) model: extending the NK model to incorporate gene-by-environment interactions and epistasis for diploid genomes. Complexity 7, 31–47. doi: 10.1002/cplx.10044 Eagles HA, Eastwood RF, Hollamby GJ, Martin EM, Cornish GB (2004) Revision of the estimates of glutenin gene effects at the Glu-B1 locus from southern Australian wheat breeding programs. Australian Journal of Agricultural Research 55, 1093–1096. doi: 10.1071/AR04113 Eagles HA, Hollamby GJ, Eastwood RF (2002b) Genetic and environmental variation for grain quality traits routinely evaluated in southern Australian wheat breeding programs. Australian Journal of Agricultural Research 53, 1047–1057. doi: 10.1071/AR01074 Eagles HA, Hollamby GJ, Eastwood RF, Cornish GB, O’Connor RJ, Martin PJ (2002c) Using glutenin genes for predicting quality in wheat breeding. In ‘Proceedings 52nd Australian Cereal Chemistry Conference’. (Eds CK Black, JF Panozzo, CW Wrigley, IL Batey, N Larsen) pp. 198–201. (Cereal Chemistry Division, Royal Australian Chemical Institute: North Melbourne, Vic.) Eagles HA, Hollamby GJ, Gororo NN, Eastwood RF (2002a) Estimation and utilisation of glutenin gene effects from the analysis of unbalanced data from wheat breeding programs. Australian Journal of Agricultural Research 53, 367–377. doi: 10.1071/AR01074 Falconer DS, Mackay TFC (1996) ‘Introduction to quantitative genetics.’ 4th edn (Longman: Essex, UK) Fehr WR (1987) ‘Principles of cultivar improvement. Vol. 1. Theory and technique.’ (Macmillian Publishing Company: New York)
Simulation in parental selection in wheat quality breeding
van Ginkel M, Trethowan R, Ammar K, Wang J, Lillemo M (2002) ‘Guide to bread wheat breeding at CIMMYT (rev). Wheat Special Report No. 5.’ (CIMMYT: D.F., Mexico) Hart GE, Gale MD, McIntosh RA (1993) Linkage maps of Triticum aestivum (hexaploid wheat, 2n = 42, genomes A, B, and D) and T. tauschii (2n = 14, genome D. In ‘Genetic maps: locus maps of complex genomes’. (Ed. SJ O’Brien) pp. 6.204–6.219. (Cold Spring Harbor Laboratory Press: Long Island, NY) Holland JB (2001) Epistasis and plant breeding. Plant Breeding Reviews 21, 27–92. Kosambi DD (1944) The estimation of map distances from recombination values. Annual Eugenics 12, 172–175. McIntosh RA, Yamazaki Y, Devos KM, Dubcovsky J, Rogers J, Appels R (2003) MacGene 2003: catalogue of gene symbols for wheat (CD-ROM). In ‘10th International Wheat Genetics Symposium’. Paestum, Italy. (Istituto Sperimentale per la Cerealicoltura: Roma, Italy) Payne PI (1987) Genetics of wheat storage proteins and the effect of allelic variation on bread-making quality. Annual Review of Plant Physiology 38, 141–153. doi: 10.1146/annurev. pp.38.060187.001041 Podlich DW, Cooper M (1998) QU-GENE: a platform for quantitative analysis of genetic models. Bioinformatics 14, 632–653. doi: 10.1093/bioinformatics/14.7.632
Australian Journal of Agricultural Research
473
Tanksley SD, Nelson JC (1996) Advanced backcross QTL analysis: a method for the simultaneous discovery and transfer of valuable QTLs from unadapted germplasm into elite breeding lines. Theoretical and Applied Genetics 92, 191–203. doi: 10.1007/ s001220050114 Utz HF, Bohn M, Melchinger AE (2001) Predicting progeny means and variances of winter wheat crosses from phenotypic values of their parents. Crop Science 41, 1470–1478. Wang J, van Ginkel M, Podlich D, Ye G, Trethowan R, Pfeiffer W, DeLacy IH, Cooper M, Rajaram S (2003) Comparison of two breeding strategies by computer simulation. Crop Science 43, 1764–1773. Wang J, van Ginkel M, Trethowan R, Ye G, DeLacy I, Podlich D, Cooper M (2004) Simulating the effects of dominance and epistasis on selection response in the CIMMYT Wheat Breeding Program using QuCim. Crop Science 44, 2006–2018. Weber WE (1979) Number and size of cross progenies from a constant total number of plants manageable in a breeding program. Euphytica 28, 453–456. doi: 10.1007/BF00056604 Yonezawa K, Yamagata H (1978) On the number and size of cross combinations in a breeding programme of self-fertilizing crops. Euphytica 27, 113–117. doi: 10.1007/BF00039125 Manuscript received 17 November 2004, accepted 31 March 2005
http://www.publish.csiro.au/journals/ajar