Swiss Simmental and Red & White cattle. Genetic co- variances were approximated using breeding values for herd life from a survival analysis and BLUP ...
J. Dairy Sci. 85:1556–1562 American Dairy Science Association, 2002.
Using Conformation Traits to Improve Reliability of Genetic Evaluation for Herd Life Based on Survival Analysis N. Vukasinovic,* Y. Schleppi,† and N. Ku¨nzi‡ *Department of Mathematics and Statistics, Utah State University, Logan 84322 †Swiss Simmental and Red & White Association, Zollikofen, Switzerland ‡Animal Breeding Group, Swiss Federal Institute of Technology, Zurich, Switzerland
ABSTRACT Genetic evaluation for herd life based on survival analysis utilizes information available on all animals, dead (uncensored) and alive (censored), but the reliability of bulls’ breeding values depends only on the number of uncensored daughters. Therefore, information on correlated conformation traits scored on daughters during their first lactation may be essential for the evaluation of young bulls with mostly censored daughters. Currently available programs for genetic evaluation based on survival analysis cannot combine indirect information on conformation traits with direct information on herd life, nor can they estimate genetic covariances between herd life and conformation traits. In this study, an alternative approach has been developed and tested using data on Swiss Simmental and Red & White cattle. Genetic covariances were approximated using breeding values for herd life from a survival analysis and BLUP breeding values for 26 linear conformation traits from a separate multivariate analysis. An index combining direct breeding values for herd life and indirect breeding values obtained from conformation traits was constructed. The relative weighting of both information sources varied depending on the amount of available information. The maximum reliability based only on conformation traits was 0.64. Except for old bulls with >100 uncensored daughters, the combined reliability was always higher than the direct reliability from survival analysis. (Key words: herd life, survival analysis, conformation trait, index) INTRODUCTION In livestock production, particularly in dairy cows, herd life of breeding stock is a highly desirable trait that
Received October 7, 2001. Accepted January 9, 2002. Corresponding author: N. Vukasinovic; e-mail: vukasino@sunfs. math.usu.edu.
has a substantial impact on the economic efficiency of milk production. An increased herd life is associated with reduced replacement costs and increased possibility for selection on other traits. The need to consider herd life in selection programs in addition to economic traits such as milk yield has increased in the last two decades, because herd life in many dairy population has deteriorated due to intensive selection on productivity. However, considering herd life in selection programs is associated with problems because some of the animals are still alive in the moment of genetic evaluation, and only a lower bound of their herd life is known, i.e., such observations are censored. Treating such observations as exact, or excluding them from the analysis would lead to biased results. Waiting until all daughters of a bull have completed their herd life is unfeasible. In an attempt to deal with censored records, animal researchers defined binary measures such as stayability, which shows whether a cow survives to a given age (Everett et al., 1976) or lactation (Schaeffer and Burnside, 1974). Stayability is, however, not an ideal indicator of herd life, because the binary nature of the trait imposes a great loss of information. Recently, the use of methods based on survival analysis has been proposed for analysis of herd life data and genetic evaluation of animals for this trait (Smith and Quaas, 1984; Ducrocq, 1987, 1997). Survival analysis combines information on dead (uncensored) and alive (censored) animals and provides proper statistical treatment of censored records. The aim of genetic evaluation for herd life is to estimate the breeding value of a bull for this trait based on the herd life of his daughters. Improving herd life in a population by selecting and using bulls that transmit longer herd life requires genetic evaluation that is reliable and provides proofs for all bulls as early as possible, ideally immediately after the first lactation of a bull’s first-crop daughters. Theoretically, methods based on survival analysis permit evaluation of a bull for herd life of his daughters before the bull is used extensively throughout the cow population.
1556
1557
HERD LIFE AND CONFORMATION TRAITS
However, even though the complete available information is utilized, the reliability of genetic evaluation of bulls is low when the proportion of censored records is large. This is the case in young bulls having daughters without culling data. For such bulls, a reliable evaluation result arrives at least 2 yr after the first calving of their daughters, which is approximately 1 yr later than the results for milk yield and, thus, usually too late for direct selection on herd life. The reliability of evaluation for herd life for young bulls is enhanced by considering information on correlated traits that can be measured early in the life of a bull’s daughters. In practice, conformation traits have been used for many decades as indirect selection criteria for herd life. Numerous studies have been conducted over the past years to identify and quantify the influence of conformation traits on herd life in dairy cows (e.g., Boldman et al., 1992; Dekkers et al., 1994; Vollema et al., 2000). Conclusions drawn from these studies indicate that cows with desirable body proportions, healthy udders and teats, and correct feet and legs usually have a longer herd life, because they are more likely to withstand the stress of milk production, and they remain fertile and healthy. Conformation traits are recorded in the first lactation of the cow, have higher heritability than herd life, and have moderate correlations with herd life (Jairath et al., 1998). Methods that use both direct information on herd life and indirect information obtained from conformation traits have recently been developed by Weigel et al. (1998) and Jairath et al. (1998). Both information sources are combined into one index after being appropriately weighted depending on reliability and genetic covariances between conformation traits and herd life. However, both approaches use breeding values for herd life that are estimated by traditional BLUP methods. The BLUP methods are considered suboptimal for herd life data (Vukasinovic et al., 2001). The current methods for genetic evaluation for herd life based on survival analysis cannot combine information on conformation traits with information on herd life and, therefore, cannot be used to estimate genetic covariances between the conformation traits and the herd life. To overcome the problem of unknown genetic covariances between herd life and conformation traits, an approximation must be used. In this paper, we propose an extension of the approach described by Weigel et al. (1998) based on an index that combines direct information on herd life from survival analysis with indirect information from conformation traits. The implementation of the index in Swiss Simmental and Red & White cattle is described. MATERIALS AND METHODS Genetic Evaluation for Herd Life Genetic evaluation for herd life in dairy cattle is usually based on a Weibull survival model:
λ(t) = λ0(t) exp{X′β + Z′s}. The hazard, or the risk of a cow being culled at time t, λ(t), is described as the product of a baseline hazard function, λ0(t), that follows a Weibull distribution and describes the aging process of the population, and the exponential function of explanatory variables, or stress factors, either fixed (β) or random (s), that supposedly influence culling process and may be time-dependent. The random sire effect, s, is assumed to follow a multivariate normal distribution with a variance-covariance matrix Aσs2. The solutions for random sire effects, s, are obtained along with solutions for fixed effects, β, using the software “Survival Kit V.3.0” (Ducrocq and So¨lkner, 1998). Generally, the reliability of genetic evaluation is defined as a squared correlation between the true (unknown) and the estimated breeding value of an animal. The reliability of genetic evaluation for herd life for each sire is calculated as n/(n+k), where n = number of uncensored daughters, and k = ratio between the residual and the sire variance, σe2/σs2. In a sire model in which the sire of a cow is the only carrier of the estimable genetic effect, the term k is equal to (4 − h2)/h2, with h2 being the heritability. The heritability of the herd life obtained from survival models takes into account only uncensored records (Ducrocq, 1997). The current procedure for obtaining reliability of estimated breeding values from survival analysis takes into account a bull’s own uncensored daughters and available pedigree information, i.e., the reliability of the estimated breeding value of the bull’s sire (Vukasinovic et al., 2001). However, even if the pedigree information is included, the reliability of a young sire without uncensored daughters on his own cannot exceed 0.25. Thus, considering censored daughters of a sire has an impact on the breeding value but no impact on the reliability of evaluation. As a result, the reliability of genetic evaluation for young sires with a large proportion of censored daughters is low. Indirect Evaluation for Herd Life Using Correlated Conformation Traits If the t observed conformation traits are genetically correlated with an unobserved trait, e.g., herd life, the prediction of the breeding value of a sire for the unobserved herd life (sˆind) can be obtained as a linear function of sˆ, the sire’s breeding values for the t observed conformation traits (Henderson, 1977): sˆind sˆind sˆind sˆind
= = = =
Cov(sind, s)′[Var(s)]−1sˆ (gtn ⊗ A)′(G−1 ⊗ A−1)sˆ (gtn′G−1) ⊗ Iqsˆ (wt ⊗ Iq)sˆ Journal of Dairy Science Vol. 85, No. 6, 2002
1558
VUKASINOVIC ET AL.
where: sˆind = 1*q vector of estimated breeding values for the unobserved herd life (q = number of sires); sind = 1*q vector of true breeding values for herd life; s = tq*1 vector of true breeding values for t conformation traits; sˆ = tq*1 vector of estimated breeding values for t conformation traits; G = t*t matrix of genetic (co)variances among the conformation traits; gtn = t*1 vector of genetic covariances between the herd life and the t conformation traits; A = q*q additive relationship matrix; and wt = t*1 vector of weights for obtaining indirect breeding values for herd life from the estimated breeding values for t conformation traits. The weights are obtained as a simple function of genetic variances and covariances between the traits, i.e., wt = gtn′G−1. The maximal reliability of the indirect evaluation would be max RELind
Cov(sind, s)′ [Var(sˆ)]−1Cov(sind, s) = Var(sind)
if the breeding values for the conformation traits were estimated without error. In this case, Var(s) would be equal to Var(sˆ). However, as this is never the case, the reliability of the indirect evaluation is calculated as: RELind =
Cov(sind, s)′ [Var(s)]−1 [Var(sˆ)][Var(s)]−1 Cov(sind, s) Var(sind)
Boldman et al. (1992) developed a simple approximation procedure to calculate reliability of the indirect evaluation. The approximate reliability of indirect evaluation for each sire for an unobserved trait equals 1-c/gnn, where gnn is the genetic variance of the unobserved trait, and c corresponds to the last element of the t+1 × t+1 matrix. ˆ = C
−1 (R
It × p) 0 −1 + G−1 , + 0 0
where: R = t × t matrix of residual (co)variances among the t conformation traits; p = number of progeny of the sire with conformation scores, and Journal of Dairy Science Vol. 85, No. 6, 2002
G+ =
G gnt
gtn gnn
Combining Direct and Indirect Breeding Values for Herd Life in an Index Direct breeding values (from survival analysis) and indirect breeding values (derived from the breeding values for conformation traits) are combined in an index as follows: sˆ comb = wdirsˆ dir + windsˆind where: sˆcomb = combined breeding value for herd life; sˆdir = direct breeding value for herd life (from survival analysis); sˆind = indirect breeding value for herd life derived from conformation traits; wdir, wind = weights for direct and indirect information, respectively. The weights for the direct and the indirect information can be calculated as follows (Weigel et al., 1998): wdir =
1 − RELind × c 1 − RELindⴢRELdir × c2
wind =
1 − RELdir × c 1 − RELindⴢRELdir × c2
where RELdir and RELind are the reliabilities of directly and indirectly estimated breeding values for herd life, respectively, and c = 1 + [NDboth/NDdirNDind] ×
2 2 2 )/(hdir hind ). √ (4 − h2dir)(4 − hind
NDboth is the number of progeny with both conformation scores and culling data, NDdir is the number of daughters with culling data only, NDind is the number 2 is the heriof progeny with conformation scores only, hdir 2 tability of herd life, and hind is the (average) heritability of the conformation traits. The factor c, which is a measure of the lack of independence between the direct and the indirect evaluation, is a function of direct and indirect trait heritabilities and
1559
HERD LIFE AND CONFORMATION TRAITS
of the proportion of progeny evaluated for conformation traits that also have culling data available. The weights wdir and wind are determined as a function of the reliability of direct and indirect evaluation and the factor c. Note that the sum of the direct and indirect weight is always greater than one. The sum of wdir and wind will equal one only in the limiting case when the factor c and both RELdir and RELind equal one, i.e., if a sire’s direct and indirect breeding values for herd life are obtained on completely independent and infinitely large groups of daughters. Finally, the approximated reliability of the index, RELcomb, is calculated as: RELcomb =
RELdir + RELind − 2RELind ⴢ RELdir × c . 1 − RELind ⴢ RELdir × c2
Implementation For the application of the described method the following data are needed: • estimated breeding values and genetic variance for herd life; • estimated breeding values for conformation traits; • genetic and residual variances and covariances among the conformation traits; • genetic covariances between herd life and conformation traits. Breeding values for herd life were estimated by means of survival analysis for 26,153 sires, using data on approximately 1.13 million daughters supplied by the Swiss Simmental and Red × White Breeding Association. The model used for genetic evaluation for herd life was a Weibull mixed sire-maternal grandsire survival model. The model included the effects of herd-year-season, age at first calving, parity, stage of lactation, alpine pasturing, and milk yield and fat and protein percentage within lactation relative to herd average, as well as the random combined sire and maternal grandsire effect following a multivariate normal distribution with a variance-covariance matrix Aσ2s with σ2s = 0.030, which corresponds to the heritability of herd life of 0.198. Estimated breeding values of sires were obtained in days of herd life after subtracting the reference herd life. The genetic evaluation for herd life is described in Vukasinovic et al. (2001). Breeding values for 31 conformation traits for 445 bulls were also available. The breeding values were estimated with a multivariate linear model, using conformation data scored on a sample of approximately 50 daughters of each bull. Genetic and residual variance and covariances were estimated in 1997 with data collected between June 1992 and May 1997. Conformation scores were available for 26 linear traits and 5 composite traits.
The linear traits were measured (in cm) or scored on a linear scale from 1 to 9, with 1 and 9 indicating the two biological extremes. The composite traits were derived from the linear traits. A detailed description of the conformation traits can be found in Schleppi (1998). Only records with an observation on each of the 31 traits (26 linear traits + 5 composite traits) analyzed were kept. After edits, data set included 6088 records on first-lactating cows. A pedigree file was constructed using two generations of ancestors from the recorded cows. The animal model used for the estimation of variance components included fixed effects of group of farm × zone/region × recording year × recording month, grader × recording year, calving age, days in milk, day time, pasture/barn, tied barn/free barn, and the random animal and residual effect. The same model was applied for all traits. Because there were no missing records, canonical transformation was feasible. Variance components were estimated with the program MTC (Misztal, 1994). Convergence was achieved with 300 rounds of iteration. Only the 26 linear conformation traits were used as predictors of herd life. The variances and covariances of the linear conformation traits estimated by an animal model were appropriately scaled to fit the sire model applied in the evaluation for herd life. The covariances between herd life and 26 conformation traits could not be estimated directly. Instead, genetic correlations were approximated from the correlations between the reliability-adjusted breeding values for herd life and for each of 26 conformation traits, using the method by Calo et al. (1973): rˆg1,2 =
√ ∑REL1 × ∑REL2
∑REL1 × ∑REL2
× r1,2
with REL1, REL2 = reliability of breeding values for herd life and a conformation trait, respectively, and r1,2 = product-moment correlation between the breeding values for herd life and a conformation trait. The genetic covariances were then derived from the approximated genetic correlations and the estimated genetic covariances of the traits using the equation: Cov1,2 = rˆg1,2 ×
√ Var1 × Var2
where Cov1,2 is the genetic covariance between herd life, and a conformation trait, rˆg1,2 is the approximated genetic correlation between herd life and a conformation trait, and Var1 and Var2 are genetic variances of herd life and a conformation trait, respectively. The genetic covariances between herd life and conformation traits were obtained using data on bulls having the breeding values for conformation traits and at least 10 daughters with culling data. Journal of Dairy Science Vol. 85, No. 6, 2002
1560
VUKASINOVIC ET AL.
The estimated and approximated genetic and residual covariances were used to construct G, R, and G+ matrices. The indirect breeding values for herd life were estimated using the procedure described in “Material and Methods” for all sires having breeding values for conformation traits. Then, the procedure of Weigel et al. (1998) was used to calculate the indexes—combined breeding values for all sires. RESULTS AND DISCUSSION The 26 linear conformation traits used to predict breeding values for herd life, their heritabilities, approximated genetic correlations with herd life, and the calculated weights used to obtain indirect breeding values for herd life are given in Table 1. The heritabilities of the conformation traits ranged from 0.17 for general appearance to 0.51 for teat length and were similar to those obtained in other dairy populations (e.g., Weigel et al., 1998). The average heritability of the conformation traits used in the calculation of indirect weights for herd life was 0.325. The approximated genetic correlations ranged from −0.409 for teat length to 0.424 for general appearance. The highest absolute values of genetic correlations were obtained between the conformation traits describing udder, teats, and general appearance. Because breeding values for herd life were
expressed in days, positive genetic correlations indicate that higher conformation scores are associated with a longer herd life. For example, cows with a more desirable general appearance and better, tightly attached udders are more likely to have a longer herd life, whereas those with coarse and long teats are expected to be culled earlier. These genetic correlations are generally comparable to those obtained in a similar fashion in other dairy populations (e.g., Vollema et al., 2000). For traits with intermediate optima, such as pelvis angle, rear leg set, and most of the teat traits, the correlations with herd life might be difficult to explain. Due to curvilinear relationship of these traits with herd life, the most desirable relationship with herd life would result in a zero correlation, indicating that such traits would contribute virtually nothing to herd life. For such situations, some authors (e.g., Diers, 1986) suggest expressing values of these traits as a deviation from the optimum. Such a procedure would ease the interpretation of genetic correlations of these traits with herd life, but it might cause computational problems, since the “natural” structure of genetic variance-covariance matrix would be destroyed. Several of the weights differed from the corresponding genetic correlations in both sign and relative magnitude. Similar findings were reported by Boldman et al. (1992) and Weigel et al. (1998). Because the appropriate weights
Table 1. Linear conformation traits used to estimate indirect breeding values for herd life in Swiss Simmental and Red & White bulls: heritabilities (h2), approximated genetic correlations with herd life (rg), and weights used to calculate indirect breeding values for herd life (w). Trait
h2
rg
w
Height at withers Height at the back Chest circumference Chest width Body depth Pelvis length Pelvis angle Body width Muscularity General appearance
0.45 0.45 0.31 0.20 0.36 0.44 0.37 0.24 0.34 0.17
0.084 0.046 0.009 −0.034 −0.039 −0.076 −0.039 0.040 0.013 0.424
−0.142 0.160 0.033 −0.299 −0.041 −0.184 −0.028 −0.019 0.090 0.297
Rear leg set—side view Hock quality Pasterns Foot angle Rear leg set—rear view Fore udder Fore udder attachment Rear udder Rear udder attachment Suspensory ligament Udder depth Udder quality Teat form Teat length Teat placement Teat position
0.27 0.29 0.22 0.22 0.21 0.42 0.31 0.39 0.36 0.34 0.34 0.18 0.40 0.51 0.48 0.18
−0.122 0.165 0.051 −0.101 0.129 0.320 0.307 −0.004 0.348 0.162 0.358 0.372 −0.246 −0.409 0.111 0.368
0.045 0.072 0.037 0.037 −0.073 0.052 0.141 0.035 −0.034 0.084 0.145 −0.018 −0.079 −0.144 −0.046 0.114
Journal of Dairy Science Vol. 85, No. 6, 2002
HERD LIFE AND CONFORMATION TRAITS
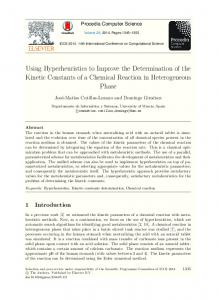
Figure 1. Direct (thick line), indirect (dashed line), and combined (medium line) reliability of evaluation for herd life in Swiss Simmental and Red & White bulls. The indirect breeding values were obtained using data on 20 daughters with conformation scores.
are a function not only of the sire covariances between conformation traits and herd life, but also of the inverse of the sire (co)variance matrix among the conformation traits, the weight for a particular trait can be different from its genetic correlation with herd life. Therefore, the biological meaning of the weight for a particular trait is difficult to interpret, and the weights should be used as a whole set of 26. There have been attempts (e.g., Weigel et al., 1997, 1998) to exclude particular traits that are highly correlated with some other traits and, in this way, reduce problems related to multicollinearity that might lead to unstable predictions for sires with unusual combinations of highly correlated conformation traits. If one or more traits are omitted, the appropriate weights to predict herd life might be different and should be recalculated. From this point of view, the use of a reduced model seems justified. However, using a reduced model results in lower overall reliability of the indirect evaluation. A possible methodological improvement that would not result in reduced reliability is conducting a principal component analysis and identifying factors that could be used in the analysis instead of “raw” conformation traits. However, such a procedure would necessitate increased computational requirements. Figure 1 shows the reliability of direct, indirect, and combined evaluation. The indirect evaluation was based on 20 daughters with conformation scores. For simplicity, the reliabilities of combined evaluation were calculated based on the assumption that the daughters with confirmation scores were the first to be culled and to contribute to the reliability of direct evaluation. The reliability of indirect evaluation based on the conformation scores obtained on 20 daughters was 0.38.
1561
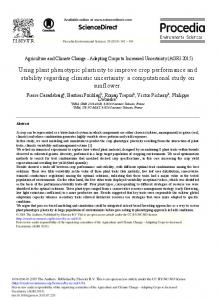
The maximum reliability of indirect evaluation with an infinite number of daughters with conformation scores, but without culling data, was 0.64. The reliability of direct evaluation was low with a small number of uncensored daughters and increased as the number of uncensored daughters increased. The reliability of combined evaluation was considerably higher than both direct and indirect evaluation with a small number of uncensored daughters. The advantage of combined evaluation became smaller with decreasing proportion of censored records, but remained slightly higher than the reliability of direct evaluation alone, even with 100 uncensored daughters. The weights for direct and indirect information that were used to construct the index changed considerably with an increasing number of uncensored daughters. The changes in direct and indirect weights (based on 20 daughters with conformation scores) are shown in Figure 2. The indirect weights decreased rapidly as soon as the first uncensored daughters were available. With an infinite number of uncensored daughters, the direct weights were asymptotically equal to one, whereas the indirect weights were close to zero. This trend was observed regardless of the amount of indirect information available. Therefore, using correlated conformation traits in genetic evaluation for herd life can be considered interesting for young sires with only a few uncensored daughters. For older sires with a large number of uncensored daughters, the indirect information from conformation traits is less important. A comprehensive simulation study is needed to determine exactly and quantify the improvement in reliability that can be achieved through the inclusion of the correlated confirmation traits in evaluation for longevity.
Figure 2. Changes in weights for direct (w_dir) and indirect (w_ind) breeding values for herd life with increasing number of uncensored daughters. The indirect weights are based on 20 daughters with conformation scores. Journal of Dairy Science Vol. 85, No. 6, 2002
1562
VUKASINOVIC ET AL.
CONCLUSIONS This paper describes an approach to enhance the reliability of genetic evaluation for herd life based on survival analysis by considering correlated conformation traits. The procedure that combines the direct information on herd life from a survival analysis with the indirect information derived from breeding values for conformation traits is computationally simple and can be applied to any bull that has conformation proofs. The reliability of the combined evaluation is always higher than the reliability of the direct evaluation alone. The greatest increase in reliability can be observed for young bulls with mostly censored daughters. The weights for direct and indirect information depend on the amount of information available for direct and indirect evaluation. The weights change during the life of the bull, with the direct weight increasing and the indirect weight decreasing as the amount of available culling data grow. The procedure described for genetic evaluation for herd life by combining information from herd life and conformation traits might be considered a computationally simpler alternative to the multiple-trait, acrosscountry evaluation MACE procedure (Schaeffer, 1994), currently used in some populations (Larroque and Ducrocq, 1999). The MACE procedure represents a more sophisticated method for obtaining genetic correlations between herd life and conformation traits. However, further research is needed in this area, with the ultimate goal of developing appropriate methodology for joint genetic evaluation for herd life, production, and conformation traits. ACKNOWLEDGMENTS The authors wish to thank the Swiss Simmental and Red and White Association for providing the data and the “Research and Development Group” of the Swiss Cattle Breeders’ Community for financial support. REFERENCES Boldman, K. G., A. E. Freeman, B. L. Harris, and A. L. Kuck. 1992. Prediction of sire transmitting abilities for herd life from transmitting abilities for linear type traits. J. Dairy Sci. 75:552–563.
Journal of Dairy Science Vol. 85, No. 6, 2002
Calo, L. L., R. E. McDowell, L. D. Van Vleck, and P. D. Miller. 1973. Genetic aspects of beef production among Holstein Friesians pedigree selected for milk production. J. Anim. Sci. 37:676–682. Dekkers, J. C. M., L. K. Jairath, and B. H. Lawrence. 1994. Relationships between sire genetic evaluations for conformation and functional herd life of daughters. J. Dairy Sci. 77:844–854. Diers, H. 1986. Nachkommenschaftsuntersuchungen zur linearen Exterieurbeschreibung in der Schwarzbuntzucht Niedersachsens. Ph.D. Diss., Univ. of Go¨ttingen, Germany. Ducrocq, V. 1987. An analysis of length of productive life in dairy cattle. Ph.D. Diss., Cornell Univ., Ithaca, NY. Ducrocq, V. 1997. Survival analysis, a statistical tool for longevity data. 48th Annual Meeting of the EAAP, Vienna, Austria, August 1997. Ducrocq, V., and H. So¨lkner. 1998. “The Survival Kit—V3.0”, a package for large analysis of survival data. Proc. 6th World Congr. Genet. Appl. Livest. Prod., Armidale, Australia, Vol. 27:447–448. Everett, R. W., J. F. Keown, and E. E. Clapp. 1976. Production and stayability trends in dairy cattle. J. Dairy Sci. 59:1532–1539. Henderson, C. R. 1977. Best linear unbiased prediction of breeding values not in the model for records. J. Dairy Sci. 60:783–787. Jairath, L., J. C. M. Dekkers, L. R. Schaeffer, Z. Liu, E. B. Burnside, and B. Kolstad. 1998. Genetic evaluation for herd life in Canada. J. Dairy Sci. 81:550–562. Larroque, H., and V. Ducrocq. 1999. An indirect approach for the estimation of genetic correlations between longevity and other traits. Proc. Internat. Workshop on EU Concerted Action Genetic Improvement of Functional Traits in Cattle (GIFT); Longevity. Jouy-en-Josas, France, May 1999, INTERBULL Bull. no. 21:128–135. Misztal, I. 1994. MTCAFS (MTC)—multitrait REML estimation of variance components program by canonical transformation, with support for multiple random effect. ftp://num.ads.uga.edu/pub/mtc (accessed 09/29/2001). Schaeffer, L. R. 1994. Multiple country comparison of dairy sires. J. Dairy Sci. 77:2671–2678. Schaeffer, L. R., and E. B. Burnside. 1974. Survival rates of tested daughters of sires in artificial insemination. J. Dairy Sci. 57:1394–1400. Schleppi, Y. 1998. Das Tiermodell auch fu¨r die Exterieurmerkmale. Schweizer Fleckvieh 6, 24–29. Smith, S. P., and R. L. Quaas. 1984. Productive life span of bull progeny groups: failure time analysis. J. Dairy Sci. 67:2999–3007. Vollema, A. R., S. Van Der Beek, A. G. F. Harbers, and G. De Jong. 2000. Genetic evaluation for longevity in Dutch dairy bulls. J. Dairy Sci. 83:2629–2639. Vukasinovic N., J. Moll, and L. Casanova. 2001. Implementation of a routine genetic evaluation for longevity based on survival analysis techniques in dairy cattle populations in Switzerland. J. Dairy Sci. 84:2073–2080. Weigel, D. J., B. G. Cassell, and R. E. Pearson. 1997. Prediction of transmitting abilities for productive life and lifetime profitability from production, somatic cell count, and type traits in milk markets for fluid milk and cheese. J. Dairy Sci. 80:1398–1405. Weigel K. A., T. J. Lawlor, Jr., P. M. VanRaden, and G. R. Wiggans. 1998. Use of linear type and production data to supplement early predicted transmitting abilities for productive life. J. Dairy Sci. 81:2040–2044.