Apr 16, 2012 - 1http://www.facebook.com. 2http://www.twitter. ... actions to discover latent communities in social graphs. We .... networks are Twitter and Facebook. On the ..... daily friday explorer chicken market midday internet cure numbers.
WWW 2012 – Session: Community Detection in Social Networks
April 16–20, 2012, Lyon, France
Using Content and Interactions for Discovering Communities in Social Networks Mrinmaya Sachan Danish Contractor Tanveer A. Faruquie L. Venkata Subramaniam IBM Research India New Delhi, India
{mrsachan, dcontrac, ftanveer, lvsubram}@in.ibm.com ABSTRACT
utilize social networks to update each other, communicate their likes, dislikes, views and share personal and public information. This ability of rich social interactions has lead to a substantial increase in the popularity of these sites. Their popularity can be gauged from the fact that Facebook1 , a popular social networking website started in 2004, has nearly 500 million users while Twitter2 , another popular website, has nearly 125 million users. According to the 2010 Internet and Social Media Consumer Insights report by Nielsen company, internet users spend nearly 22% of their time online, on social networking websites3 . The navigable network structure, the rich data produced by the users and the affinity of people to these websites has attracted the attention of academia and businesses alike. They want to use this information to discover previously unknown relationships and interests among people. For example, companies want to use the discovered information to create smarter advertisements, devise targeted marketing campaigns and exploit cross sell opportunities. The 2010 Edelman Trust Barometer Report4 found that 44% of the users are likely to respond to online marketing if there are “similar” users in their peer group who have responded to the advertisements. One important problem associated with discovering relationships among people that has received widespread attention is automated discovery of community. A community is a collection of users as a group such that there is high relatedness among people within the group. Discovering communities consisting of “similar” users is an important problem and finds application in areas as diverse as sociology, biology, marketing and computer science. Organization of people into communities gives important insights into group dynamics which can be used for online marketing, information dissemination and understanding the formation of clubs, committees and action groups in real world. This notion of ‘similarity’ between users based on which people are grouped into communities has been addressed differently in previous works. One common approach used is to treat communities as group of nodes in social network that are more densely connected among themselves than with the rest of the network. This essentially makes community discovery a graph clustering problem. However, recently communities are considered as interest groups providing people interested in similar topics a common forum. For our work,
In recent years, social networking sites have not only enabled people to connect with each other using social links but have also allowed them to share, communicate and interact over diverse geographical regions. Social network provide a rich source of heterogeneous data which can be exploited to discover previously unknown relationships and interests among groups of people. In this paper, we address the problem of discovering topically meaningful communities from a social network. We assume that a persons’ membership in a community is conditioned on its social relationship, the type of interaction and the information communicated with other members of that community. We propose generative models that can discover communities based on the discussed topics, interaction types and the social connections among people. In our models a person can belong to multiple communities and a community can participate in multiple topics. This allows us to discover both community interests and user interests based on the information and linked associations. We demonstrate the effectiveness of our model on two real word data sets and show that it performs better than existing community discovery models.
Categories and Subject Descriptors H.2.8 [Information Systems]: Database ApplicationsData mining; G.3 [Probability and Statistics]: Probabilistic algorithms
General Terms Algorithms
Keywords Community Detection, Social Networks, Probabilistic methods
1.
INTRODUCTION
Social networking websites provide a unique ability of allowing people in geographically disperse locations to connect socially over the internet. They provide multiple modes of communication, enable diverse interaction types and allow sharing of information with single or multiple people. Colleagues, acquaintances, family, friends, fans, activists, etc.
1
http://www.facebook.com http://www.twitter.com 3 http://blog.nielsen.com/nielsenwire/ 4 http://www.edelman.co.uk/trustbarometer/files/edelmantrust-barometer-2010.pdf 2
Copyright is held by the International World Wide Web Conference Committee (IW3C2). Distribution of these papers is limited to classroom use, and personal use by others. WWW 2012, April 16–20, 2012, Lyon, France. ACM 978-1-4503-1229-5/12/04.
331
WWW 2012 – Session: Community Detection in Social Networks we consider communities as “groups of users (nodes) who are interconnected and communicate on shared topics”. In this paper, we propose generative Bayesian models for extracting latent communities from a social network. The models assume that community memberships are dependent on the topics of interest amongst users and their link relationships in the social graph. Users can belong to multiple communities and a community can be related to multiple topics. These relationships are modeled using multinomial probability distributions. Further, a user may be interested in multiple topics based on his interest. This is useful in modeling user interests or roles they play in the network. We can also determine key topics prevailing in a community. This can be useful in locating/searching communities on given themes and interests. We also utilize the “type” of interactions between users to emphasize their interest in topics, and thus community membership. The type of interaction provides useful information to determine the level of participation of a user in a community. For example, two users engaging in conversations related to politics (posting replies to each other) are more likely to be members of a community on politics than someone who has occasionally broadcasted posts on politics (for example, during elections in a country). Finally, we observe that in some social networks there is a concept of ‘walls’ and ‘user profiles’ where users post messages driven purely by their own interests. Such posts are broadcasted to his/her neighbors by default. At the same time, other social networks (like Email networks) have a philosophy of personalized posts. Users can only send directed posts to one or few other users. Here, the posts can be assumed to be of mutual-interest to the sender and the recipient. We model interest through topics. Hence, we propose the Topic User Community Model (TUCM) and Topic User Recipient Community Models (TURCM-1 and 2) for both kinds of social networks. Herein, we make an assumption that posts in general discuss one topic only. This reduces the model training times and allows them to scale better on large data sizes. However, we acknowledge that this assumption can be weak in some cases, especially when post sizes are large. Hence, we also give a full TURCM model that relaxes this assumption. To the best of our knowledge we are the first to use all three: topics, social graph topology and nature of user interactions to discover latent communities in social graphs. We evaluated our models on one representative real word social network of both kinds-Twitter and Enron Email corpus. In the next section we review some prior work on latent community discovery in social graphs. The rest of the paper is structured as follows: In Section 3, we incrementally describe the models and present a Gibbs sampling based algorithm to infer their parameters. In Section 4 we give details about the data sets and experiments to validate our models. Finally, in Section 5 we conclude our work.
2.
April 16–20, 2012, Lyon, France
the graph, such as user interests. Another drawback is that all of these methods with the exception of CPM perform a hard-partitioning of nodes in the graph and do not allow users to have membership in multiple communities. To overcome this problem associated with hard partitioning of users into communities, researchers have proposed Bayesian probabilistic models for community discovery. Here extensions of the Latent Dirichlet Allocation (LDA) model like Simple Social Network LDA (SSN-LDA) [17], Generic Weighted network LDA (GWN-LDA) [16], Hybrid Community Discovery Framework (HCDF) [5] and Hierarchical Social Network-Pachinko Allocation Model (HSN-PAM) [15] are popular. Although these models allow for mixed community memberships, they too rely primarily on the link structure in a social graph to learn communities. For example, SSN-LDA [17] introduces a binary relation between each pair of users. Each user (ui ) is characterized by a social interaction profile (Document in LDA) representing all its Ii social links (words in that document): SIP (ui ) = {X1 . . . XIi } The social interaction profile of users is represented as random mixtures over latent community variables (Topics in LDA). Each community is in turn defined as a distribution over the social link space. Another class of approaches have tried to utilize the semantic content of social graphs to discover communities. In [18] the authors propose the CUT (Community-User-Topic) model which discover communities using the semantic content of the social graph. Communities are modeled as random mixtures over users who in turn have a topical distribution (interest) associated with them. The model, however, does not utilize the link information in a graph while discovering communities. While models like CUT assume that community members that actively talk about certain topics are connected with each other, models like SSN assume that users that are interconnected share similar interests. Neither is always true in real world scenarios. In real world social networks, there are users who are members of communities but do not actively contribute in them. Also, there are members who may be vocal about certain topics but may not be connected at all. Thus, both the graph structure and the interactions between users should be used to model the formation of communities. Recently, researchers have started investigating methods that combine both content and link information available in social networks. The Community-Author-Recipient-Topic (CART) model [11], was one of the first attempts to combine previous link based community discovery methods with content based community discovery. Though, both the CART model and our models use topics and social graph topology to model communities, the generative process in both is significantly different. While our models assume that communities are generated based on users, recipients, topics and links connecting them, the CART model generates authors (users) and recipients of a post from latent communities. Since, CART takes into account recipients for every post, it is impractical for discovering communities in social networks such as Twitter which allow broadcasts. Practically, the number of recipients for a message can run into thousands. Our proposed models scale well to such social networks. Since CART, there have been few more attempts at combining content and link to obtain community structures more
PRIOR WORK
Most previous approaches in community discovery use only the social structure among people to discover communities. These methods are based on agglomerative clustering, min-cut based graph partitioning, centrality based and Clique percolation methods (CPM) [12][2]. As these models only consider links they fail to account for other node properties and user interactions in the social graph besides
332
WWW 2012 – Session: Community Detection in Social Networks effectively. The Topic-Link LDA model [8] and Relational Topic Models [1] draw latent topical and community distributions for every node in document networks. Further, they generate link between documents based on topical similarity of the documents and community membership similarities of their authors. However, the models assume links as binary. On the other hand, our model utilizes the nature of interactions between users while modeling communities. Intuitively, this is synonymous to using weights in a graph for community discovery. We presented this idea in [13] where we introduced a graphical model to account for all three - Link, Content and Nature of Interaction and established their supremacy over all previous methods. In this paper, we provide interesting variations of the graphical model and provide additional insights on how the choice of social graph affects the choice of graphical model.
3.
comments, wall posts, shared photographs, tags, etc can be considered as interactions in social networks. For example, in Twitter, there are three types of interactions - a conventional tweet (broadcast tweet), a reply tweet and a re-tweet. For a conventional tweet, all the “followers” of the user are recipients. A reply post is one where a user has been “tagged” and replied to (Twitter denotes this as “@recipient” followed by the message). Finally, a retweet is one when a user decides to forward a post of another user. (Twitter denotes this as “RT@orginal sender name”). A reply tweet or a retweet clearly indicates a greater association between users and mutual interest in the underlying topic being discussed. In case of an email social graph, the types of posts fit the traditional model of email; that is replies, forwarded emails and mailing lists subscriptions. A typical social network G(U, E), where U is the set of users (nodes) and E is the set of edges connecting them. On top of this graph we have a collection of posts (interactions) authored and exchanged among the set of users U. Interactions are typed as described above. Motivated by SSN-LDA [17], we represent every user as a combination of his interaction space. Each user (ui ) is characterized by a social interaction profile representing all its Pi interactions (post types): SIP (ui ) = {X1 . . . XPi }. The social interaction profile of users is represented as random mixtures over latent community variables. Each community is in turn defined as a distribution over the interaction space. This idea is analogous to LDA, where the social interaction profile is a document, interactions are words in that document and communities are latent topics. The number of topics Z and the number of communities C to be discovered are specified apriori as model parameters. Let the size of the vocabulary from which the communications between users are composed be V . This vocabulary is constructed using the words that are used in the communications. The number of different type of communications is X. Let DirY (α) denote a Y-dimensional symmetric Dirichlet with scalar parameter α and M ult(.) denote the discrete multinomial distribution. Using plate notation TUCM model is shown in figure 1a and has the following generative scheme:
COMMUNITY DISCOVERY MODELS
We often observe networks in which posts are broadcasted, i.e. sent to each neighbor (follower) of the user. In this case, one can intuitively observe that the post is on a topic of the users interest and does not account for the interest of the recipient. Hence, recipient information can safely be ignored while gauging user interests. A few popular examples of such networks are Twitter and Facebook. On the other hand, in other networks like Email networks and Blogger networks, these message broadcasts might be controlled. In such cases, post topics characterize a mutual topic of interest between the sender and the recipient. We propose two generative models to account for both these kinds of networks. The notation used by our models is as follows: Notation: Let U be the set of users in the social network under consideration. Let Ri be the set of neighbors (recipients) of user (sender) ui ∈ U. For a given user (sender) ui ∈ U and its neighbor (recipient) uj ∈ Ri , let Pij Sbe the Pij set of posts (messages) sent by ui to uj . Let Pi = uj ∈Ri
be the S set of posts (messages) sent by user(sender) ui and P = Pi be the set of posts overall. Let Np be the number i
of words in a given post p, p ∈ P. Also let the cardinality of all these sets (in boldface) be represented by their corresponding capitalized symbols. The sender ui , recipient uj , the set of words Wp for each post p and the type of posts Xp are observable variables, while the communities, c, and topics, z, are considered as latent variables.
3.1
April 16–20, 2012, Lyon, France
1. For each of the topics, 1 ≤ z ≤ Z, sample a V dimensional multinomial, ~λz ∼ DirV (δ). This distribution represents the topic as distributions over words. 2. For each of the communities, 1 ≤ c ≤ C sample a X ~ c ∼ DirX (β). dimensional social interaction mixture φ
Topic User Community Model
In this section, we describe our first generative model (TUCM) for latent community discovery in such networks. TUCM discovers communities using the content being discussed by users in the form of latent topics and the type of posts generated by them. In the TUCM model, we assume that a user can belong to multiple communities and have an interest in multiple topics. We also use the “type” of communication to improve community discovery. The idea being that two users who share a series of posts (messages) with each other, are likely to communicate on certain common topics, indicating similar interests and therefore, should be members of the same community. The type of communication indicates the strength of association between two users and their interest in a topic. The type of interaction varies from one social graph to another. User uploads/downloads,
3. For the ith user ui , 1 ≤ ui ≤ U : (a) Sample a Z dimensional vector of topic proportions, ~ ηui ∼ DirZ (ν). (b) For each topic z ∈ Z, sample a C dimensional multinomial, θ~ui ,z ∼ DirC (α), representing the community proportions for that topic and sender. (c) For each post p (1 ≤ p ≤ Pi ) generated by the sender ui having Np words: i. Choose a topic assignment zp ∼ M ult(~ ηui ) zp ∈ [1 : Z] for the post. ii. Choose a community assignment cp . cp ∼ M ult(θ~ui ,zp ), cp ∈ [1 : C] for the post.
333
WWW 2012 – Session: Community Detection in Social Networks
April 16–20, 2012, Lyon, France
Figure 1: Plate notations of (a) TUCM (b) TURCM-1 (c) TURCM-2 (d) Full TURCM ~ cp ), iii. Choose a social interaction type Xp ∼ M ult(φ Xp ∈ [1 : X] for the post. iv. For every slot j, 1 ≤ j ≤ Np in p, choose a word wj ∼ M ult(~λzp ). In the above generative process we assume that every sender(ui ) has a multinomial distribution over topics, ~ η ui that represents his interest for each topic. Assuming that the user ui posts based on his inherent interest, the topic for each post p ∈ Pi generated by him is sampled from this user dependent topic distribution. The community assignment, cp , of the post is dependent on the user and the topic of the post. Since, social interaction profiles were assumed to be random mixtures over latent communities, the interaction type is finally generated from the community specific distribution. Let W be the set of words in the corpus, X be the set of interaction types observed on the social graph among the U set of users (senders). Let Z and C be the set of latent topic and community assignments for every post. The joint probability distribution of users, posts, interaction types, topic and community assignments given by the TUCM model is
a random assignment to all the latent variables, using the update equations to compute fresh latent assignments over a large burn-in period. When this distribution stabilizes, sufficient number of samples are taken at regular intervals to avoid correlation. The Gibbs update equations for the TUCM model are: P (cp = c|C−p , Z, U) = P c0
P (xp = x|X−p , C) = P x0
P (zp = z|Z−p , U) = P z0
Q P (Wp = w|W−p , Z) =
L = P (W, X, U, Z, C, θ, φ, η, λ|α, β, ν, δ)
L=
n−p xc + β n−p x0 c + Xβ
n−p zu + ν n−p z 0 u + Zν p N Qw
(n−p wz + i + δ)
NQ p −1
P ( (n−p w0 z + i + V δ)) w0
n−p a(b1 ...bv )
where represents the number of times a,(1 ≤ a ≤ A) is generated from the combination of variables b1 . . . bv in the model, (1 ≤ bi ≤ Bi , 1 ≤ i ≤ v) excluding post p. The procedure for the Gibbs Inference is given below:
P (W|Z; λ)P (X|C; φ)P (Z|U; η) P (C|Z, U; θ)P (θ|α)P (φ|β)P (η|ν)P (λ|δ)
3.1.1
n−p c0 (uz) + Cα
w∈Wp i=0
i=0
Using the graphical model, this can be factorized as:
n−p c(uz) + α
Parameter Estimation
Due to parameter couplings in the models, calculating exact posterior probabilities over all the hyper-parameters is intractable. However, the conditional distribution of each variable is much easier to sample from. Hence we use a Block-Gibbs sampling based approximate inference. We sample the topic assignment and community assignment for each post from a conditional distribution for this assignment given the observation and other assignments. This leads to a Markov chain where state transitions are simulated by repeatedly sampling from the conditional distributions given below. Inspired by the mixture of unigrams, the model makes only one topic draw for each post, and subsequently samples as many words as in the post from the topic-word distribution corresponding to it. We represent Wp as the set of words in a given post p, Np as the number of words in the post and Nwp as the number of times a given word w occurs in p. Let C−p , X−p , Z−p and W−p represent the community, post type, topic assignments and the set of words except post p. Gibbs sampling is carried out by starting with
Algorithm 1 Gibbs Inference for TUCM 1: /* Initialization */ 2: for all posts p ∈ P do 3: Assign a random community, topic and type to p 4: end for 5: /* Markov chain convergence */ 6: i ← 0 7: I ← Desired Number of Iterations 8: while i < I do 9: for all posts p ∈ P do 10: Estimate P (cp , zp , xp , Wp |C−p , Z−p , X−p , W−p ) 11: (c, z, x) ∼ P (cp , zp , xp , Wp |C−p , Z−p , X−p , W−p ) 12: Assign community c, topic z and type x to p 13: record assignment (c; z; x; Wp ) 14: end for 15: i++ 16: end while
334
WWW 2012 – Session: Community Detection in Social Networks An I iteration Gibbs sampling does ‘IP CXZ’ computations for assigning topic, community and types to each post P and ‘I × p∈P Wp = IW ’ computations for drawing each word in the posts. Hence, the algorithm has the worst time complexity O(IP CXZ + IW ). Topics can be computed using the approximation : P (w|z) = P w0
April 16–20, 2012, Lyon, France
community just as LDA clusters similar words as topics! Figure 1c shows the TURCM-2 model. The generative scheme for TURCM-2 is also on the lines of TUCM. Multinomials ~ ηui and θ~ui are drawn for every user. The recipients in the set of recipients Rp of post p are ~cp based on the community drawn from the multinomial ψ assignment drawn for the post. The Gibbs Sampling updates to infer TURCM 2’s parameters contain an additional update for the recipient draw.
n−p wz + δ n−p w0 z + V δ
Another approach is to find the maximum likelihood estimate for P (w|z) using P (W|z).
Q P (Rp = r|R−p , C) =
P (wi |z) =
P X
j=0
(
(n−j crpi + �)
P −j (nr0 c + i + U �)) r0
where Pi is the post under consideration. The additional Pdraws for recipients have an additional overhead of ‘I × p∈P Rp = IR’ computations over TUCM, where R is the sum of number of recipients for all the posts in the corpora. Hence, the worst case time complexity for Full TURCM becomes O(IP CXZ + IW + IR).
p Nw
where, P (wi |Wj ) = and P is the number of posts in the corpus. We observed that the results are similar in both approaches. For the sake of simplicity, we choose the MLE approach. The community memberships P (u|c) and topic proportions for a community P (z|c) are also estimated in a similar manner. The P (u|c) computation gives us the community as a distribution over users while P (z|c) gives us the topical interest in each community. i Np
3.4
Full TURCM
In this section we describe the Full TURCM model which is another modification to the earlier models. In previous models we have assumed that each post generated by a user is based on a single topic. This assumption may not hold true for networks which have large post sizes - for Example, the Enron email network data set. The Full TURCM model removes this assumption by generating a topic for each word in a post (instead of generating a topic per post). Further, as a result of this modification we now, generate posts based on the community that an author belongs to. The generative model shown in figure 1d is explained below in detail:
Topic User Recipient Community Model 1
Now, we describe the model to capture user interests in the second kind of networks which do not allow mass messaging. In such networks, the sender typically sends out messages to his/her acquaintances. Consequently, the posts are on a topic of interest to both the sender and the recipient of the post. Figure 1b shows the TURCM-1 model where the post topics and communities are generated corresponding to sender-recipient pair for the post. The generative scheme for TURCM-1 closely follows that of the TUCM described above. Multinomials ~ ηui ,uj and θ~ui ,uj are drawn for every sender-recipient pair and the post topic and community assignments are drawn from them respectively using appropriate sender-recipient indices. The Gibbs Sampling updates for TURCM-1 are similar with user u replaced by a user-recipient pair ur. Since the recipient information is only used as an index (to signify mutual interest:there are no extra draws) the worst case time complexity continues to be O(IP CXZ + IW ) as for TUCM.
3.3
Rpi −1
Q
P (wi |Wj )P (Wj |z)
j=1
3.2
r∈Rpi
1. For each of the topics, 1 ≤ z ≤ Z, sample a V dimensional multinomial, ~λz ∼ DirV (δ). This distribution represents the topic as distributions over words. 2. For each of the communities, 1 ≤ c ≤ C sample a ~c ∼ X dimensional social type interaction mixture φ DirX (β). 3. For each of the communities, 1 ≤ c ≤ C sample a U ~c ∼ dimensional social recipient interaction mixture ψ DirU (�). 4. For the ith user ui , 1 ≤ ui ≤ U :
Topic User Recipient Community Model 2
(a) Sample a C dimensional multinomial, θ~ui ∼ DirC (α), representing the community proportions for that sender. (b) For each community c ∈ C, sample a Z dimensional multinomial, ~ ηui ,c ∼ DirZ (ν), representing the topic proportions for community and sender. (c) For each post p (1 ≤ p ≤ Pi ) generated by the sender ui : having Np words: i. Choose a community assignment cp ∼ M ult(θ~ui ) cp ∈ [1 : C] for the post. ii. For each recipient slot i, 1 ≤ i ≤ Rp of the post p: ~cp ) A. Choose a recipient rp ∼ M ult(ψ rpi ∈ [1 : Rp ] for the post.
TURCM -1 accounted for recipient information of posts by ensuring that topic and community assignments for posts are not only based on users but user-recipient pairs of posts. However, this is not the same as accounting for links in a social graph as it does not in any way ensure formation of closely knit communities as closeness in the the link structure is not explicitly captured. Next, we describe another variation which models recipients differently. Network neighborhood is modeled as an interaction. We again go back to the Social interaction profile (SIP) formulation described earlier and generate post recipients corresponding to the community drawn. This is the same as representing each user in the social graph as a document with user indices of its neighbors as words. Communities will cluster nodes with similar neighborhood in one
335
WWW 2012 – Session: Community Detection in Social Networks ~ cp ), iii. Choose a social interaction type Xp ∼ M ult(φ Xp ∈ [1 : X] for the post. iv. For each word slot j, 1 ≤ j ≤ Np in p: A. Choose a topic assignment z ∼ M ult(~ ηui ,cp ), z ∈ [1 : Z]. B. Choose a word wj ∼ M ult(~λzw ). j
3.4.1
April 16–20, 2012, Lyon, France Travel arrive monday pm friday midday
Internet free download msn explorer internet
H1N1 influenza symptom america chicken cure
Stock Markets curve shift daily market numbers
Table 1: Topics extracted from Twitter dataset
Parameter Estimation California Power power transmission energy calpx california
The Gibbs sampling update equations for the Full TURCM model are attained as: n−p + α n−p xc + β P (cp = c|C−p , U, R, X, Z) ∝ P cu × P −p −p ncu + Cα nxc + Xβ c0
r∈Rp
ncr + � P n r 0 c + i + Rp i � r0
Trading price market dollar nymex trade
Deals meeting contract report enron deal
x0 Z Q
Y
Gas Transportation gas energy enron transco chris
Table 2: Topics extracted from Enron
Γ(ep,zu + n−p z(cp up ) + β)
z=1 Z P
Γ(
ep,zu + n−p z(cp up ) + Zβ)
‘tweets’. Tweets are publicly visible by default. However senders can restrict message delivery. Users may subscribe to other users’ tweets by following them. These follower relationships impose an underlying graph structure. On −(p,i) −(p,i) the other hand, the Enron dataset contains email exchanges nz(cu) + ν nwz +δ ¯ ∝ P P (z(p,i) = z|Z−(p,i) , C, U, W) P −(p,i) from about 150 employees, mostly senior management. We −(p,i) nz0 (cu) + Zν nw0 z + Zδ choose these two datasets for the diversity and challenges z0 w0 they bring along with them. While Twitter imposes a reThe Full TURCM model, by relaxing the assumption that striction on the length of posts, the number of followers of a post is always on a single topic incurs the overhead of a user can run into millions. In a social graph, these nodes drawing the topic assignment for each word (and not each (users) are sometimes called ‘star nodes’. This is a case post) in the corpus. The number of computations for aswhen the graph is dense but the associated content is much signing topics to each word grows to IZW , and the overall smaller. On the other hand, while the Enron dataset has complexity to O(IP CX + IZW ). However this computafewer nodes, emails can be arbitrarily long; case of a sparse tional overhead is compensated by improvements in quality graph but rich content. Scaling a technique that integrates of community discovery, especially when posts are too long both content and link to such diverse datasets is an imporand hence on more than one topic. tant challenge. Probabilistic techniques like those employed by us that work on word frequencies have the added advantage that they are less susceptible to noise. We do not have 4. EXPERIMENTS to undergo extensive data cleansing or data preparation. In this section, we evaluate our models on two real world We crawled a sub-graph from Twitter for our analysis usdata sets and compare them with the CUT and CART moding a simple heuristic approach. We began from a set of els. Most well known definitions of communities lay emphainfluential seed nodes and grew the graph by using follower sis on two things: How tightly users in a community are relationships. The Twitter dataset used for our experiments inter-connected, and how strongly the users in a community has 5405 nodes, 13214 edges and 23043 posts. The link share interests? types as described in section 3 are retained and the posts Our models discover shared interests from content produced are preprocessed to remove stop words on both datasets. by the users. To begin with, we give a qualitative evaluation of the communities obtained and try to argue how topics, 4.2 Results links and types combine to produce communities effectively. In all the models presented above, Z and C, the number We evaluate the strength of inter-connections in the comof topics and the bumber of communities respectively are munity structure by computing the fuzzy modularity [7] of free parameters. This requires some sensitivity analysis and the communities obtained. Modularity is a popular measure introduction of quality functions (such the modularity) in used to quantify the quality of division of a network into order to fix the best values. We will describe our strategy modules or communities. Finally, we show learning time for optimal parameter setting later. improvements over the two models. For all our simulations, we set the number of communities C at 10 and topics Z at 20 unless stated otherwise. These 4.1 Datasets choices are later proved to be close to the optimal in SecWe use two different datasets for our experiments, one is tions 4.2.2 and 4.2.3 We ran 1000 iterations to burn in and the freely available collections of tweets crawled from Twittook 250 samples (every fourth sample) in the next 1000 ter over a period of six months in 2009 [14] [6] and the iterations. other is the Enron Email corpus5 . Twitter is a social netz=1
where, ep,zu is the number of times topic z was generated from user u other than post p.
working and micro blogging service where users communicate by short text messages (up to 140 characters) called 5
4.2.1
Qualitative Analysis
In Table 2 and 3, we list a few topics (~λz ) discovered by TUCM over both datasets. We give top 5 words to visualize
http://www.cs.cmu.edu/ enron/
336
WWW 2012 – Session: Community Detection in Social Networks Management contract agreement meeting corporation budget
Engineering Power Transmission Electric epsa calpx
April 16–20, 2012, Lyon, France
Analyst price dollar cash database meeting
Table 3: Role discovery for users
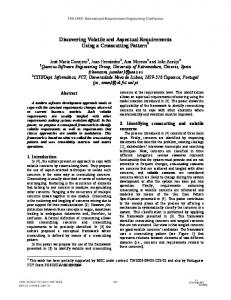
each topic. Here “calpx” is the California Power Corporation, “transco” is a gas transportation company and “nymex” is the New York Mercantile Exchange. We see that TUCM is able to discover meaningful topics, thus validating the assumption that each post is associated with a single topic. This is particularly true for the Twitter corpus (where post lengths are constrained) and generally true for the Enron corpus as seen in later experiments. Topic visualization was similar in other models, with only minor changes. Next, in figure 2 we illustrate the probability density over topics (~ ηui ) for a particular Twitter user (user 93). It shows that this user is primarily interested in topic 14 (Stock Markets) and also likes topics 4 (Internet). This analysis is useful in finding individual user’s interests and tastes. [9] showed how one can discover social roles of people by associating words with users (i.e. P (w|u)) through their topical interests. In Table 3 we give top words for a few roles using the Enron corpus. From these words we can see that social roles are nothing but work profiles for people working in Enron, like management, engineering and analyst. These social roles were confirmed against their true roles in Enron. It is also possible to uncover community membership proportions (i.e. P (c|u)) for every user. For instance, in figure 3, user 93 has a membership in community 4 to a high degree. Besides, the model suggests that the user also participates in community 6 to some extent. This analysis gives us an insight to the extent of participation of a user in various social groups. This probabilistic notion of membership has clear advantages in modeling user tastes and preferences to the hard clustering approach taken in previous non probabilistic approaches for community discovery. Now that we know how to estimate user interests and community memberships, we can also compute the topical interest of the communities formed by those users. With this analysis we can corroborate the intuition that communities are formed when users with similar interests aggregate together. In Figure 4, we show the topic distributions for different communities. Topical peaks for a community indicate the dominant topics for that particular community (i.e. P (z|c)). For example, after looking at the topic proportions for community 4 (see figure 5), which is the primary community for user 93, it was found that topics 14(Stock Markets) is the dominant topic in this community. Also topic 4 (Internet) is the dominant topic in community 6 (recall that user 93 also has a high membership in community 6). This kind of analysis supports our hypothesis that users tend to communicate frequently over certain topics (based on interests) and form communities which discusses them to varying degrees. Similar visualization is possible for all four models.
4.2.2
Figure 2: Topic proportions for a user
Figure 3: Community proportions for a user
Newman [10] proposed modularity, a measure of goodness for community structure. It assumes that a good division of the network is not merely one in which the number of edges running between groups is small. Rather, it is one in which the number of edges between groups is smaller than expected. Modularity, Q is defined as: Q=
(number of edges within communities) −(expected number of such edges)
While the application of modularity has been questioned from time to time (like in [3] and [4]), it continues to be the most popular and widely accepted measure of the goodness of community structure. Since the output of all our probabilistic models is a fuzzy community structure, in which each node has a certain probability of belonging to a certain community; we use a fuzzy variant of modularity Qf proposed in [7]. Hence, Fuzzy Modularity provides a measure of goodness for the fuzzy community structure in networks. For a particular fuzzy partition of a graph with n nodes and m edges where {ρk (x)}n k=1 is the fuzzy membership of n nodes in the k communities (S1 . . . Sk ), the approach is to classify nodes according to the majority rule, i.e. if k = argmaxl ρl (x) for a given node x then we set x ∈ Sk . Then the fuzzy modularity Qf is defined as: Qf =
n 1 X X ρk (x) + ρk (y) ( e(x, y) − pE f (x, y)) 2m 2 x,y∈S k=1
k
where pE f (x, y) is the expected probabilistic number of edge
Community Analysis
d (x)d (y)
f f e(x, y) with the form pE ; x, y ∈ Sk and f (x, y) = 2m df (x) is the extended degree of node x in community Sk under the probabilistic setting and given by
Next, we evaluate the quality of communities discovered by these models against communities discovered by the CUT and the CART models.
337
WWW 2012 – Session: Community Detection in Social Networks
April 16–20, 2012, Lyon, France
Number of Communities TUCM TURCM-1 TURCM-2 Full TURCM CART CUT
6
8
10
12
14
0.167 0.168 0.166 0.171 0.157 0.159
0.263 0.261 0.265 0.272 0.227 0.244
0.321 0.309 0.324 0.332 0.243 0.299
0.313 0.287 0.309 0.316 0.235 0.285
0.262 0.241 0.261 0.267 0.196 0.237
Table 4: Fuzzy modularity on the Twitter dataset Number of Communities TUCM TURCM-1 TURCM-2 Full TURCM CART CUT
Figure 4: Distribution of topics within communities
6
8
10
12
14
0.148 0.198 0.203 0.215 0.152 0.133
0.243 0.271 0.278 0.294 0.249 0.231
0.291 0.339 0.346 0.363 0.302 0.266
0.287 0.331 0.337 0.350 0.294 0.278
0.246 0.283 0.289 0.299 0.255 0.227
Table 5: Fuzzy modularity on the Enron dataset Figure 5: Distribution of topics in community 4
df (x) =
give interesting insights on how important role the choice of model plays. While models like TURCM-1 and TURCM-2 and CART are less suitable for sparse datasets like Twitter where link information is not dominant, they become increasingly important when the social graph information is rich. Similar trends are also observed in perplexity comparisons that are provided next.
X ρk (x) + ρk (z) e(x, z) 2 z∈S k
X ρk (x) + (1 − ρk (z)) + e(x, z) 2
4.2.3
Perplexity Analysis
Perplexity is one of the most important measures used to evaluate language models, especially topic models. Intuitively, it measures the log likelihood of generating unseen data after learning from a fraction of data. A higher value of perplexity implies a lesser model likelihood and hence lesser generative power of the model. As against most topic models where data is just the set of words, we compute the perplexity of observing both link types and words. We analyze and compare the perplexity of our models for the two datasets with the CUT and CART models. We divided the data into training and test portions randomly in different proportions and investigated how perplexity behaves as more and more data is used for training. Let Ntotal be the size of the corpus. Let p1 . . . pN be the posts used for training and pN +1 . . . pNtotal be used for testing. � � log P (pN +1 . . . pNtotal |p1 . . . pN ) Perplexity = exp − Ntotal − N
z ∈S / k
Tables 4 and 5 compares the fuzzy modularity of our models with their peers (CUT and CART). Full TURCM finds most meaningful communities as it not only integrates all three links, post types and content but also does not force every post to be on one topic. TUCM does well on the Twitter dataset as it can better model the short messages, poor content and noise present in Twitter data. On the other hand, in the Enron email dataset broadcasting is not allowed. Since users post directed messages to other users, the topic is of interest to both the user and the recipient. Consequently, recipient information becomes very relevant. Hence, TURCM-1 and TURCM-2 do well on Enron. TURCM-2 outperforms TRUCM-1 in both datasets due to better modeling of recipients. Finally, the high modularity values support our assumption that people who share common interests and are interconnected with each other in the social graph often form communities. Modularity is an important measure in our claim as one is always interested in strong-knit communities where people know each other as well as share common interests for reasons such as networking and task assignment. Methods that form communities purely on interest can end up with disparate people (who do not know each other and are disconnected in the graph) in one community. This is shown by much weaker numbers for the CUT model in Tables 4 and 5 . The number of topics was set to 20 for these experiments as we vary the number of communities. These results not only establish better community modeling by our models than its peers (CUT and CART) but also
Since each post is generated independently, P (pN +1 . . . pNtotal |p1 . . . pN ) =
test Y
P (pi |p1 . . . pN )
i=N +1
For the TUCM model, post likelihood can be computed as: X X Y P (pi |p1 . . . pN ) = ηzupi θcupi z φcxpi λwz z∈Z
c∈C
w∈Wpi
For the rest, the likelihoods can be computed accordingly. First, we explore the perplexity of our models on the two datasets. We also compare our models with CUT and
338
WWW 2012 – Session: Community Detection in Social Networks
April 16–20, 2012, Lyon, France
Figure 6: Perplexity on Enron vs (a) Percentage of data seen (b) No. of Topics (c) No. of Communities
Figure 7: Perplexity on Twitter vs (a) Percentage of data seen (b) No. of Topics (c) No. of Communities CART in terms of perplexity. Figures 6 and 7 give the comparison. As expected perplexities fall with the amount of data seen, suggesting an improvement in model tuning as more and more data is encountered. Again, Full TURCM does the best on both datasets which can be accredited to its better modeling of topics. TUCM does a better on the Twitter dataset than Enron. This is because the post length constraint in Twitter better suits the mixture of unigrams assumption. Also, we can observe TUCM outperform TURCM-1 and TURCM-2 for the Twitter dataset. This is because the large volume of broadcast tweets in the Twitter data set makes the recipient interest in a topic less relevant. However, TURCM-1 has an edge over TUCM in the Enron dataset due to the absence of broadcast messages. Consistently good values for perplexity on the two diverse datasets for all the models indicates the generalization ability of the models despite variability in graph density, link types, noise and post lengths. The results also establish significant improvements by the models over the CUT and CART models. This is because our models not only generate topic based communities but also account for graph topology and link types which are important descriptors of the strength of relationship between users. The results also confirm to our intuition that in some cases (like Twitter), the post topics model user’s (author’s) interests alone, while in other cases they model joint interest of the sender and the recipient. For these reasons, CART doesn’t perform too well on the Twitter dataset and CUT doesn’t perform well on ENRON. Finally, in order to comment on optimal model parameter settings (number of topics and communities), we analyze how model perplexities behave as the model parameters are changed. Figures 6 (b) and 7 (b) plot the perplexities against
the number of topics. The number of communities was set to 10 for this experiment. In both datasets for all the models, it can be roughly concluded that the peplexities attain their minimum at around 20-25 topics. Figures 6 (c) and 7 (c) plot the perplexities against the number of communities. The number of topics was set to 10 for this experiment. Again, for both the datasets, it can be concluded that the perplexities attain their minimum at around 10-12 communities. Similar insights were obtained about the number of communities from Tables 4 and 5 where the fuzzy modularities optimize around 10 communities for both datasets. This analysis not only helps us in concluding that our models outperform the two baselines (CUT and CART) independent of model parameter settings (Number of Topics and Number of Communities) but also in obtaining an estimate on optimal model parameter settings for both datasets.
4.2.4
Runtime Analysis
One major bottleneck with probabilistic models for social networks is their scalability. Social networks like Twitter and Facebook run into millions of nodes and probabilistic models due to an involved inference mechanism cannot scale to these sizes. Next, we compare the training time of the TUCM model against CUT and CART models. Table 6 gives the speed-ups: proportional increase in training times (the ratio of training times of the models over that of TUCM) against the number of nodes in the network. All simulations have been done on the same architecture and platform. In all models, training is assumed to finish when the model likelihoods converge (change in likelihood over consecutive iterations falls below 1% of the likelihood recorded in the previous iteration). The improvements
339
WWW 2012 – Session: Community Detection in Social Networks Number of Nodes 152 351 1049 2558 5405 8486
CUT 1.10 1.21 1.49 1.63 1.81 2.37
CART 1.22 1.35 1.64 1.77 1.99 2.73
TURCM1 1.02 1.04 1.13 1.19 1.23 1.34
April 16–20, 2012, Lyon, France TURCM2 1.07 1.16 1.29 1.34 1.52 1.86
Full TURCM 1.29 1.42 1.95 2.97 4.23 8.12
Table 6: Training time speed up of TUCM over other models are primarily because of the mixture of unigrams approach adopted in TUCM where we draw one topic for each post unlike CUT and CART models which encounter the overhead for each word in the post. CUT model does marginally better than CART. This is because the recipient information is less relevant community modeling in Twitter. Among the four models presented in this paper; although TURCM-1 has the same worst case complexity as TUCM, it has a slightly greater overhead of accounting for recipient indices. TURCM-2 makes additional computations in drawing recipients of the posts. More importantly, due to the overhead of topic generation for each word, Full TURCM takes significantly longer for the likelihood to converge. This speedup over models which do not make a unigram assumption continues to grow with data sizes rendering such models practically unusable in real size social networks. Consequently, the value of models like TUCM which model type information intelligently and efficiently can be realized.
5.
[5] K. Henderson, T. Eliassi-Rad, S. Papadimitriou, and C. Faloutsos. Hcdf: A hybrid community discovery framework. In SDM 10, 2010. [6] H. Kwak, C. Lee, H. Park, and S. Moon. What is Twitter, a social network or a news media? In Proceedings of the International Conference on World Wide Web, 2010. [7] J. Liu. Fuzzy modularity and fuzzy community structure in networks. The European Physical Journal B - Condensed Matter and Complex Systems, 77:547–557, 2010. 10.1140/epjb/e2010-00290-3. [8] Y. Liu, A. Niculescu-Mizil, and W. Gryc. Topic-link lda: joint models of topic and author community. In Proceedings of the 26th Annual International Conference on Machine Learning, ICML ’09, pages 665–672, New York, NY, USA, 2009. ACM. [9] A. Mccallum, A. Corrada-emmanuel, and X. Wang. Topic and role discovery in social networks. In In IJCAI, pages 786–791, 2005. [10] M. E. J. Newman. Modularity and community structure in networks. Proceedings of the National Academy of Sciences, 103(23):8577–8582, 2006. [11] N. Pathak, C. DeLong, A. Banerjee, and K. Erickson. Social topics models for community extraction. In Proceedings of the 2nd SNA-KDD Workshop, 2008. [12] M. A. Porter, J.-P. Onnela, and P. J. Mucha. Communities in networks. Notices of the American Mathematical Society, 56(9):1082 – 1097, 2009. [13] M. Sachan, D. Contractor, T. A. Faruquie, and L. V. Subramaniam. Probabilistic model for discovering topic based communities in social networks. In CIKM, pages 2349–2352, 2011. [14] J. Yang and J. Leskovec. Patterns of temporal variation in online media. In ACM Conference on Web Search and Data Mining, 2010. [15] H. Zhang. Hsn-pam: Finding hierarchical probabilistic groups from large-scale networks, 2010. [16] H. Zhang, C. L. Giles, H. C. Foley, and J. Yen. Probabilistic community discovery using hierarchical latent gaussian mixture model. In Proceedings of the Conference on Artificial intelligence, 2007. [17] H. Zhang, B. Qiu, C. L. Giles, H. C. Foley, and J. Yen. An lda-based community structure discovery approach for large-scale social networks. In In IEEE Conference on Intelligence and Security Informatics, pages 200–207, 2007. [18] D. Zhou, E. Manavoglu, J. Li, C. L. Giles, and H. Zha. Probabilistic models for discovering e-communities. In Proceedings of the International Conference on World Wide Web, 2006.
CONCLUSION
We began by positing that communities are formed by users who communicate on topics of mutual interest, are connected to each other in the social graph and share frequent personal communication. We discriminated between datasets where posts modeled author interests alone or mutual interest between the author and the recipient. To cover both cases, we proposed probabilistic schemes that incorporate topics, social relationships and nature of posts for more effective community discovery. We argued that interaction types are important indicators of the strength of association between users. Our models give us the capability of visualizing the topics a community is interested in besides offering topic modeling capabilities and discovering topics of interest for a user. Finally, we show superior community discovery results in the form of fuzzy-modularity and perplexity improvements. Our models also show significant reduction in training time over their closest peers making them scalable to large real-life social networks.
6.
REFERENCES
[1] J. Chang and D. Blei. Relational topic models for document networks. In AIStats, 2009. [2] S. Fortunato. Community detection in graphs. Physics Reports, 486(3-5):75 – 174, 2010. [3] S. Fortunato and M. Barthelemy. Resolution limit in community detection. Proceedings of the National Academy of Sciences, 104(1):36–41, 2007. [4] B. H. Good, Y.-A. de Montjoye, and A. Clauset. Performance of modularity maximization in practical contexts. Phys. Rev. E, 81:046106, Apr 2010.
340