Global Journal of Pure and Applied Mathematics. ISSN 0973-1768 Volume 11, Number 2 (2015), pp. 671-674 © Research India Publications http://www.ripublication.com
Using CUSUM Control Chart To Detect Change of Shrimp and Prawn Catch In Thailand K. Saithanu1 and J. Mekparyup2* Department of Mathematics, Faculty of Science, Burapha University 169 Muang, Chonburi, Thailand 1
[email protected], author corresponding:2*
[email protected]
1,2
Abstract The cumulative sum (CUSUM) control chart was applied in marine ecosystem as a statistical tool for detecting change of shrimp and prawn catch in Thailand. The negative deviation of CUSUM control chart showed the significantly decreasing signal. That implied the stock abundance of shrimp and prawn along Thai ocean was lessened since 2007 to 2012. Keywords: Shrimp and Prawn, CUSUM control chart Mathematics Subject Classification: 62-07, 62G35
Introduction Both of shrimp and prawn are the decapod crustaceans. They are different in the size. Prawns are bigger in size with claws on three pairs while shrimp are smaller with claws on only two pairs. However, they have exoskeletons and 10 legs. They can live in salt and fresh water all over the world. They tend to be found near the ocean floor also have similar taste and come in a various sizes ranged from tiny to large. Furthermore, the words of shrimp and prawn are usually used interchangeably in commercial and fisheries [1]. Shrimp and prawn for this study are composed of banana shrimp, jumbo tiger prawn, tiger shrimp, king prawn, school prawn, other shrimp, sergestid shrimp, flathead lobster, mantis shrimp and macrobracium corresponding to the report of Fisheries Statistics, Department of Fisheries [2]. The catch of shrimp and prawn are taken place along the Gulf of Thailand and the Andaman Sea. Thailand is the largest shrimp exporter in the world and it exports in large amount to specific countries like United States of America and Japan. Catch of shrimp has one of the highest rates on average with the ratio 6:1 between by catch and actual catch [3]. Also, large expanses of land near the Gulf of Thailand and the Andaman Sea have been rapidly turning to aquaculture over the past few years. As of
672
K. Saithanu
these reasons, the profusion of shrimp and prawn along two seashores has diminished nowadays which may lead to the critical situation. The cumulative sum or CUSUM control chart discovered by [4] is widely known as the statistical process control (SPC) scheme utilized in monitoring process change particularly small shift. Initially, the CUSUM control chart was limited only in the manufacturing process. However, it is broadly applied in diverse fields including in fishery work such as [5], [6], [7], [8], [9], [10]. The CUSUM control chart is the diagram figured between the two statistic values, positive and negative deviations, against the time order or sample. The control limits of CUSUM control chart are the three reference lines depended on the parameter of decision limit ( h ). Thus, the upper and lower control limits and the center line respectively are UCL. h , LCL. h and CL. 0 . [8] and [9] recommended adjusting parameters of CUSUM to detect change in the real practice. The parameters of allowance and decision limit were then 1 ). subsequently tuned to be 1.3 and ±1 ( k 1.3 and h
Materials and Methods Fisheries Statistics, Department of Fisheries, the government organization of Thailand, collected and gathered the catch of shrimp and prawn in the amount of 1,000 tons since 1999 [2]. The mean and standard deviation of shrimp and prawn catch were required to be estimate from the survey study because the information of shrimp and prawn catch was just officially recorded in few decades. Assume xi represented a set of shrimp and prawn catch at period i ; i 1999, 2000,, 2012 . The estimates of mean and standard deviation of shrimp and prawn catch were calculated depending on the in-control period, 1999-2006. The procedure of detecting change of shrimp and prawn catch was considered as these following three steps. 1. Determining the standardization of shrimp and prawn catch ( z i ) by substituting the two estimates, mean ( x ) and standard deviation ( s ) of the shrimp and xi x prawn catch, in zi . s 2. Computing the two test statistic values of CUSUM control chart. First, the positive deviation called the one-sided upper CUSUM calculated as Si max[0, Si 1 zi k ] . Second, the negative deviation known the one-sided lower CUSUM reckoned up Si
min[0, Si
1
zi k ] where k be the
allowance or reference parameter while the starting values of Si and Si are initially set up as Si
Si
0.
3. Plotting Si and Si into the CUSUM control chart contained the control limits, UCL. / LCL.
1 and CL. 0 . If Si is placed above the upper control limit or
Si is plotted below the lower control limit, the process is stated in the out-ofcontrol state. On the other hand, it is notified as the in-control situation.
Using CUSUM Control Chart To Detect Change of Shrimp and Prawn et.al.
673
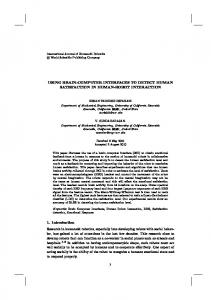
Results Both of Si and Si were computed after the standardization of shrimp and prawn catch, z i , was determined. The CUSUM control chart of shrimp and prawn catch was then displayed as of Figure 1 by plotting these two test statistic values, Si and Si , into the diagram. All values of Si still remained within the control limits. Contrarily, all values of
Si were placed below the lower control limit after the last year of in-control state (2006). That meant the catch of shrimp and prawn probably quickly decreased since 2007. The CUSUM Control Chart of Shrimp and Prawn Catch in Thailand In-control State (1999-2006) UCL=1 CL=0 LCL=-1
0
Variable Si+ Si-
-5
Si+/Si-
-10 -15 -20 -25 -30 2000
2002
2004
2006 Year
2008
2010
2012
Figure 1: The CUSUM Control Chart of Shrimp and Prawn Catch in Thailand
Discussion The negative deviation of CUSUM control chart obviously demonstrated that Thai resource of shrimp and prawn was acutely decreased since 2007 also it inclined to be continually lessened. Therefore, the CUSUM control chart was not only being the statistical tool for detecting shrimp and prawn catch but also notifying the government organization to plan and control the catch of shrimp and prawn not to be overexploited.
Acknowledgement The authors appreciate to the Fisheries Statistics, Department of Fisheries for kindly providing all data.
674
K. Saithanu
References Diffen, 2015, “Seafood,” Retrieved January 30, 2015, from Diffen Web Site: http://www.diffen.com/difference/Prawn_vs_Shrimp [2]. Department of Fisheries, 2014, "Fisheries Statistics," Retrieved October 1, 2014, from the Fishery Statistics Analysis and Research Group, Information Technology Center, Department of Fisheries Web site: http://www.fisheries. go.th/it- stat/yearbook [3]. Pulitzer Center on Crisis Reporting , 2015, “Thailand: The Overfishing Underclass,” Retrieved January 30, 2015, from Pulitzer Center on Crisis Reporting Web Site: http://pulitzercenter.org/reporting/thailand overfishing-human-trafficking-shrimp-exporting-aquaculture. [4]. Page, E.S., 1961, “Cumulative sum control charts,” Technometrics, 3, 1–9. [5]. Nicholson, M.D., 1984, “Some applications of CUSUM techniques in fisheries research,” Int. Counc. Explor. Sea, CM 1984/D:5, 10 p. [6]. Scandol, J.P., 2003, “Use of cumulative sum (CUSUM) control charts of landed catch in the management of fisheries,” Fisheries Research, 64(1), 19–36. [7]. Scandol J.P., 2005, “Use of quality control methods to monitor the status of fish stocks, ” In: Kruse, G.H., Gallucci, V.F., Hay, D.E., Perry, R.I., Peterman, R.M., Shirley, T.C., Spencer, P.D., Wilson, B., & Woodby, D. (eds.), Fisheries Assessment and Management in Data-Limited Situations, Alaska Sea Grant College Program, University of Alaska Fairbanks, 213– 233. [8]. Mesnil, B., & Petitgas, P., 2009, “Detection of changes in time-series of indicators using CUSUM control charts,” Aquatic Living Resources, 22(02), 187-192. [9]. Petitgas, P., 2009, “The CUSUM out-of-control table to monitor changes in fish stock status using many indicators,” Aquatic Living Resource. 22, 201–206. [10]. Saithanu, K., Unmueng, P. and Mekparyup, J., 2014, “Detecting Change of Longtail Tuna Quantity in Thailand with CUSUM Control Chart,” Global Journal of Pure and Applied Mathematics, 10(5), 657-661. [1].