NIH Public Access Author Manuscript Commun Comput Phys. Author manuscript; available in PMC 2014 March 26.
NIH-PA Author Manuscript
Published in final edited form as: Commun Comput Phys. 2013 January ; 13(1): 13–30.
Using DelPhi capabilities to mimic protein’s conformational reorganization with amino acid specific dielectric constants Lin Wang1, Zhe Zhang1, Walter Rocchia2, and Emil Alexov1,* 1Computational Biophysics and bioinformatics, Department of Physics, Clemson University, Clemson, SC 29634, USA 2Italian
Institute of Technology, Genoa, Italy
Abstract
NIH-PA Author Manuscript
Many molecular events are associated with small or large conformational changes occurring in the corresponding proteins. Modeling such changes is a challenge and requires significant amount of computing time. From point of view of electrostatics, these changes can be viewed as a reorganization of local charges and dipoles in response to the changes of the electrostatic field, if the cause is insertion or deletion of a charged amino acid. Here we report a large scale investigation of modeling the changes of the folding energy due to single mutations involving charged group. This allows the changes of the folding energy to be considered mostly electrostatics in origin and to be calculated with DelPhi assigning residue-specific value of the internal dielectric constant of protein. The predicted energy changes are benchmarked against experimentally measured changes of the folding energy on a set of 257 single mutations. The best fit between experimental values and predicted changes is used to find out the effective value of the internal dielectric constant for each type of amino acid. The predicted folding free energy changes with the optimal, amino acid specific, dielectric constants are within RMSD=0.86 kcal/mol from experimentally measured changes.
Keywords DelPhi; protein electrostatics; dielectric constant; Poisson-Boltzmann equation; protein flexibility; energy calculations; single point mutations
NIH-PA Author Manuscript
Introduction Electrostatic interactions play significant role in determining the structure, function and interactions of biomolecules.[1–4] Unlike the short-range force as van der Waals (vdW), electrostatic interactions are long ranging and highly sensitive to the surrounding environment such as solvent characteristics and ions concentration.[3] Being long range force, the electrostatics can affect the energetics and structural properties of distant objects ranging from macromolecular assemblages [5] to cluster of interacting amino acids. [6] Furthermore, the electrostatics may be the dominant energy contribution in describing variety of phenomena as pH and salt dependence of protein stability [7–10] and interactions [11, 12]. The last observation allows pH and salt dependent processes to be effectively studied by modeling the electrostatic component of the energy, while ignoring all other contributions.[10] *
Author whom the correspondence should be addressed.
[email protected]. The compiled folding energy changes, the corresponding structures and in silico made mutant structures, along with calculated energies are available from http://compbio.clemson.edu/delphi and clicking on the link “downloadable data”.
Wang et al.
Page 2
NIH-PA Author Manuscript NIH-PA Author Manuscript
Due to the importance of electrostatic interactions in biomolecular systems, significant efforts were invested to develop methods for modeling the electrostatics and better understanding its contribution to macromolecular properties. Currently there are two distinctive methods for treating the electrostatics in biological macromolecules immersed in water: explicit and implicit methods[13, 14]. The explicit methods describe the water phase explicitly, i.e. as a sea of explicit water molecules [13, 15, 16] and calculate the electrostatic interactions and energies via Coulomb’s law. However, these methods demand integration over countless solvent molecules degrees of freedom which requires significant computational time to obtain accurate results. On the other end of the spectrum are so termed implicit solvent models which treat the solvent implicitly as a homogeneous medium with specific dielectric properties and ion concentration [14, 17–19]. The implicit models greatly reduce the requirements of computational time while capturing most of the important electrostatics effects, especially for the bulk water phase [20–22]. However, simple implicit models may fail to accurate describe the electrostatic properties of the system of interest in the regions close to macromolecular surface and in cases of macromolecular systems experiencing conformational changes associated with the process being modeled. Because of that, hybrid methods were also developed treating explicitly the water molecules at the molecular surface while the bulk water is modeled as a continuum medium.[23–26] At the same time, fewer efforts were invested to account for the heterogeneity of macromolecules themselves and the effect of intrinsic flexibility on implicit electrostatic calculations. Our work, in conjunction with previously reported investigations[27, 28], is devoted to offer better representation of inhomogeneous dielectric properties of macromolecules in the framework of continuum electrostatics.
NIH-PA Author Manuscript
From point of view of continuum electrostatics, the protein molecules are highly polar objects, because they are made of amino acids carrying electrical charges and dipoles [29]. However, the distribution of charged and polar residues is not homogeneous. Polar and charged residues tend to appear on the surface of the molecules while hydrophobic residues are typically located in the core of the corresponding protein [29]. However, this may not hold in case of membrane proteins which frequently have charged and polar residues buried in their core [30]. This indicates that the polarity of biological macromolecules should vary from the core to the molecular surface or in general, will depend on the structure and amino acid composition of the macromolecule. The polarizability, on another hand, is more complicated quantity, directly related to the dielectric “constant” in continuum electrostatics. The polarizability reflects the presence of dipoles (and broadly speaking charges) which are capable of changing their orientations and positions in response to the local electrostatic field [31]. In terms of proteins, the polarizability critically depends on the ability of the corresponding structures to reorganize (backbone and side chain conformational changes) in response to the local electrostatic field. While understanding that dielectric constant is a macroscopic quantity and cannot be used to describe microscopic systems, we argue that each amino acid can be viewed as space region of protein structure with specific dielectric properties, and thus having specific dielectric constant.[27, 28] Our motivation for such an approach is to investigate the dielectric properties from the view of continuum electrostatics. Each amino acid is considered to be an object made of the corresponding atoms and partial charges and described as a homogeneous medium with particular dielectric constant. The lowest dielectric constant is assigned to amino acids which do not carry much partial charge (hydrophobic residues) and are not very flexible (buried in the hydrophobic core). In contrast, charged and polar amino acids are typically on the surface (being able to make conformational changes) and carry large electrical dipole or even a net charge and therefore will have large dielectric response to the changes of the local electrostatic field.
Commun Comput Phys. Author manuscript; available in PMC 2014 March 26.
Wang et al.
Page 3
NIH-PA Author Manuscript
In standard Poisson-Boltzmann calculations, the protein is typically treated as a homogeneous medium with dielectric constant between 2 (reflecting electronic polarizability [32]) and 4 (accounting for small backbone fluctuations [33]). At the same time, significant body of works exists claiming that the value of dielectric constant is underestimated [34] and that the dielectric constants should be position-dependent [30]. In terms of pKa calculations, it was shown that the use of static structures results in the best fit with experimental data if the dielectric constant is 20. [35] Other works, which were acquired from dipole fluctuation simulations in proteins, state various and even higher dielectric constants from 1–20 [36] up to 30–36 [37]. Also, the investigations of trypsin [38], lysozyme [39] and cytochrome c in water [33] have shown that the dielectric constant can vary from 2 in the center of protein to 25 or higher in the polar surface regions.
NIH-PA Author Manuscript
Alternative approach of accounting for inhomogeneous dielectric properties of proteins was introduced by Zhou and co-workers by using vdW surface instead of solvent exclusion (SE) surface in PB calculations [40–42]. Such an approach results in better solvation of the charges, both on the surface and in the interior of the proteins [43], and effectively raises the internal dielectric constant [44]. This method was applied to investigate the electrostatic contributions to the stability of several proteins. [40] The mutation sites were selected to be surface exposed to reduce the effect of other terms (not electrostatic energy terms) to the changes of the folding free energy. It was shown that the calculations performed with vdW surface provide better match to experimental data compared with those made with SE. Previous numerical investigations of the local dielectric constant per amino acid type were reported. Karshikoff and co-worker developed an algorithm to estimate the dielectric constant per amino acid type [28]. It was done by assigning pair dipole moment μ and polarizability α (assumed to be fixed at this position) at every point inside of known molecular structure and assuming that all dipoles can freely rotate and their relaxation can be described by a Langevin function in the Debye approximation. It was found that the residue specific dielectric constant can be as large as 58 for Gln residue, while hydrophobic groups’ dielectric constant stays with a single digit. In recent work [27], Song used molecular dynamics (MD) simulations to assess the conformational flexibility of three proteins and to deliver amino acid specific polarizabilities. The proteins were modeled as collection of polarizable dipoles in a cavity embedded inside water phase. It was shown that charged and polar residues consistently have large intrinsic polarizability (Table III in [27]), while small side chain and hydrophobic groups tend to have low polarizability. The calculated polarizabilities, however, were much smaller compared to those reported by Karshikoff and co-worker [28], perhaps, because of the use of more realistic modeling (MD) of protein structural fluctuations.
NIH-PA Author Manuscript
Experimental efforts to evaluate the inhomogeneous dielectric response in proteins were also reported. In series of works, Garcia-Moreno and co-workers used experimental and computational approaches to evaluate the optimal value of the effective dielectric constant in staphylococcus nuclease (SNase) with respect to pKa calculations. It was shown that the effective dielectric constant, as delivered to match the experimental interaction energies with Coulomb formula, should be different for amino acids situated on close distance from those at medium and large distances [45]. Furthermore, at different salt concentrations, different optimal effective dielectric constants were found [46], ranging from 36 up to more than 80. In this work, by utilizing the capability of Delphi to assigning different dielectric constants inside biological macromolecule, we investigate the possibility of mimicking small structural changes occurring upon single point mutations involving charged amino acid. By calculations of protein folding energy with different dielectric constants for different groups of amino acids, especially polar and ionized amino acids, we obtain the optimal values of
Commun Comput Phys. Author manuscript; available in PMC 2014 March 26.
Wang et al.
Page 4
dielectric constant for specific amino acids by optimizing the comparison with the experimental results of the changes of the folding free energy caused by the mutations.
NIH-PA Author Manuscript
Methods Mutant Protein Database
NIH-PA Author Manuscript
Mutant proteins subjected to the study and the corresponding folding free energy changes were extracted from ProTherm Database[47], (http://gibk26.bse.kyutech.ac.jp/jouhou/ protherm/protherm.html), which is a collection of experimental data of thermodynamic parameters. For our study, the database was purged to select only cases involving mutation of a charged amino acid (charged wild type to uncharged mutant or uncharged wild type to charged mutant). The experiments listed in ProTherm database to measure the thermodynamic parameters conclude Fluorescence spectroscopy, Circular Dichroism, Differential Scanning Calorimetry, NMR, etc. The experimental methods used to measure the unfolding free energy include Thermal, Urea and GdnHCl unfolding at various pH. In our investigation, we collected entries from ProThem database which unfolding free energy was measured in the pH range from 7 to 8. This resulted in an initial data set of 37 wild types and 397 mutants involving charged amino acid. After further investigation of structures, some structures were excluded due to large structural defects such as, for instance, large segments of missing polypeptide chains. Thus, our data set was reduced to 28 wild type proteins and 257 mutants (list is provided in supplementary material). The 3D structures of all corresponding wild type proteins were obtained from RCSB Protein Data Bank [48]. To avoid cases with large conformational changes for which the assumption that the electrostatics in the dominant component of the folding energy will not hold, we further purged the initial dataset with respect to the solvent accessible surface area (SASA). For t his purpose we used the msms program [49] (http://mgltools.scripps.edu/packages/MSMS/) which calculates the surface area of each atom. Summing up the individual atomic SASA within an amino acid, we obtain the total SASA per residue and calculate the relative change of SASA (fea) from the free state (isolated amino acid in solution) to the corresponding protein: (1)
NIH-PA Author Manuscript
where SASAin protein is the calculated SASA of the residue in protein structure and SASAisolated state is the SASA of the same amino acid extracted from the protein structure (labeled as “isolated state”). In our study we empirically select fea < 0.8 as a measure for surface exposed amino acids. As mentioned above, this was done to avoid problems with large structural changes which may occur upon a mutation at buried site. Such plausible large structural changes, definitely will involve other, different from electrostatic, energy terms and the changes of the folding free energy cannot be predicted with electrostatics alone. Structural Fixing, Protonating and Mutation Operations In our data set, some protein structures had structural defects such as missing atoms or residues. Because of that, all structures were subjected to a protocol to fix these structural defects. We utilized profix program from Jackal package which is developed in Honig’s lab (http://wiki.c2b2.columbia.edu/honiglab_public/index.php/Software:Jackal) to rebuild the missing atoms of both backbone and side chains. However, if the protein structure had fifteen missing side chains or more, the structure was removed from the dataset because
Commun Comput Phys. Author manuscript; available in PMC 2014 March 26.
Wang et al.
Page 5
NIH-PA Author Manuscript
such large rebuilding would probably cause significant structural inaccuracies. Hereafter, we utilized pdbxyz and xyzpdb modules of TINKER software [50] to add missing hydrogen atoms with AMBER [51] force parameter. The single point mutations were done in silico with scap module from the Jackal package using default options with AMBER force field. Only mutations involving charged amino acids Asp(D), Glu(E), His(H), Lys(K) and Arg(R) were modeled. Folding Free Energy Difference Calculations with Delphi The folding free energy change due to a mutation was calculated as the difference of the folding free energy of wild type and the folding free energy of the mutant: (2)
where ΔGfolding is the difference of free energy of folded state and of unfolded state: (3)
where X indicates either wild-type or mutant. Due to our lack of definition of unfolded state structure, we applied seven residue segment model to simulate the free energy of unfolded state (this is described in detail in our previous works [52–54]):
NIH-PA Author Manuscript
(4)
where G7(unfolding_wildtype) is free energy of the segments of mutation site with its neighboring six residues in unfolded state, and G0(unfolded_wildtype) is the free energy of the rest of the unfolded state. For mutant, we obtain in similar manner: (5)
Since the wild type protein and mutant were assumed to have similar structures in unfolded state except the mutation site with its six neighboring residues, free energy G0(unfolded_wildtype) and G0(unfolded_mutant) are assumed to be equal to each other. Thus, (6)
NIH-PA Author Manuscript
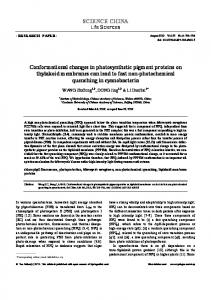
For each protein, the wild type and the mutant, four electrostatic energy components were calculated according to Eq. (6). These energy terms were calculated with Delphi program[55, 56] with the following parameters: scale 4 grids/A, external dielectric constant 80 and the convergence criterion RMSC was 0.0001 kT/e. The internal dielectric constant was varied as described below. Dielectric Constants Assignment Two different scenarios of assigning the internal dielectric constant in Delphi calculations were explored: (a) Two dielectric model of protein. In this simple case, the protein was considered to have only two distinctive dielectric regions, the site of mutation and the rest of the protein. Since in this work the site of mutation is always charged amino acids (either in the wild type or in the mutant), the first region corresponds to a residue carrying a net charge; the second region is the rest of the protein and includes all types of amino acids. Obviously this is simplification since the second region includes charged groups as well. (b) Ten dielectric regions model of protein. Each protein is allowed to have ten different types of dielectric constants (Fig. 1). These local dielectric constants were assigned according to
Commun Comput Phys. Author manuscript; available in PMC 2014 March 26.
Wang et al.
Page 6
NIH-PA Author Manuscript
the following rules: each ionizable group, Asp, Glu, His, Lys and Arg, was considered to have specific dielectric constant which was varied in our analysis from 15 to 28 (low values were ignored based on the analysis performed with two dielectric regions protocol); polar groups, Ser, Thr, Asn and Gln, were also assigned individual dielectric constant throughout the entire protein and the value was varied from 10 to 22, and the rest of amino acid types (including Tyr) were modeled with different dielectric constant which value was varied from 6 to 18. Thus, the entire protein was considered to be kind of mosaic object, each amino acid having specific dielectric constant. In order to test the sensitivity of the results with respect to different force field parameters, three force fields were applied in our study for comparing and optimizing the results: Amber98 [51], Charmm22 [57] and OPLS [58]. Computational and experimental results comparison To seek the optimal combination of dielectric constants resulting in the best fit of the computational results from Delphi calculation and experimental data from ProTherm Database[47], we adopted RMSD (Root Mean Square Deviation) measure.
(7)
NIH-PA Author Manuscript
where is the calculated change of the folding free energy and is the experimental free energy change taken from ProTherm database, i indicates the corresponding mutant and n is the number of mutants considered in our work. The smallest RMSD indicates the best fit to the experimental data and was used to determine the optimal set of dielectric constants per residue. Below we show the graphs of the best fit between computational and experimental results and report the corresponding optimal dielectric constants which were used to obtain the best fit.
Results In this section we report the results of numerical calculations beginning with the data set originally compiled by Zhou and co-workers [40] and then extending our approach to much larger data set. (a) Benchmarking against Zhou and co-workers dataset [40]
NIH-PA Author Manuscript
The idea of assessing the changes of the folding free energy upon charged amino acid substitutions by computing the electrostatic component of the folding energy was first proposed by Zhou and co-workers [40]. For such a purpose they selected mutations which involve ionizable group and mutation sites are exposed to the solvent. This was done to reduce the effect of other (non electrostatic) energy terms to the changes of the folding free energy. The data set included 10 mutants which are K16E, R119E and R154E from T4 Lysozyme (PDB_ID: 3LZM), D120N and D49N from Human Lysozyme (PDB_ID: 1REX), D1K, D17K, D25K, E41K and E74K from Ribonuclease Sa (PDB_ID: 1C54). The calculated by Zhou and co-workers values using vdW and SAS molecular surfaces are shown in Table 1 and in Fig. 2. Our calculations with DelPhi generally agree with these numbers, although small differences were accounted, due to different algorithms implemented in UHBD [40, 59], which originally was used by Zhou and coworkers. In parallel, we employed the two dielectric model (see method section) on the same dataset to calculate the folding energy changes. The best results, with respect to experimental data are shown in Table and drawn in Fig. 2. These best results were obtained with dielectric Commun Comput Phys. Author manuscript; available in PMC 2014 March 26.
Wang et al.
Page 7
constant of the mutation site equal to 21, while the rest of the corresponding protein was treaded with dielectric constant of 7.
NIH-PA Author Manuscript
In Delphi calculations, we used solvent exposed (SE) surface and Amber98 force field, and varied the internal dielectric constants ε1 from 2 to 30 and ε2 from 2 to 30, in increments of 1. The results indicate that using two dielectrics model provides much better fit to the experimental data (see the diamonds in Fig. 2) than the single dielectric model with either vdW or SE molecular surfaces. In both cases, the outliers corresponding to over predicted energy charges are significantly improved and are much closer to experimental data when calculated with the two dielectrics model. (b) Two dielectrics model tested on the large data set
NIH-PA Author Manuscript
To further explore plausible advantages of the two dielectrics model, we tested it on much larger data set (see method section). To be consistent with the previous analysis, we used Amber force field parameters and the values of the dielectric constants ε1 and ε2 were varied in the same manner as above. The results were grouped into five categories according to the specific ionizable residue being mutated, Asp, Glu, Arg, His and Lys. For each group, the best set of dielectric constants was found and results shown in Fig. 3. For Asp (D) group, the best combination is ε1 =20 and ε2 =5, for Glu (E) group, ε1 =18 and ε2 =10, for Arg (R) group, ε1 =28 and ε2 =6, for His (H) group, ε1 =18 and ε2 =4 and for Lys (K), ε1 =25 and ε2 =5. And the corresponding RMSDs for these five sets are 0.57, 0.61, 0.87, 0.19 and 0.92. Figure 3 shows that the calculated results are very close to experimental data, which can be seen from the corresponding RMSDs as well. Comparing the individual best values for the dielectric constants, it can be seen that the best ε1 is always large number varying from 18 to 28, while the best value for ε2 is much smaller ranging from 4 to 10. This observation will be used in our further analysis. (c) Ten dielectrics model
NIH-PA Author Manuscript
Two dielectrics model is overly simplified and does not account that different amino acid types may have different effective dielectric constants and that this can be attributed to any amino acid in the protein of interest, without being restricted to the mutation site only. To account for this, the ten dielectric constants model was applied for seeking more accurate description of dielectric properties of proteins. Each amino acid with charged side chain as Arg(ε1), His(ε2), Lys(ε3), Asp(ε4) and Glu(ε5) was considered to have distinctive dielectric constant. Since they are all charged residues and based on our previous analysis discussed above, the ranges for dielectric constants were set from 15 to 25. Another group was formed from amino acids with polar side chain as Ser (ε6), Thr (ε7), Asn (ε8) and Gln (ε9) and each of them was assigned distinctive dielectric constant. The value was varied from 10 to 20. To avoid combinatorial explosion, the rest of the amino acids, including Tyr, were modeled with a single dielectric constant which was ranged from 5 to 18. To assess the sensitivity of the results with regard to force field parameters, the calculations were done with three different force field parameters: Amber, Charmm and OPLS. Two equally important investigations were pursued: (c1) The possibility of obtaining consistent (universal) values for amino acid specific dielectric constants and (c2) The possibility that such an approach will lower the overall RMSD of predicted changes of the folding free energy. (c1) Obtaining consistent values for individual dielectric constants per amino acid types Results are summarized in Table 2, where the optimal sets of dielectric constants for mutation involving all amino acids and specific amino acid type are provided as indicated in
Commun Comput Phys. Author manuscript; available in PMC 2014 March 26.
Wang et al.
Page 8
NIH-PA Author Manuscript
column “X”. Two major observations can be made: (1) It can be seen that despite of using different force field parameters, the values are either unchanged or are quite similar. (2) The optimal dielectric constant per amino acid type remains the same or changes very little for different types of mutations. These observations speak is favor of the robustness of the finding and the applied protocol. Thus, the optimal dielectric constants for all types of amino acids modeled in this study are: Arg=18, Lys=20, Glu=19, Thr=12, Asn=13, Gln=13, His=21/22, Asp=17/18, Ser=10/11 and for other amino acids ranges from 14 to 18. (c2) Improving RMSD of predicted changes of the folding free energy
NIH-PA Author Manuscript
Here we report the predicted energy changes obtained with the optimal set of dielectric constants listed in Table 2 and calculated with specific force field parameters. Figure 4 shows the calculated changes of the folding free energy with Amber force field parameters benchmarked against experimental data. It can be seen that most of the data points lie on the main diagonal indicating that the calculated changes are very similar to the experimental results. However, there are several offset points, which are the main contributors to the RMSDs. With the exception of one case in Asp test (mutant D122A in 1RX4.pdb, where the folding free energy change calculated with Delphi is 1.73 Kcal/mol while experimental result is −1.6 Kcal/mol), the most difficult to predict are mutations involving Lys residue (low right panel in Fig. 4). In several cases, the numerical protocol underestimates the experimentally observed energy changes by much. These prominent cases are listed below: The folding energy change for the mutant K97V in 1IOB.pdb is predicted to be 0.17 Kcal/ mol while the experimental energy change is 1.5 Kcal/mol resulting in 1.33 Kcal/mol difference. Another prominent case results in 2.38 Kcal/mol difference for 1IOB_K97G (Delphi result is 0.28 Kcal/mol against experimental value −2.1 Kcal/mol). The third example is K46G mutant in 1ARR.pdb, for which Delphi calculates 0.52 Kcal/mol against the experimental value −1.6 Kcal/mol. Figure 5 demonstrates the accuracy of the predictions made with Charmm force field parameters. It can be seen again that the most difficult to predict are changes of the folding free energy involving Lys mutation. Prominent examples are: 1STN_K78A which has 3.3 Kcal/mol offset (ΔΔGcalc =2.73 Kcal/mol, ΔΔGexp =−0.6 Kcal/mol), 1STN_K78G which has 3.83 Kcal/mol offset (ΔΔGcalc =2.72 Kcal/mol, ΔΔGexp =−1.1 Kcal/mol), 1IOB_K97G which has 3.04 Kcal/mol offset (ΔΔGcalc =0.94 Kcal/mol, ΔΔGexp =−2.1 Kcal/mol). However, equally difficult to predict with Charmm force field parameters are mutations involving Arg residue as indicated by the next two cases: 1BTA_R75L and 1STN_R81G have 2.9 and 2.5 Kcal/mol offset respectively. At the same time, the offset point in case of mutation involving Asp residue calculated with Amber force field parameters (Fig. 4) is now predicted with better accuracy.
NIH-PA Author Manuscript
The last set of results was obtained with OPLS force field (Fig. 6). In this case, the most difficult to predict are the free energy changes upon mutation of Lys, Asp and Arg groups. Similar to the results with Charmm force field, the mutations K78A and K78G from wild type 1STN have 3.4 Kcal/mol and 3.6 Kcal/mol offset respectively. For the mutations involving Asp and Arg, 1HTI_S105D (ΔΔGcalc =1.24 Kcal/mol, ΔΔGexp =−1.3 Kcal/mol), 1MSI_D59N (ΔΔGcalc =−2.60 Kcal/mol, ΔΔGexp =−0.05 Kcal/mol), 1STN_R81G (ΔΔGcalc =0.59 Kcal/mol, ΔΔGexp =−2.2 Kcal/mol) and 1BTA_R75L (ΔΔGcalc =−1.07 Kcal/mol, ΔΔGexp =0.7 Kcal/mol) have 2.5Kcal/mol, 2.6Kcal/mol, 2.8Kcal/mol and 1.8Kcal/mol offset respectively. Comparing the list of prominent error cases listed above, it can be seen that the usage different force field parameters results in different set of outliers. Very seldom a given mutation is wrongly (more than 2kcal/mol difference from the experimental value) predicted by two different sets of force field parameters. This indicates that different force field Commun Comput Phys. Author manuscript; available in PMC 2014 March 26.
Wang et al.
Page 9
parameters have different issues associated with our approach and perhaps these issues are not directly related to the assumptions made.
NIH-PA Author Manuscript
Despite of the differences discussed above, the results obtained with ten dielectrics model, are better than those with two dielectrics. The results are summarized in Table 3. As it was indicated above, the results with Amber force are better than both Charmm and OPLS force fields according to the RMSDs comparison. For all dataset case, the RMSD with Amber force fields is 0.86 while the other two are higher than one. For all specific amino acids mutations, the RMSDs of the predictions with Amber force fields are less than 1.0 but for the other force fields are much higher and even to 1.54 with OPLS force fields (Table 3). Compared the RMSDs from two dielectric constants model, the RMSD for Asp improved from 0.57 to 0.31, for Arg improved from 0.87 to 0.64, for Asp, His and Lys also have slight improvements.
Conclusions
NIH-PA Author Manuscript
This study demonstrated that small plausible structural rearrangements occurring upon mutations involving charged groups exposed to the water can be successfully modeled with PB formalism, as implemented in DelPhi, by assigning residue specific dielectric constant per amino acid type. The obtained optimal values of the internal dielectric constants for charged and polar groups are higher than those for less polar types of amino acids, in accordance with previous work ([27]). The robustness of the approach is demonstrated by the fact that the same optimal values of the residues specific dielectric constant were obtained with different force field parameters and with different residues involved in the mutation. The resulting RMSD from the benchmarking against experimental data of folding free energy changes are below 1 kcal/mol with Amber force field parameters, which is an excellent achievement from computational stand-point of view.
Acknowledgments The authors thank Barry Honing for the continuous support and encouragement. The work was supported by a grant from the Institute of General Medical Sciences, National Institutes of Health, award number 1R01GM093937-01.
References
NIH-PA Author Manuscript
1. Perutz MF. Electrostatic effects in proteins. Science. 1978; 201(4362):1187–1191. [PubMed: 694508] 2. Warshel A, Russell ST. Calculations of electrostatic interactions in biological systems and in solutions. Q Rev Biophys. 1984; 17(3):283–422. [PubMed: 6098916] 3. Sharp KA, Honig B. Electrostatic interactions in macromolecules: theory and applications. Annu Rev Biophys Biophys Chem. 1990; 19:301–332. [PubMed: 2194479] 4. Simonson T. Dielectric relaxation in proteins: microscopic and macroscopic models. International journal of quantum chemistry. 1999; 73(1):45–57. 5. Van Belle D, Couplet I, Prevost M, Wodak SJ. Calculations of electrostatic properties in proteins:: Analysis of contributions from induced protein dipoles. Journal of molecular biology. 1987; 198(4): 721–735. [PubMed: 3430627] 6. Spassov V, Bashford D. Electrostatic coupling to pH-titrating sites as a source of cooperativity in protein-ligand binding. Protein Sci. 1998; 7(9):2012–2025. [PubMed: 9761483] 7. Misra VK, Hecht JL, Yang AS, Honig B. Electrostatic Contributions to the Binding Free Energy of the [lambda] cI Repressor to DNA. Biophysical journal. 1998; 75(5):2262–2273. [PubMed: 9788922] 8. Alexov E. Numerical calculations of the pH of maximal protein stability. The effect of the sequence composition and three-dimensional structure. Eur JBiochem. 2004; 271(1):173–185. [PubMed: 14686930]
Commun Comput Phys. Author manuscript; available in PMC 2014 March 26.
Wang et al.
Page 10
NIH-PA Author Manuscript NIH-PA Author Manuscript NIH-PA Author Manuscript
9. Alexov E, Honig B. The origins of pH dependent effects on protein stability: Applications to proteases. Biophysical Journal. 2002; 82(1):474a–474a. [PubMed: 11751334] 10. Yang AS, Honig B. On the pH dependence of protein stability. J Mol Biol. 1993; 231(2):459–474. [PubMed: 8510157] 11. Talley K, Kundrotas P, Alexov E. Modeling salt dependence of protein-protein association: Linear vs non-linear Poisson-Boltzmann equation. Communications in Computational Physics. 2008; 3(5):1071–1086. 12. Bertonati C, Honig B, Alexov E. Poisson-Boltzmann calculations of nonspecific salt effects on protein-protein binding free energies. Biophysical Journal. 2007; 92(6):1891–1899. [PubMed: 17208980] 13. King G, Warshel A. A surface constrained all atom solvent model for effective simulations of polar solutions. The Journal of Chemical Physics. 1989; 91:3647. 14. Still WC, Tempczyk A, Hawley RC, Hendrickson T. Semianalytical treatment of solvation for molecular mechanics and dynamics. Journal of the American Chemical Society. 1990; 112(16): 6127–6129. 15. Kony DB, Damm W, Stoll S, van Gunsteren WF, Hunenberger PH. Explicit-solvent molecular dynamics simulations of the polysaccharide schizophyllan in water. Biophys J. 2007; 93(2):442– 455. [PubMed: 17237195] 16. Druchok M, Vlachy V, Dill KA. Explicit-water molecular dynamics study of a short-chain 3,3 ionene in solutions with sodium halides. J Chem Phys. 2009; 130(13):134903. [PubMed: 19355776] 17. Grochowski P, Trylska J. Continuum molecular electrostatics, salt effects, and counterion binding--a review of the Poisson-Boltzmann theory and its modifications. Biopolymers. 2008; 89(2):93–113. [PubMed: 17969016] 18. Olkhova E, Hunte C, Screpanti E, Padan E, Michel H. Multiconformation continuum electrostatics analysis of the NhaA Na+/H+ antiporter of Escherichia coli with functional implications. Proc Natl Acad Sci U S A. 2006; 103(8):2629–2634. [PubMed: 16477015] 19. Hassan SA, Mehler EL. A critical analysis of continuum electrostatics: the screened Coulomb potential--implicit solvent model and the study of the alanine dipeptide and discrimination of misfolded structures of proteins. Proteins. 2002; 47(1):45–61. [PubMed: 11870864] 20. Olson MA. Modeling loop reorganization free energies of acetylcholinesterase: a comparison of explicit and implicit solvent models. Proteins: Structure, Function, and Bioinformatics. 2004; 57(4):645–650. 21. Gorham RD Jr, Kieslich CA, Nichols A, Sausman NU, Foronda M, Morikis D. An evaluation of poisson-boltzmann electrostatic free energy calculations through comparison with experimental mutagenesis data. Biopolymers. 2011 22. Bertonati C, Honig B, Alexov E. Poisson-Boltzmann calculations of nonspecific salt effects on protein-protein binding free energies. Biophys J. 2007; 92(6):1891–1899. [PubMed: 17208980] 23. Lee MS, Salsbury FR Jr, Olson MA. An efficient hybrid explicit/implicit solvent method for biomolecular simulations. Journal of computational chemistry. 2004; 25(16):1967–1978. [PubMed: 15470756] 24. Ma B, Nussinov R. Explicit and implicit water simulations of a beta-hairpin peptide. Proteins. 1999; 37(1):73–87. [PubMed: 10451552] 25. Spaeth JR, Kevrekidis IG, Panagiotopoulos AZ. A comparison of implicit-and explicit-solvent simulations of self-assembly in block copolymer and solute systems. J Chem Phys. 2011; 134(16): 164902. [PubMed: 21528979] 26. Brancato G, Rega N, Barone V. A hybrid explicit/implicit solvation method for first-principle molecular dynamics simulations. J Chem Phys. 2008; 128(14):144501. [PubMed: 18412453] 27. Song X. An inhomogeneous model of protein dielectric properties: Intrinsic polarizabilities of amino acids. The Journal of Chemical Physics. 2002; 116:9359. 28. Voges D, Karshikoff A. A model of a local dielectric constant in proteins. The Journal of Chemical Physics. 1998; 108:2219. 29. Richards FM. Areas, volumes, packing, and protein structure. Annual Review of Biophysics and Bioengineering. 1977; 6(1):151–176. Commun Comput Phys. Author manuscript; available in PMC 2014 March 26.
Wang et al.
Page 11
NIH-PA Author Manuscript NIH-PA Author Manuscript NIH-PA Author Manuscript
30. Alexov E, Gunner M. Calculated protein and proton motions coupled to electron transfer: electron transfer from QA-to QB in bacterial photosynthetic reaction centers. Biochemistry. 1999; 38(26): 8253–8270. [PubMed: 10387071] 31. Porschke D. Electrostatics and electrodynamics of bacteriorhodopsin. Biophysical journal. 1996; 71(6):3381–3391. [PubMed: 8968607] 32. Böttcher, CJF.; Van Belle, O.; Bordewijk, P.; Rip, A. Theory of electric polarization. Elsevier Scientific Pub. Co; 1978. 33. Gilson MK, Honig BH. The dielectric constant of a folded protein. Biopolymers. 1986; 25 (11): 2097–2119. [PubMed: 3790703] 34. King G, Lee FS, Warshel A. Microscopic simulations of macroscopic dielectric constants of solvated proteins. The Journal of Chemical Physics. 1991; 95:4366. 35. Antosiewicz J, McCammon JA, Gilson MK. Prediction of pH-dependent properties of proteins. Journal of molecular biology. 1994; 238(3):415–436. [PubMed: 8176733] 36. Nakamura H, Sakamoto T, Wada A. A theoretical study of the dielectric constant of protein. Protein engineering. 1988; 2(3):177. [PubMed: 3237682] 37. Smith PE, Brunne RM, Mark AE, Van Gunsteren WF. Dielectric properties of trypsin inhibitor and lysozyme calculated from molecular dynamics simulations. The Journal of Physical Chemistry. 1993; 97(9):2009–2014. 38. Honig B, Nicholls A. Classical electrostatics in biology and chemistry. Science. 1995; 268(5214): 1144. [PubMed: 7761829] 39. Schaefer M, Sommer M, Karplus M. pH-dependence of protein stability: Absolute electrostatic free energy differences between conformations. The Journal of Physical Chemistry B. 1997; 101(9):1663–1683. 40. Dong F, Zhou HX. Electrostatic contributions to T4 lysozyme stability: Solvent-exposed charges versus semi-buried salt bridges. Biophysical journal. 2002; 83(3):1341–1347. [PubMed: 12202359] 41. Dong F, Vijayakumar M, Zhou HX. Comparison of calculation and experiment implicates significant electrostatic contributions to the binding stability of barnase and barstar. Biophys J. 2003; 85(1):49–60. [PubMed: 12829463] 42. Qin S, Zhou HX. Do electrostatic interactions destabilize protein-nucleic acid binding? Biopolymers. 2007; 86(2):112–118. [PubMed: 17326079] 43. Alexov E. Role of the protein side-chain fluctuations on the strength of pair-wise electrostatic interactions: comparing experimental with computed pK(a)s. Proteins. 2003; 50(1):94–103. [PubMed: 12471602] 44. Talley K, Ng C, Shoppell M, Kundrotas P, Alexov E. On the electrostatic component of proteinprotein binding free energy. PMC Biophys. 2008; 1(1):2. [PubMed: 19351424] 45. Baran KL, Chimenti MS, Schlessman JL, Fitch CA, Herbst KJ, Garcia-Moreno BE. Electrostatic effects in a network of polar and ionizable groups in staphylococcal nuclease. Journal of molecular biology. 2008; 379(5):1045–1062. [PubMed: 18499123] 46. Lee KK, Fitch CA, García-Moreno E. Distance dependence and salt sensitivity of pairwise, coulombic interactions in a protein. Protein science. 2002; 11(5):1004–1016. [PubMed: 11967358] 47. Bava KA, Gromiha MM, Uedaira H, Kitajima K, Sarai A. ProTherm, version 4. 0: thermodynamic database for proteins and mutants. Nucleic acids research. 2004; 32 (suppl 1):D120. [PubMed: 14681373] 48. Berman HM, Westbrook J, Feng Z, Gilliland G, Bhat T, Weissig H, Shindyalov IN, Bourne PE. The protein data bank. Nucleic acids research. 2000; 28(1):235. [PubMed: 10592235] 49. Sanner MF, Olson AJ, Spehner JC. Reduced surface: an efficient way to compute molecular surfaces. Biopolymers. 1996; 38(3):305–320. [PubMed: 8906967] 50. Ponder, JW. Department of Biochemistry and Molecular Biophysics, Washington University School of Medicine; St Louis, MO: 1998. TINKER: software tools for molecular design. 51. Wang J, Wolf RM, Caldwell JW, Kollman PA, Case DA. Development and testing of a general amber force field. Journal of computational chemistry. 2004; 25(9):1157–1174. [PubMed: 15116359]
Commun Comput Phys. Author manuscript; available in PMC 2014 March 26.
Wang et al.
Page 12
NIH-PA Author Manuscript NIH-PA Author Manuscript
52. Witham S, Takano K, Schwartz C, Alexov E. A missense mutation in CLIC2 associated with intellectual disability is predicted by in silico modeling to affect protein stability and dynamics. Proteins. 2011 53. Zhang Z, Norris J, Schwartz C, Alexov E. In silico and in vitro investigations of the mutability of disease-causing missensemutation sites in spermine synthase. PLoS One. 2011; 6(5):e20373. [PubMed: 21647366] 54. Zhang Z, Teng S, Wang L, Schwartz CE, Alexov E. Computational analysis of missense mutations causing Snyder-Robinson syndrome. Hum Mutat. 2010; 31(9):1043–1049. [PubMed: 20556796] 55. Rocchia W, Alexov E, Honig B. Extending the applicability of the nonlinear Poisson-Boltzmann equation: Multiple dielectric constants and multivalent ions. The Journal of Physical Chemistry B. 2001; 105(28):6507–6514. 56. Rocchia W, Sridharan S, Nicholls A, Alexov E, Chiabrera A, Honig B. Rapid grid based construction of the molecular surface and the use of induced surface charge to calculate reaction field energies: Applications to the molecular systems and geometric objects. Journal of computational chemistry. 2002; 23(1):128–137. [PubMed: 11913378] 57. Brooks BR, Bruccoleri RE, Olafson BD. CHARMM: A program for macromolecular energy, minimization, and dynamics calculations. Journal of computational chemistry. 1983; 4(2):187– 217. 58. Jorgensen WL, Tirado-Rives J. The OPLS [optimized potentials for liquid simulations] potential functions for proteins, energy minimizations for crystals of cyclic peptides and crambin. Journal of the American Chemical Society. 1988; 110(6):1657–1666. 59. Madura JD, Briggs JM, Wade RC, Davis ME, Luty BA, Ilin A, Antosiewicz J, Gilson MK, Bagheri B, Scott LR. Electrostatics and diffusion of molecules in solution: simulations with the University of Houston Brownian Dynamics program. Computer Physics Communications. 1995; 91(1–3):57–95.
NIH-PA Author Manuscript Commun Comput Phys. Author manuscript; available in PMC 2014 March 26.
Wang et al.
Page 13
NIH-PA Author Manuscript NIH-PA Author Manuscript
Figure 1.
Cartoon presentation of the protocol of assigning different dielectric constants per amino acid type
NIH-PA Author Manuscript Commun Comput Phys. Author manuscript; available in PMC 2014 March 26.
Wang et al.
Page 14
NIH-PA Author Manuscript NIH-PA Author Manuscript
Figure 2.
Comparison of Delphi results with optimal set of dielectric constants ε1 =21 ε2 =7 (diamond), UHBD[30, 42] results with vdW surface (triangle) and SE (cross) with the experimental results using Zhou and coworkers dataset [40]
NIH-PA Author Manuscript Commun Comput Phys. Author manuscript; available in PMC 2014 March 26.
Wang et al.
Page 15
NIH-PA Author Manuscript NIH-PA Author Manuscript
Figure 3.
Calculated folding free energy changes compared with the experimental data from ProTherm database for five types of mutations. The corresponding optimal dielectric constants are provided as well. (a) Mutation involving Asp residue; optimal dielectric constants ε1 =20 and ε2 =5 (b) Glu; ε1 =18 and ε2 =10 (c) Arg; ε1 =28 and ε2 =6 (d) His; ε1 =18 and ε2 =4 (e) Lys; ε1 =25 and ε2 =5.
NIH-PA Author Manuscript Commun Comput Phys. Author manuscript; available in PMC 2014 March 26.
Wang et al.
Page 16
NIH-PA Author Manuscript NIH-PA Author Manuscript
Figure 4.
The folding free energy changes calculated with Amber force field against experimental data shown with diamonds. (a) All mutations. (b) Mutation involving Asp. (c) Mutation involving Glu. (d) Mutation involving Arg. (e) Mutation involving His. (f) Mutation involving Lys.
NIH-PA Author Manuscript Commun Comput Phys. Author manuscript; available in PMC 2014 March 26.
Wang et al.
Page 17
NIH-PA Author Manuscript NIH-PA Author Manuscript
Figure 5.
The folding energy changes calculated with Charmm force field against the experimental data shown with diamonds. All mutations (upper-left), mutation Asp (upper-middle), mutation Glu (upper-right), mutation Arg (lower-left), mutation His (lower-middle), and mutation Lys (lower-right)
NIH-PA Author Manuscript Commun Comput Phys. Author manuscript; available in PMC 2014 March 26.
Wang et al.
Page 18
NIH-PA Author Manuscript Figure 6.
NIH-PA Author Manuscript
The folding energy changes calculated with OPLS force field parameters against the experimental data shown with diamonds. All mutations (upper-left), mutation Asp (uppermiddle), mutation Glu (upper-right), mutation Arg (lower-left), mutation His (lowermiddle), and mutation Lys (lower-right)
NIH-PA Author Manuscript Commun Comput Phys. Author manuscript; available in PMC 2014 March 26.
NIH-PA Author Manuscript
NIH-PA Author Manuscript
Ribonuclease Sa
Human Lysozyme
T4 Lysozyme
0.75 −1.01 −0.57
E41K E74K
−0.51
D17K D25K
0.35
D1K
−0.61
D49N −0.69
−1.96
R154E
D120N
0.09
1.94
K16E R119E
ΔΔG(delphie1=21 e2=7)
Mutations
4.28
−2.37
2.81
1.18
1.53
−2.06
−0.8
−1.64
1.3
0.72
ΔΔG(vdW surface)
6.2
−7.2
3.49
2.15
1.14
−2.28
0.41
−1.79
2.58
1.03
ΔΔG(SE surface)
1.1
−1.2
0.9
−1.1
0.4
−0.7
−1
−1.1
0
0.5
ΔΔG(exp)
Calculated folding energy changes with three different methods and experimental results for 10 mutations (Zhou and coworkers dataset [40]) involving charged residues. In the third column are the results obtained with DelPhi using SE with probe radius of 1.4A, the fourth and fifth columns are results taken from Ref [40] with vdW and SE surface, respectively. The last column is the experimental data taken from Ref. [40]. All energies are in [Kcal/mol]
NIH-PA Author Manuscript
Table 1 Wang et al. Page 19
Commun Comput Phys. Author manuscript; available in PMC 2014 March 26.
NIH-PA Author Manuscript
NIH-PA Author Manuscript
OPLS
Charmm
Amber
21
18 18
His
Lys
22
18 18 18 18
Glu
Arg
His
Lys
21 21
18 18 18 18
Glu
Arg
His
Lys
22
21
21
18
21
18
All
Asp
21
21
22
22
18
Asp
22
18
All
22
22
18
Arg
21
22
21
18
18
His ε2
Glu
18
All
Arg ε1
Asp
X
20
20
20
20
20
20
20
20
20
20
20
20
20
20
20
20
20
20
Lys ε3
18
17
17
18
17
17
17
17
17
17
17
17
18
18
18
17
17
18
Asp ε4
19
19
19
19
19
19
19
19
19
19
19
19
19
19
20
19
19
19
Glu ε5
11
11
11
11
11
11
11
11
11
11
11
11
10
10
11
11
11
10
Ser ε6
12
12
12
12
12
12
12
12
12
12
12
12
12
12
12
12
12
12
Thr ε7
13
13
13
13
13
13
13
13
13
13
13
13
13
13
13
13
12
13
Asn ε8
13
13
13
13
13
13
13
13
13
13
13
13
14
13
13
13
13
13
Gln ε9
18
18
14
16
18
16
14
18
14
14
14
14
14
18
16
14
14
14
Other ε10
Optimal sets of dielectric constants reported for the entiredataset and for mutations involving specific amino acid type calculated with Amber, Charm, and OPLSforce fields. The “X” stands for type of mutation, for example X=Asp indicates a mutation involving Asp.
NIH-PA Author Manuscript
Table 2 Wang et al. Page 20
Commun Comput Phys. Author manuscript; available in PMC 2014 March 26.
NIH-PA Author Manuscript
NIH-PA Author Manuscript
All Mutations
0.86
1.12
1.35
Force Field
Amber
Charmm
OPLS
1.28
0.65
0.31
Asp (D)
0.91
0.73
0.64
Glu (E)
1.11
1.31
0.63
Arg (R)
0.45
0.35
0.16
His (H)
1.54
1.36
0.90
Lys (K)
The RMSDs chart forall mutations and specific mutationsunder Amber, Charmm and OPLSforce fieldswith 10 dielectric constants model
NIH-PA Author Manuscript
Table 3 Wang et al. Page 21
Commun Comput Phys. Author manuscript; available in PMC 2014 March 26.