Available online at www.sciencedirect.com
ScienceDirect Procedia Engineering 72 (2014) 238 – 242
The 2014 conference of the International Sports Engineering Association
Using Distinctive Colour Signatures to Capture Team Behaviour During Matches José Pedro Silvaa *, Duarte Araújoa, A. Jorge Parolab, João Carlos Limab, Fernando Nabaisc, Nuno Cardosoc b
a Faculdade de Motricidade Humana, Universidade de Lisboa, Estrada da Costa, 1495-688, Cruz Quebrada, Portugal REQUIMTE, Departamento de Química, Faculdade de Ciências e Tecnologia, Universidade Nova de Lisboa, 2829-516, Monte da Caparica, Portugal c YDreams, Edifício YDreams, Madan Parque – Sul, P-2825-149, Caparica, Portugal
Abstract To capture team behaviour, kinematic variables, such as the surface area and the geometrical centre of the team, have been used. Although these variables have shown interesting results in capturing team behaviour, they reduce individual differences to a unique measure, losing the contribution of each player to the team. Using infrared (IR) dyes, it is possible for each player to have a distinctive colour signature to capture their behaviour online. The first stage of this study consisted in the selection of appropriate IR dyes with peak absorbance at different wavelengths (800nm, 910nm, 949nm and 1031nm) that were dissolved in solutions and diluted two times with a 1/5 ratio. To assess the contrast between the solutions, they were applied in a 6x4 chessboard. A unique colour signature was made composing an image from three different charge-coupled devices (CCDs) (one in the visible spectral region and two in the near IR) that were used like the RGB colour system. The IR markers absorbing at shorter wavelengths (800nm and 910nm) have a darker tone in the range 750-900nm and appear white between 900-1900nm. The markers with longer absorption wavelengths have a dark tone in both regions. We calibrated the images from the three CCDs and composed an image in which we give a different colour signature to each square. It is possible to create distinctive colour signatures using the coordinates from three different images.
© 2014 2014 The Elsevier Ltd. Published Open access under CC BY-NC-ND license. Authors. by Elsevier Ltd. © Selection and peer-review underresponsibility responsibilityofofthe theCentre Centrefor forSports SportsEngineering EngineeringResearch, Research, Sheffield Hallam University Selection and peer-review under Sheffield Hallam University. Keywords: infrared; colour signature; tracking system
* Corresponding author. Tel.: +351 919708915 E-mail address:
[email protected]
1877-7058 © 2014 Elsevier Ltd. Open access under CC BY-NC-ND license. Selection and peer-review under responsibility of the Centre for Sports Engineering Research, Sheffield Hallam University doi:10.1016/j.proeng.2014.06.042
José Pedro Silva et al. / Procedia Engineering 72 (2014) 238 – 242
1. Introduction Sport teams can be seen as complex open systems, where components are coupled by information, and whose interactions originate collective patterns (Passos et al., 2009). The interaction of individual, environment and task is responsible for a continuous emergence of patterns of intra- and inter-team interaction (Fonseca et al., 2013). The analysis of these complex social interactions has been developed using 2D positional data (Yue et al., 2008). In order to study the collective behaviours of sports teams, these analysis methods require the use of compound variables to functionally synthesize the high dimensional information emerging from the multiple interactions between constraints (McGarry, 2009; Schöllhorn, 2003). Some compound variables have already been used to capture complex group behaviors that express the collective patterns of performance in team sports. These variables include the surface area (see Frencken et al., 2011), the geometrical centre of teams (see Duarte et al., 2013; Frencken and Lemmink, 2008), the stretch index of teams (see Bourbousson et al., 2010), and the team length and width (see Folgado et al., 2012). These compound variables have revealed different trends in performance variation, attesting their complementarity for capturing the behaviours of sports teams as complex, dynamical systems during a game (Duarte et al., 2013). However, compound variables currently used to describe spatial behaviour, as they are calculated for each team, ignore the spatial distribution of the opponent team, the dimension of the field (Fonseca et al., 2013) and the contribution of each player to the team. Fonseca et al. (2013) defend that since the spatial organization of one team is influenced by the spatial organization of its opponent, the position of all players in the field must be considered, as well as its dimension, to define variables that describe teams’ spatial arrangement. Thus, some authors have suggested measures of spatial organization based on a geometric partition of space like Voronoi diagrams, obtained from manual digitization of players’ coordinates (Fonseca et al., 2013). Different methods have been used for sports performance analyses, with emphasis on full- and semi-automatic position tracking systems. An investigation carried out by Barros et al. (2007) used an automatic tracking system (DVideo, Campinas, Brazil) to measure distances covered by association football players. In each game, four digital cameras were fixed, each covering approximately a quarter of the field, with overlapping regions. After measuring the players’ positions, the 2D coordinates of the players were reconstructed using Direct Linear Transformation algorithms (2D-DLT). The percentage of automatic tracking was around 95% for each player and situations where players were not tracked automatically were corrected manually. However, the investigators claimed that it took approximately 16 hours to get the results (Barros et al., 2007). Prozone (West Yorkshire, England) is a video-based multi-player tracking system, designed for the analysis of football performance that requires multi-camera systems that is custom-fitted at sports stadia (Barris and Button, 2008). Di Salvo et al. (2006) analysed players’ displacements and speed on a football field. This system uses complex trigonometry, proper mathematical algorithms, image-object transformation methods such as DLT to calculate the positions of the players (Carling et al., 2008). Technology is facilitated by supportive information such as shirt color, optical character recognition of shirt numbers and prediction of running patterns to help maintain accurate player identification and tracking (Carling et al., 2008). However, in this system, operators are required to continuously and manually verify if the players are being correctly tracked (Barris and Button, 2008) and do not provide a real-time analysis. Results are generally available within 24-36 hours of the final whistle. Other methods such as global positioning systems (GPS) or the LPM Soccer 3D developed by INMOTIO have the disadvantage that in association football, electronic devices are restricted to measure players’ performance only during practice sessions or friendly matches, because they require a receiver to be worn by each athlete, which is currently forbidden by FIFA International Board (Carling et al. 2008). The aim of the present study is to contribute to the development a non-intrusive and automatic tracking system that is able to distinguish every player on the field, calculate compound variables and thus, give information about the influence (“weight”) that each player has on the collective behaviour of the team. This method is based on infrared markers (that absorb the infrared light) to create distinctive colour signatures similar to the RGB code system. 2. Method 2.1 Materials
239
240
José Pedro Silva et al. / Procedia Engineering 72 (2014) 238 – 242
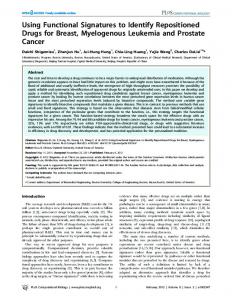
The markers selected were QCR (QCR Solutions Corp) NIR 1031M, NIR 949A, NIR 910C, NIR 800A, which have absorption maxima at 1031nm, 949nm, 910nm and 800nm, respectively. The markers selected are powders that are soluble in alcohols or acetone. The colour coordinates were taken using two video-cameras: AD-080GE (JAI) with two charge-coupled devices CCDs (one for the visible and one for the near IR (750-900nm)), and BOBCAT 1.7-320 (Xenics) that captures only in the IR (until 1900nm). 2.2 Procedures The markers were dissolved in acetone with a concentration of approximately 2.50 g/L. The original solution was diluted two times with a 1/5 ratio, generating three solutions for each marker, twelve in the total. To assess the contrast between the solutions, they were applied in a 6x4 chessboard, where each row corresponds to a marker. The first row was painted with the three solutions of the marker with the shorter absorption maximum (NIR 800A), the second row was painted with the three solutions of the marker with the second shorter absorption maximum (NIR 910C) and so on. Each solution was painted in two squares (a black and a white square) in descending order of concentration: the first two squares, of each row, were painted with the more concentrated solutions, the third and fourth, with the second most concentrated solution of the same marker, and so on. A unique colour signature was made composing a single image from three different images (one in the visible and two in the near IR). The images from both cameras were equalized to have the same “weight” in the composed image. To calibrate the cameras, as they had different resolutions, they detected a 6x4 chess pattern. The colour signatures were generated through the tones of grey of each marker’s different concentrations. Every concentration of every marker had a different tone of grey in each image because, for each wavelength range that the different CCDs capture, the infrared absorption is different, giving it a specific tone of grey. Each one of the grey tones was assumed to be a coordinate like the RGB code system (red, blue and green) and the compound colour was created through the three coordinates. To each set of coordinates, a different colour was attributed. Then, we could impregnate the markers into the T-shirts wore by the players and attribute, to every player, a single and distinct colour, making it possible to distinguish every player on the field. 3. Results and Discussion The IR markers with shorter wavelength maxima (NIR 910C, NIR 800A) had a darker tone between 750-900nm (Fig. 1b) and appeared white between 900-1900nm (Fig. 1c). In contrast, the markers with longer wavelength maxima (NIR 1031M and NIR 949A) had a dark tone between the 900-1900nm and have a lighter tone between 750-900nm. In the visible (Fig. 1a) the markers were very similar. Within each marker, the more concentrated solutions were darker than the less concentrated ones because the former absorb more IR light and thus appear darker. In the composed image (Fig. 1d) the squares presented different colours. The most concentrated solutions of NIR 800A have a yellow and green hue and the two most concentrated solutions of NIR 1031M and NIR 949A have a purple colour. Despite NIR 949A having a different wavelength maxima, it also absorbs beyond that point making it very similar to NIR 1031M. The squares with the less concentrated solutions of NIR 800A and NIR 910C appear white and blue, meaning that their concentration is too low and did not absorb enough IR light. In this study we used dilutions of 1/5 which may reveal why the less concentrated solutions were similar to the squares that were not painted. With smaller dilutions, of 1/3 or 1/2 for example, we might have more distinguishable solutions in the IR and thus more colours. Another issue that has to be addressed is the light conditions, since this study was performed in an office setting with a mix of natural and artificial light. It is necessary to assess the markers in an outdoor setting with and without direct sun light exposure. Also, further studies need to be made in different fabrics to assess the IR concentration of the markers. The importance of using infrared markers means that we can track the players without them carrying any other device, beyond the regular equipment used in competition. Also, as reported by Carling et al. (2008), technology used by Prozone is facilitated by information like shirt colour, meaning that this system can be a good complement of that algorithm.
José Pedro Silva et al. / Procedia Engineering 72 (2014) 238 – 242
a
b
c
d
241
Fig. 1 (a) AD-080GE visible CCD; (b) AD-080GE near IR CCD; (c) BOBCAT camera image; (d) compound image
4. Conclusion We conclude that it is possible to create distinctive colour signatures using the coordinates from three different images. This study is the first stage of developing a non-intrusive and automatic tracking system that is able to distinguish every player in the field. Further studies will be held with association football players in real game situations to capture the emergence of collective patterns of behaviour. Acknowledgements This research was part of a project funded by Foundation for Science and Technology (Portugal) with the reference PTDC/DES/119678/2010. References Araújo, D., Davids, K., Hristovski, R., 2006. The ecological dynamics of decision making in sport. Psychology of Sports and Exercise, 7, 65376. Barris, S. and Button, C., 2008. A review of vision-based motion analysis in sport, Sports Medicine, 38:12, 1025-1043. Barros, R.M.L., Misuta, M.S., Menezes, R.P., Figueroa, P.J., Moura, F.A., Cunha, S.A., Anido, R., Leite, N.J., 2007. Analysis of the distances covered by first division Brazilian soccer players obtained with an automatic tracking method. Journal of Sports Science and Medicine, 6, 233-242.Bekraoui, N., Cazorla, G., Leger, L., 2009. Validité et limite de la technique du GPS dans l’analyse de la tâche en Football, in “Science & Football: Recherches et Connaissances Actuelles”. In: Zoudji, B. (Ed.). Presses Universitaires de Valenciennes, pp. 363-377 Bourbousson, J., Séve, C., McGarry, T., 2010. Space-time coordination dynamics in basketball, Part 2: The interaction between the two teams, Journal of Sports Sciences, 28, 349–358. Carling, C., Bloomfield, J., Nelsen, L., Reilly, T., 2008. The role of motion analysis in elite soccer: Contemporary performance measurement techniques and work rate data. Sports Med. 38:10, pp. 839-862 Dellal, A., Ignatowicz, L., Dyon, N., 2009. Comment les nouvelles technologies vont être exploitées pour affiner les analyses de l’activité du footalleur de haut Niveau- en fonction du temps de jeu effectif?, in “Science & Football: Recherches et Connaissances Actuelles”. In: Zoudji, B. (Ed.). Presses Universitaires de Valenciennes, pp. 363-377
242
José Pedro Silva et al. / Procedia Engineering 72 (2014) 238 – 242
Di Salvo, V., Collins, A., Mcneill, B., Cardinale, M., 2006. Validation of Prozone: a new video-based performance analysis system. International Journal of Performance Analysis in Sports, 6, 108-19 Duarte, R., Araújo, D., Folgado, H., Esteves, P., Marques, P., Davids, K., 2013. Capturing complex, non-linear team behaviours during competitive football performance. Journal of Systems Science and Complexity, 26, 62-72. Folgado, H., Lemmink, K., Frencken, W., Sampaio, J., 2012. Lenght, width and centroid distance as measures of teams tactical performance in youth football. European Journal of Sport Science, 1-6. Fonseca, S., Milho, J., Travassos, B., Araújo, D., Lopes, A., 2013. Measuring spatial interaction behaviour in team sports using superimposed Voronoi diagrams. International Journal of Performance Analysis in Sport, 13, 179-189. Frencken, W., Lemmink, K., 2008. Team kinematics of small-sided soccer games: a systematic approach, in “Science and Football VI: The Proceedings of the Sixth World Congress on Science and Football”. In: Reilly, T., Korkusuz, F. (Eds.), Routledge, New York, pp. 161-166. Frencken, W., Lemmink, K., Delleman, N., Visscher, C., 2011. Oscillations of centroid position and surface area of soccer teams in small-sided games. European Journal of Sport Science, 11:4, 215-223. McGarry, T., 2009. Applied and theoretical perspectives of performance analysis in sport: Scientific issues and challenges. International Journal of Performance Analysis in Sport, 9, 128-140. Passos, P., Araújo, D., Davids, K., Gouveia, L., Serpa, S., Milho, J., Fonseca, S., 2009. Interpersonal pattern dynamics and adaptive behavior in multiagent neurobiological systems: Conceptual model and data. Journal of Motor Behavior, 41:5, 445–459. Schöllhorn, W., 2003. Coordination dynamics and its consequences on sports, International Journal of Computer Science in Sport, 2:2, 40–46. Yue, Z., Broich, H., Seifriz, F., Mester, J., 2008. Mathematical analysis of a soccer game. Part I: Individual and collective behaviors, Studies in Applied Mathematics, 121, 223–243.