Nov 14, 2008 - Cynthia Roesler. Naseem Choudhury ...... Fenson, L. S., Dale, P. S., Reznick, J. S., Bates, E., Thal, D., &. Pethick, S. (1994). Variability in early ...
J Learn Disabil OnlineFirst, published on November 14, 2008 as doi:10.1177/0022219408326215
Using Early Standardized Language Measures to Predict Later Language and Early Reading Outcomes in Children at High Risk for Language-Learning Impairments
Journal of Learning Disabilities Volume XX Number X Month XXXX xx-xx © 2008 Hammill Institute on Disabilities 10.1177/0022219408326215 http://journaloflearningdisabilities .sagepub.com hosted at http://online.sagepub.com
Judy F. Flax Teresa Realpe-Bonilla Cynthia Roesler Naseem Choudhury April Benasich Rutgers University The aim of the study was to examine the profiles of children with a family history (FH+) of language-learning impairments (LLI) and a control group of children with no reported family history of LLI (FH–) and identify which language constructs (receptive or expressive) and which ages (2 or 3 years) are related to expressive and receptive language abilities, phonological awareness, and reading abilities at ages 5 and 7 years. Participants included 99 children (40 FH+ and 59 FH–) who received a standardized neuropsychological battery at 2, 3, 5, and 7 years of age. As a group, the FH+ children had significantly lower scores on all language measures at 2 and 3 years, on selected language and phonological awareness measures at 5 years, and on phonological awareness and nonword reading at 7 years. Language comprehension at 3 years was the best predictor of later language and early reading for both groups. These results support past work suggesting that children with a positive family history of LLI are at greater risk for future language and reading problems through their preschool and early school-age years. Furthermore, language comprehension in the early years is a strong predictor of future language-learning status. Keywords: oral and written language; at risk; early identification
M
uch has been written about predicting languagebased learning outcomes from language and cognitive function at very early ages. This interest has come from two different directions. First, researchers are interested in understanding how, under normal circumstances, early brain development interacts with the environment to impact language and learning and the etiology of any deviation from the normal trajectory of development. Second, parents, educators, and clinicians are concerned with the identification, remediation, and subsequent development of children at risk for future difficulties. One such risk group is children born into families with a history of language-related difficulties (such as dyslexia and specific language impairment [SLI]). For both researchers and clinicians, it is important that the tools used to diagnose and follow the progress of children’s language development reliably measure and characterize language disposition both concurrently and predictively.
Whereas other studies have looked prospectively at children at risk for future language-related problems based on delayed receptive and/or expressive language during the 2nd year of life, we have chosen to follow the language development and early learning development, from infancy through the early school years, of a unique sample of children who are at higher risk for languagelearning impairments (LLI) by virtue of their birth into families with at least one first-degree relative with a documented language-based learning disability. Our sample was ascertained at least 6 months prior to the development of oral language, and consequently, the language dispositions of these children were unknown to us when Authors’ Note: We thank all of the families in this study who have spent countless hours in our lab over the years so that we might begin to answer some of the questions of how language and reading are related. Their enthusiasm and dedication to our work have made this article possible.
1
2 Journal of Learning Disabilities
we began collecting data. The aims of this study were twofold: first, to compare the language profiles of two groups of children from 2 through 7 years old, one group with a family history of LLI (FH+) and a control group with no reported family history of LLI (FH–); and second, to document which of the earlier standardized language measures from ages 2 and 3 years reliably predict expressive and receptive language abilities, phonological awareness, and reading abilities at 5 and 7 years of age.
Receptive and Expressive Language as Early Predictors There is great variability in the rates of very early language learning, which has been reflected in studies using both observational surveys (Rescorla, 1989) and standardized measures (Fenson et al., 2000; Fenson et al., 1994). Most studies have examined children with some type of delayed language (both receptive and expressive delays or expressive delay only) to determine how early language (at approximately 2 years or younger) relates to early school-age outcomes as well as to academic success into adolescence. Evidence from this large body of literature is mixed and somewhat inconclusive. Some studies suggest that at the very early stages of language development, receptive language is a better indicator of future language abilities (Bates, Bretherton, & Snyder, 1988; Rescorla, 1989; Whitehurst & Fischel, 1994). Other research indicates that delayed expressive language alone may also be an indicator of later language and learning behaviors (Paul, 1996; Rescorla, 2002). Another set of studies suggest that those children with both receptive and expressive language difficulties are most at risk for continued language difficulties (Thal, Jackson-Maldonado, & Acosta, 2000; Thal, O’Hanlon, Clemmons, & Fralin, 1999; Thal, Tobias, & Morrison, 1991). Once normally developing children reach 3 years of age, the variability that is often observed in the previous years begins to stabilize. Most 3-year-olds have more “adultlike” phonological, syntactic, and morphological systems. At this age, they can produce an extensive array of vowel and consonant sounds and can use simple sentence construction as well as a variety of negative, interrogative, and imperative sentence forms. In addition, they are beginning to develop more advanced phonological skills as well as the use of pronouns, prepositions, and verb endings, making their language more intelligible to people familiar and unfamiliar to them (Owens, 2001). Such skills allow for a better assessment of emerging language through the use of a wider variety of standardized measures, thus possibly making the results of 3-year-old language and cognitive
scores more valid predictors of language-based abilities in school-age children. A large literature demonstrates associations between early and concurrent oral language abilities and reading outcomes. Longitudinal research indicates that children who exhibit difficulties in developing oral language during the early and late preschool years are at increased risk for later language, reading, and general academic difficulties (Aram & Hall, 1989; Bishop & Adams, 1990; Catts, 1993; Catts, Fey, Tomblin, & Zhang, 2002; Scarborough & Dobrich, 1990; Tallal, Allard, Miller, & Curtiss, 1997). In an extensive review of follow-up studies of preschool children with speech and language problems, published between 1965 and 1987, Aram and Hall (1989) reported that anywhere from 40% to 100% of these children continued to have oral language problems during the school-age years and that 50% to 75% reported having reading and other academic difficulties. Scarborough and Dobrich (1990) reported that children who exhibited poor syntactic skills and phonological productions at 30 months of age were later identified as poor readers, whereas Bishop and Adams (1990) found that those children identified at 4 years old with language problems, whose language issues persisted at 5 1/2 years, had poor reading achievement at 8 1/2 years. Catts, Fey, and Proctor-Williams (2000) looked at relations between language and reading in children identified with spoken language impairments and in children with normally developing language and concluded that both phonological awareness and oral language contributed to reading success. Most recently, Wise, Sevcik, Morris, Lovett, and Wolf (2007) reported on the relations among oral language skills and reading skills in a group of 279 reading-disabled second and third graders. The authors found that concurrent receptive and expressive vocabularies were significantly related to prereading abilities and that both expressive vocabulary and listening comprehension were significantly related to single-word reading. Early language impairments have also been found to affect oral and/or written language abilities throughout the life span so that language and/or academic difficulties can extend through adolescence and well into adulthood. Longitudinal studies demonstrate that even individuals whose early oral language difficulties appear to have resolved are still at higher risk for later deficits in phonological processing, literacy, and general learning difficulties that are language-based in nature (Scarborough & Dobrich, 1990; Snowling, Bishop, & Stothard, 2000). Stothard, Snowling, Bishop, Chipchase, and Kaplan (1998) found that children whose oral language problems had resolved by age 5 performed well as adolescents in the area of language comprehension but continued to manifest problems in phonological processing and literacy skills. Those children
Flax et al. / Early Standardized Language Measures 3
who had significant language problems at age 5 continued to have both oral and written language problems as adolescents. In another prospective study, Gallagher, Frith, and Snowling (2000) studied children at risk for future reading problems because of an identified reading problem in a first-degree relative. At 45 months, the “at-risk” children scored worse than their matched controls on measures of receptive and expressive vocabulary, expressive language, nonword repetition, rhyming, digit span, and letter knowledge. By 6 years of age, 57% scored more than one standard deviation below the mean on measures of literacy skills. Eklund, Lyytinen, and Lyytinen (2005) followed latetalking children who were at risk for dyslexia because of family history (n = 107) and a control group of late-talking children with no family history (n = 93). Late-talking children who had mixed language delay (receptive and expressive) and a positive family history performed the worst in language of all the children in the study at 5 1/2 years and in reading by the end of the second grade. Interestingly, even those children in the family-history group who did not experience delayed language had significantly lower scores than did their controls in reading and spelling, supporting the importance of family history over and above the influence of early language delay. There is ample evidence to suggest that children who demonstrate deviations in their early speech and language development run the risk of continued speech and language issues throughout later childhood. In addition, even when language issues have resolved, predictive studies reveal that children with early language delay are at higher risk throughout their lives for related difficulties in phonological awareness, reading, and writing. Children who have a family history of language-based learning disabilities run a similar risk.
Effects of Family History on Language Abilities LLIs run in families such that children who are born into families with affected family members are at an elevated risk for the disorder (Bishop & Edmundson, 1986; Bishop, North, & Donlan, 1995; Choudhury & Benasich, 2003; DeThorne et al., 2006; Flax et al., 2003; Lahey & Edwards, 1995; Neils & Aram, 1986; Tallal et al., 2001; Tallal, Ross, & Curtiss, 1989; Tomblin & Buckwalter, 1998; Tomblin, 1989; Van Der Lely & Stollwreck, 1996). Studies suggest that the rates of affected individuals in families with a positive history for LLI range from 20% to 80% (Bishop & Edmundson, 1986; Flax et al., 2003; Rice, Haney, & Wexler, 1998; Tallal et al., 2001; Tallal, Ross, & Curtiss, 1989; Tomblin, 1989). In a review of 18 family-aggregation studies of language impairment, Stromswold (1998, 2001) noted that when both reading and language were included
in impairment rates, the incidence of affected individuals in families with a history of LLI ranged from 24% (Bishop & Edmundson, 1986) to 78% with a mean incidence of 46%. The incidence of LLI in control families ranged from 3% (Bishop & Edmundson, 1986) to 46% (Tallal, Ross, & Curtiss, 1989) with a mean rate of 18%. In addition to family aggregation studies, behavioral genetics research has demonstrated that speech and language disorders have a highly heritable component (for reviews, see Leonard, 1998, and Lewis et al., 2006; for a review of the genetics of language and methodology, see Brzustowicz, 1996). Such studies have reported that monozygotic twins show a higher concordance rate (range .70–.96) for language-based learning disorders as compared with dizygotic twins (range .46–.69; Bishop, North, & Donlan, 1995; Lewis & Thompson, 1992; Tomblin & Buckwalter, 1998). Most recently, DeThorne et al. (2006) reported that in a cohort of 248 twin pairs, those children who had histories of speech and language difficulties scored significantly lower than unaffected children on measures of early reading. Recent studies have also shown that infants born into a family with a positive history for language or reading problems run a greater risk of developing the same kinds of problems themselves (Choudhury & Benasich, 2003; Gallagher, Frith, & Snowling, 2000; Spitz, Tallal, Flax, & Benasich, 1997). In a study of children born into families with a positive family history for LLI, Spitz et al. (1997) found that by 3 years old, as a group, these children scored significantly lower than their matched controls on measures of language but showed no difference in nonverbal skills. In a related family-aggregation study, Choudhury and Benasich (2003) found that 3year-olds from families with a positive history for SLI scored significantly lower on standardized measures of language and were more likely to fall one or more standard deviations below the mean than a matched control group with no family history of SLI (28% vs. 8%). Given prior evidence showing that there are robust relations between early language development and later language-based learning outcomes, that the great variability of early language learning stabilizes by age 3, and that the risk of developing language-based learning problems for children born into families with a history of these problems is significant, it seems necessary to examine the following questions: (a) Do children with and without a family history of LLI differ in their language, phonological, and reading abilities at 2, 3, 5, and 7 years of age? (b) What are the associations among early receptive and expressive language abilities and later language, phonological, and early reading skills? (c) Are 2- or 3-year language measures better predictors of language-learning outcomes at 5 and
4 Journal of Learning Disabilities
7 years? To address these questions, we compared the early language abilities of two groups of children (FH+ and FH–) and then examined the associations between early language measures (at 2 and 3 years of age) and later language, phonological awareness, and reading measures (at 5 and 7 years of age) in addition to how well early language predicts performance on 5- and 7-year language and early reading outcomes.
Method Participants The data for this study were drawn from a larger, 7-year longitudinal study examining the role of early infant precursors in later language-based learning and cognition. In this study, we report on the outcomes of 2-year-old children, who were recruited as infants from local obstetricians and pediatric practices in northern New Jersey. During the course of the larger study, the children received a comprehensive battery of age-appropriate standardized tasks that included language, cognition, and early reading measures as well as experimental tasks that assessed infant speed of processing, attention, and learning. Here, we report the results from a subset of the standardized assessments that these children received at 2, 3, 5, and 7 years of age. Forty (40) children (male = 22) reported a positive family history for LLI. To be classified as FH+, families provided us with clinical documentation of LLI for the proband. The term proband refers to the individual who meets the behavioral criteria for induction into the study. For all child probands, we required a confirmatory clinical report of an oral or oral and written language impairment (at least one standard deviation below peers on a comprehensive test of oral language) and/or a formal diagnosis from a speech or language pathologist, neurologist, school psychologist, or learning consultant. In the case of parents where no current clinical evaluation was available, a licensed speech or language pathologist made the determination based on a comprehensive personal history that included information on (a) whether the parents were retained a grade in school, (b) whether they were given a diagnosis of dyslexia or a speech or language disorder, and (c) whether they received at least 2 years of language or reading support services. If they responded positively to two out of the three criteria, they were categorized as FH+. Parents who received speech therapy only for articulation or stuttering difficulties were not included. In this sample, 18% (7/40) of the probands were fathers, 13% (5/40) were mothers, 43% (17/40) were brothers, and 25% (10/40) were sisters. In one case, the subject had no
Table 1 Standardized Assessments by Age Assessment Ages (years)
PLS-3 Auditory Comprehension, Verbal Expression MacArthur CDI Words and Sentences, MLU TOLD-P3 Token Test for Children PAT Rhyme, Blending, Deletion WRM Word Attack, Word Identification, Passage Comprehension Stanford-Binet Intelligence Scale
2
3
5
X
X
X
7
X
X
X X X
X X X X
X
X
Note: CDI = Communicative Development Inventory (Fenson et al., 1993a, 1993b); MLU = Mean Length of Utterance; PAT = Phonological Awareness Test (Robertson & Salter, 1997); PLS-3 = Preschool Language Scale–3 (Zimmerman, Steiner, & Pond, 1992); Token Test for Children (DiSimoni, 1978); TOLD-P3 = Test of Language Development–Primary, Third Edition (Newcomer & Hammill, 1997); WRM = Woodcock Reading Mastery (Woodcock, 1987).
siblings, but the maternal uncle reported severe language and reading problems. Control children (FH–; n = 59, males = 28) reported no known family history of LLI or any other related disorders. The Hollingshead (1975) FourFactor Index revealed no difference in socioeconomic status between the groups (t = .62, p > .05). Furthermore, the number of children who received language-based intervention during their preschool years did not differ between groups (FH+, 8/38 = 21%; FH–, 6/59 = 10%), χ2 = 2.22, p > .05. The Rutgers University Institutional Review Board approved the study, and appropriate consents were obtained.
Measures A subset of age-appropriate standardized measures of language, phonological awareness, and early reading was selected for this study (Table 1). At each age, the comprehensive oral language measure produced individual receptive (LANG-R) and expressive (LANG-E) language scores that were used to follow language growth over time. At 2 and 3 years of age, the Preschool Language Scale–3 (PLS-3; Zimmerman, Steiner, & Pond, 1992) was used to assess receptive (Auditory Comprehension) and expressive (Expressive Communication) language skills. The Communicative Development Inventory (CDI; Fenson et al., 1994), a standardized parental report checklist, was also part of the 2-year standardized battery and provided an
Flax et al. / Early Standardized Language Measures 5
Table 2 Intercorrelations of 2-Year Language Measures 24 CDI W&S 24 CDI W&S 24 CDI MLU 24 PLS-3 Receptive 24 PLS-3 Expressive
24 CDI MLU
24 PLS-3 Receptive
24 PLS-3 Expressive
0.70**
0.65** 0.65**
0.74** 0.72** 0.69**
Note: r values presented. CDI = Communicative Development Inventory; MLU = Mean Length of Utterance; PLS-3 = Preschool Language Scale–3; W&S = Words and Sentences. *p < .05. **p ≤ .001.
expressive language score as well as a Mean Length of Utterance (MLU) score. However, preliminary analyses revealed significant intercorrelations among all four language measures in both groups at 2 years (PLS–Auditory Comprehension, PLS–Expressive Communication, and CDI–Words and Sentences and MLU; Table 2). Because the correlations between the PLS–Expressive Communication and the CDI–Words and Sentences and MLU were so strong (r = .74 and r = .72, respectively), we opted to include only one measure of expressive language at 2 years of age for all subsequent analyses. Therefore, the correlation and regression analyses we present are restricted to the PLS–Auditory Comprehension and PLS–Expressive Communication as they were the most comprehensive of the language measures at 2 years of age. At 5 and 7 years of age, the majority of participants (n = 66) received the Test of Language Development–Primary, Third Edition (TOLD-P3; Newcomer & Hammill, 1997). Receptive language ability was derived from the Listening cluster of subtests, and expressive language ability was derived from the Speaking cluster. A small group of children received only the PLS-3. However, a subgroup of 16 children (8 = FH+ and 8 = FH–) received both the PLS3 and the TOLD-P3, thus allowing us to assess differences associated with the demand characteristics of each test and the reliability of using either measure at 5 years to assess receptive and expressive language scores. A within-subjects analysis revealed no significant difference based on the measures, F(1, 15) = 0.07, p = .80, and the scores from both the assessments were significantly correlated (r = .59, p < .05). Therefore, the PLS-3 scores were used for receptive and expressive language at 5 years for those children who received only the PLS-3, whereas all other receptive and expressive language scores at 5 years were derived from the TOLD-P3. At 5 and 7 years of age, the Token Test (DiSimoni, 1978), a measure that taps verbal memory and the ability to follow directions of increasing length and grammatical complexity, was included as an auxiliary test of receptive language. It has been a reliable measure in the
past (Flax et al., 2003; Tallal et al., 2001) for capturing characteristics of receptive language (i.e., following increasingly longer and grammatically complex directions) that are not directly assessed in the language battery but are an important component of language in the school setting. In addition, three subtests that measure phonological awareness were introduced from the Phonological Awareness Test (Robertson & Salter, 1997): Rhyming, Deletion, and Blending of words. At 7 years of age, three subtests of the Woodcock Reading Mastery Tests–Revised (Woodcock, 1987) were administered to assess early reading abilities: Word Identification, a measure of single-word reading; Word Attack, a measure of nonword reading; and Passage Comprehension, a measure of listening comprehension. In addition to the language measures, each child received The Stanford-Binet Intelligence Scale–Fourth Edition (Thorndike, Hagen, & Sattler, 1986) at 3, 5, and 7 years of age to assess general cognitive ability. The Abstract Visual Reasoning cluster was used as a measure of nonverbal IQ. A repeated measures analysis of variance (ANOVA) was performed to determine whether the two groups differed on overall cognitive ability and specifically on nonverbal ability. Results indicated that the groups did not differ on overall cognitive ability—36 months, F(1, 82) = 3.8, p = .06; 60 months, F(1, 73) = 3.4, p = .07; and 84 months, F(1, 59) = 0.34, p = .57)— or on specifically nonverbal abilities—36 months, F(1, 82) = 1.2, p = .28; 60 months, F(1, 73) = 1.97, p = .16; and 84 months, F(1, 59) = 0.86, p = .36.
Statistical Analyses Initial analyses included a univariate analysis procedure performed on each of the variables to obtain descriptive statistics. Group differences in receptive and expressive language were evaluated using an ANOVA. Pearson product–moment correlations were performed to examine associations among early language measures
6 Journal of Learning Disabilities
Table 3 Mean Standardized Language, Phonological Awareness, and Early Reading Scores by Family History FH+
2 years PLS-3 Receptive Language PLS-3 Expressive Language CDI Words and Sentences CDI MLU 3 years PLS-3 Receptive PLS-3 Expressive Nonverbal IQ 5 years *Receptive Language Score *Expressive language score Token Test total PAT Rhyming PAT Blending PAT Deletion Nonverbal IQ 7 years TOLD-P3 Receptive (Listening) TOLD-P3 Expressive (Speaking) Token Test total PAT Rhyming PAT Blending PAT Deletion WRM Word Attack WRM Word Identification WRM Passage Comprehension Nonverbal ability
FH–
M
SD
M
SD
F
p
Cohen’s d
91.20 95.09 36.16 1.78
14.59 14.68 28.51 0.49
105.08 104.35 49.93 2.14
17.04 14.01 30.38 0.41
15.53 8.79 4.81 14.85
.000 .004 .031 .000
.89 .64 .44 .79
100.72 94.75 104.42
20.62 15.76 11.74
111.33 107.31 107.38
17.00 16.77 12.27
7.09 12.71 1.17
.009 .001 ns
.59 .83 .26
105.49 102.74 96.71 103.16 94.04 102.00 101.79
21.04 19.02 14.60 13.92 13.03 10.05 13.57
113.78 109.43 102.78 111.77 100.27 101.47 105.95
13.22 12.31 9.42 9.65 11.50 9.39 11.95
4.36 3.34 3.89 8.35 1.82 0.04 1.97
.04 ns .05 .005 ns ns ns
.10 .44 .50 .71 .49 –.10 .33
106.00 103.56 99.41 101.93 91.89 100.41 101.46 108.00 104.35 96.96
11.59 12.97 14.76 12.77 16.02 13.60 10.89 15.18 15.31 19.23
110.41 105.74 105.94 106.74 96.26 103.06 107.44 113.53 110.62 100.71
9.86 11.35 7.25 4.44 13.07 10.80 10.88 15.17 12.17 12.22
2.58 .49 5.12 4.20 1.38 0.721 4.44 1.96 3.12 0.86
ns ns .027 .045 ns ns .039 ns ns ns
.39 .17 .54 .55 .34 .25 .60 .33 .44 .25
Note: CDI = Communicative Development Inventory; MLU = Mean Length of Utterance; FH+ = family history of language-learning impairments; FH– = no reported family history of language-learning impairments; PAT = Phonological Awareness Test; PLS-3 = Preschool Language Scale–3; TOLD-P3 = Test of Language Development–Primary, Third Edition; WRM = Woodcock Reading Mastery.
at 2 and 3 years of age and all outcome measures at 5 and 7 years of age for both groups. Finally, these data were used to guide a series of hierarchical regressions that were performed to determine the predictability of early language measures to 5- and 7-year outcome variables of language, phonological awareness, and early reading. t tests revealed no sex differences on the standardized measures reported in this study except for the 5-year blending score, t(1, 59) = 2.09, p = .04.
Results Comparison of Standardized Scores by Family History At 2 and 3 years, the FH+ and FH– groups significantly differed on all language measures. The FH+ group
consistently scored lower in both receptive and expressive language. At 5 years, composite receptive language scores as well as the Token Test and rhyming continued to reveal differences between the groups. At 7 years, the Token Test, rhyming, and nonword reading differed between the two groups (Table 3).
Associations Among Language, Phonological Awareness, and Early Reading Measures Because the FH+ and FH– groups differed on a number of measures, correlation analyses were run separately by group (FH+ and FH–) to examine within-group patterns of associations. Overall, a number of significant associations were seen between early (2 and 3 year) and later (5 and 7 year) language measures, with the number of associations for receptive language being greater than that for expressive
Flax et al. / Early Standardized Language Measures 7
Table 4 Correlations of 2- and 3-Year Language Measures to 5-Year and 7-Year Outcome Measures by Family History FH+
5-Year LANG-R 5-Year LANG-E 5-Year TOKEN 5-Year RHYME 5-Year DEL 5-Year BLEND 7-Year LANG-R 7-Year LANG-E 7-Year TOKEN 7-Year RHYME 7-Year DEL 7-Year BLEND 7-Year PC 7-Year WA 7-Year WID
FH–
2-Year LANG-R
2-Year LANG-E
3-Year LANG-R
3-Year LANG-E
0.46* 0.59*
0.56** 0.68**
0.77** 0.78** 0.78** 0.53*
0.73** 0.71** 0.66** 0.53*
0.46* 0.46*
0.42* 0.42* 0.61**
0.51*
0.51**
0.44*
2-Year LANG -R
3-Year LANG-R
3-Year LANG-E 0.49* 0.39*
0.37*
0.43* 0.58** 0.38*
0.42*
0.49**
0.45 **
2-Year LANG-E
0.35*
0.39*
0.44* 0.56** 0.46* 0.60**
Note: r values presented. BLEND = Phonological Awareness Test–Blending; DEL = Phonological Awareness Test–Deletion; FH+ = family history of language-learning impairments; FH– = no reported family history of language-learning impairments; LANG-E = expressive language ability; LANG-R = receptive language ability; PC = Woodcock Reading Mastery–Passage Comprehension; RHYME = Phonological Awareness Test–Rhyming; TOKEN = Token Test; WA = Woodcock Reading Mastery–Word Attack; WID = Woodcock Reading Mastery–Word Identification. *p < .05. **p ≤ .001.
language and with the majority of these associations being stronger in magnitude for the FH+ group. Furthermore, 3year measures were more strongly associated with 5- and 7-year language outcomes than were the 2-year measures. The following sections summarize the data by group (Table 4).
+ FH+ Significant associations were found between 2-year language measures and 5-year outcome measures: 2-year receptive language was associated with 5-year receptive language (r = .46, p < .05), expressive language (r = .59, p < .05), the deletion task (r = .46, p < .05), and sound blending (r = .46, p < .05); and 2-year expressive language was related to 5-year receptive (r = .56, p < .001) and expressive language (r = .68, p < .001). For example, children who demonstrated weaker receptive and expressive language skills at 2 years of age had lower standard scores on 5-year receptive and expressive language, deletion, and blending. At 7 years, only 2-year receptive language was found to be associated with the 7-year deletion task (r = .51, p < .05). A greater number and more significant associations were found between 3-year language measures and 5-year outcome measures: 3-year receptive language was strongly
associated with 5-year receptive language (r = .77, p < .001), expressive language (r = .78, p < .001), the Token Test (r = .78, p < .001), rhyming (r = .53, p < .05), and blending (r = .42, p < .05); and 3-year expressive language was significantly related to 5-year receptive language (r = .73, p < .001), expressive language (r = .71, p < .001), the Token Test (r = .66, p < .001), and rhyming abilities (r = .53, p < .05). Thus, children who scored more poorly on receptive and expressive language skills at age 3 demonstrated lower standard scores on 5-year language and phonological abilities. At 7 years of age, 3-year receptive language was associated with 7-year expressive language (r = .42, p < .05), the Token Test (r = .61, p < .001), and the deletion task (r = .44, p < .05). Finally, 3-year expressive language was associated only with 7-year Token scores (r = .51, p < .05).
FH– Similarly, significant associations were shown between 2-year receptive language measures and 5-year outcomes, including expressive language (r = .45, p < .001), rhyming (r = .37, p < .05), and blending (r = .42, p < .05). Children who demonstrated weaker receptive language skills at age 2 achieved lower standard scores on 5-year expressive language, rhyming, and blending.
8 Journal of Learning Disabilities
However, 2-year expressive language was not found to be associated with any of the 5- or 7-year measures. At 3 years of age, receptive language was related to 5year expressive language (r = .43, p < .05), the Token Test (r = .58, p < .001), rhyming (r = .38, p < .05), and the blending task (r = .49, p < .001). Expressive language at 3 years was associated with 5-year expressive language (r = .49, p < .05) and with the Token Test (r = .39, p < .05). Therefore, children who demonstrated weaker language skills at 3 years of age demonstrated lower language abilities at 5 years. Similar patterns emerged among 3-year and 7-year language measures: 3-year receptive language was significantly associated with the Token Test (r = .35, p < .05), the deletion task (r = .44, p < .05), and all three reading measures (Passage Comprehension, r = .56, p < .001; Word Attack, r = .46, p < .05; and Word Identification, r = .60, p < .001).
Predictability of Early Language (2 and 3 Years) Measures to 5- and 7-Year Outcome Measures A series of hierarchical regression analyses were computed using early variables that were significantly correlated with later outcome variables. This was done to determine whether measures of language at 2 or 3 years were stronger predictors of later language and early reading outcomes. FH was entered into two of the nine regression models (7-year Token and 7-year Word Attack) because correlations showed that FH was related to these variables. In each model, 2-year receptive language (2-year LANG-R) and 3-year receptive language (3-year LANG-R) ability were entered as predictors of 5and 7-year receptive and expressive language skills and the Token Test, as well as 7-year reading ability (Passage Comprehension, Word Attack, Word Identification). In all models, receptive, rather than expressive, language was used as a predictor because the two measures were significantly correlated at both ages (2 years, r = .68; 3 years, r = .81). Moreover, research has shown that receptive language is a more robust and reliable predictor of later language and reading outcomes as compared with expressive abilities (Catts, Adlorf, & Weismer, 2006). Although the Token Test is primarily a test of receptive language, it also taps into other skills necessary for language and learning success, such as short-term memory, basic concept vocabulary, and multitask performance.
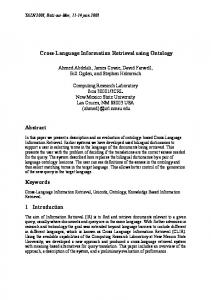
Predicting 5-Year Language Abilities Regression analyses predicting 5-year receptive language skills revealed that when 2- and 3-year receptive
Figure 1 Hierarchical Regression Analysis for Language Measures at 2 and 3 Years Predicting to 5-Year Language Outcome Measures
5-year LANG-R
ns 24%
5-year LANG-E
2-year LANG-R
41% 3-year LANG-R
53% 5-year TOKEN
ns
Note: LANG-E = expressive language ability; LANG-R = receptive language ability; TOKEN = Token Test.
language abilities were entered into the model, only 3year receptive language significantly predicted language at 5 years, accounting for 24% of the variance (R2adj = 0.24, p < .001). A similar pattern emerged for the Token Test where 3-year receptive language predicted 53% of the variance. Regression analyses predicting 5-year expressive language skills revealed that when 2-year receptive language ability was entered into the model alone, it predicted 18% of the variance at 5 years (ß = 0.27, R2adj = 0.18, p = .001). However, when 3-year receptive language ability was added to the model, the association between 2- and 5-year language ability was fully mediated by 3-year receptive abilities—that is, 3-year receptive language significantly predicted 41% of the variance in performance on 5-year measures (see Table 5 and Figure 1).
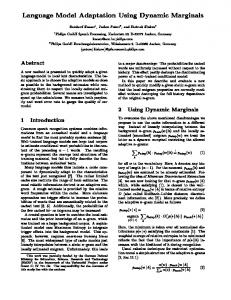
Predicting 7-Year Language and Reading Abilities Our results revealed a similar pattern of predictions for 7year language (Table 6 and Figure 2) and reading abilities (Table 7 and Figure 3). In all models, only 3-year receptive language ability entered significantly, accounting for 11% of the variance for receptive language, 12% of the variance for expressive language, 28% of the variance in performance on the Token Test, 25% of the variance in Passage
Flax et al. / Early Standardized Language Measures 9
Figure 2 Hierarchical Regression Analysis for Language Measures at 2 and 3 Years Predicting to 7-Year Language Outcome Measures
Figure 3 Hierarchical Regression Analysis for Language Measures at 2 and 3 Years Predicting to 7-Year Reading Outcome Measures ns
ns 7-year LANG-E
2-year LANG-R
7-year PC
2-year LANG-R
12%
25% 3-year LANG-R
3-year LANG-R
21% 25%
11%
ns
7-year LANG-R
7-year WA
ns 28%
ns 7-year
7-year WID
TOKEN
ns
Note: LANG-E = expressive language ability; LANG-R = receptive language ability; TOKEN = Token Test.
Table 5 Hierarchical Regression Analysis for Language Measures at 2 and 3 Years Predicting to 5-Year Language Outcome Measures SE Outcome Predictor 5-year receptive language Step 1: 2-year LANG-R Step 2: 3-year LANG-R 5-year expressive language Step 1: 2-year LANG-R Step 2: 3-year LANG-R 5-year Token Test Step 1: 2-year LANG-R Step 2: 3-year LANG-R
B
B
ß
Model ΔR2adj .24**
.10 .40
.12 .12
.12 .43** .41**
.22 .39
.09 .09
.27* .49** .53**
.04 .54
.08 .08
.06 .70**
Note: LANG-R = receptive language ability. *p ≤ .05. **p ≤ .001.
Comprehension, 21% of the variance in Word Attack, and 25% of the variance in Word Identification. FH did not remain as a significant predictor when other early language variables were entered and, as such, did not account for any of the variance above and beyond those measures.
Clinical Categorization Given that the children in the FH+ group could potentially present with different types and varying degrees of
Note: LANG-E = expressive language ability; LANG-R = receptive language ability; PC = Woodcock Reading Mastery–Passage Comprehension; WA = Woodcock Reading Mastery–Word Attack; WID = Woodcock Reading Mastery–Word Identification.
Table 6 Hierarchical Regression Analysis for Language Measures at 2 and 3 Years Predicting to 7-Year Language Outcome Measures SE Outcome Predictor 7-year expressive language Step 1: 2-year LANG-R Step 2: 3-year LANG-R 7-year receptive language Step 1: 2-year LANG-R Step 2: 3-year LANG-R 7-year Token Test Step 1: 2-year LANG-R Step 2: 3-year LANG-R
B
B
ß
.04 .23
.12 .12
.07 .30*
.04 .21
.10 .10
.05 .31*
.05 .37
.10 .11
.07 .49**
Model R2adj .12*
.11*
.28**
Note: LANG-R = receptive language ability. *p ≤ .05. **p ≤ .001.
language-related strengths and weaknesses depending on age and level of language development, we also examined the incidence of “low language” scores in languagerelated domains at each age that we tested. We defined low language as a standard score of