MARINE ECOLOGY PROGRESS SERIES Mar Ecol Prog Ser
Vol. 501: 265–278, 2014 doi: 10.3354/meps10665
Published March 31
Using empirical and mechanistic models to assess global warming threats to leatherback sea turtles Peter N. Dudley*, Warren P. Porter Department of Zoology, University of Wisconsin, 250 North Mills Street, Madison 53706, USA
ABSTRACT: Global warming may pose a greater risk to species with unique thermal requirements during each life stage than species with a similar thermal requirement throughout all life stages. The risk to the former is higher because their unique thermal ranges may become geographically or temporally discontiguous. Additionally, modeling global warming’s effects on these species is challenging due to their multiple thermal requirements. We explore these issues using leatherback sea turtles Dermochelys coriacea as a study species. The gigantothermy of adult leatherbacks and their subterranean egg incubation means global warming will differentially affect adults and eggs. To assess the unique thermal requirements in each life stage we used 2 distinct modeling approaches: (1) a mechanistic biophysical/physiological model to assess threats to adult leatherbacks, and (2) Bayesian regression with a mechanistic microclimate model to assess threats to leatherback eggs. We combined these models with a comprehensive literature search and a global climate model to establish the future thermal threats to the egg and adult leatherback life stages at 3 major rookeries (Gabon, French Guiana, and West Papua). We found that adult internesting and nesting core temperatures will not rise above the critical thermal maximum; however, at 2 of the 3 sites, adult core body temperatures will rise above the point where hatchlings experience uncoordinated movement. We also found that increased temperatures will greatly reduce success rates of egg clutches in West Papua and Gabon by the end of the 21st century. KEY WORDS: Bayesian · Global warming · Hatchling success · Leatherback · Marine turtles · Modeling · Physiology · Thermal tolerance Resale or republication not permitted without written consent of the publisher
Global warming poses a special risk to organisms with unique thermal requirements in each life stage because these required thermal conditions may become geographically or temporally disconnected. Modeling each life stage of a species under projected future climates may reveal during which part of their life cycle that species is most at risk. Depending on data accessibility and understanding of ecological processes and physiological mechanisms, different model classes may be more appropriate for assessing climatic threat to a species in different life stages. This study demonstrates the use of a mechanistic
microclimate model combined with a biophysical/ physiological model or an empirical model to assess global warming threats to adult leatherback sea turtles and their eggs, respectively. Leatherback sea turtles Dermochelys coriacea (Vandelli 1761) are the last remaining member of the 90 million year old family Dermochelyidae (Weems 1988). Tragically, they are critically endangered (Martinez 2011). Fishing bycatch (Spotila et al. 1996, Eckert 1997, Lewison et al. 2004), egg poaching (Kaplan 2005, Tapilatu & Tiwari 2007, Tomillo et al. 2008), beach development (Chan et al. 2007, Hernandez et al. 2007, Mazaris et al. 2009, Witherington et al. 2011), and pollution (Barreiros & Barcelos 2001,
*Corresponding author:
[email protected]
© Inter-Research 2014 · www.int-res.com
INTRODUCTION
266
Mar Ecol Prog Ser 501: 265–278, 2014
Bugoni et al. 2001, Mrosovsky et al. 2009) caused the 1980 global nesting population of 115000 to decline to between 26200 and 42900 by 1996 (Spotila et al. 1996). Continued global warming will likely put additional pressure on future leatherback populations. Adult leatherbacks are especially vulnerable to global warming because they are gigantotherms. Gigantotherms are poikilotherms whose activity and large body size elevates their body temperature considerably above ambient (by as much as 18°C for leatherbacks; Paladino et al. 1990, Bostrom & Jones 2007). This gigantothermy allows leatherbacks to forage in cold northern waters (e.g. offshore of Nova Scotia, Canada), but also means that they can only persist in waters which can adequately cool them. Global warming could also threaten leatherback hatchlings as their success (percent that hatch and escape the nest) may also be temperature-dependent (Spotila 2004). Some studies found no relation between temperature and leatherback hatchling success (Wallace et al. 2004), but, like those of other reptiles, a leatherback embryo’s growth and water uptake may be negatively correlated with temperature (Packard et al. 1987, Spotila & Zimmerman 1994, Lin et al. 2005). Thus, a large increase in global temperatures may make tropical waters inhospitably warm for adults and reduce hatchling success. While 2 studies have used empirical models to predict leatherback populations and nesting sites under global warming conditions (Saba et al. 2012, Pike 2013), ours is the first study to use a mechanistic model to predict actual leatherback core temperatures under global warming conditions. To predict these temperatures we combined morphological and behavioral data from the literature, a global climate model (GCM), and a novel transient and steady state biophysical/physiological model using an ‘effective insulating layer thickness’ (EILT) to calculate adult core body temperatures during nesting (while on land for oviposition) and internesting (time in water between nestings). The literature and GCM data were also the inputs for a meta-analysis using Bayesian regression to determine if hatchling success negatively correlates with temperature. We then estimated the most credible future hatchling success rates. With these methods, this study attempted to answer the following questions: (1) How will temperature increases change adult core temperatures during nesting and internesting at prominent leatherback nesting sites? (2) Will core temperature changes cause leatherback ranges to diverge from the equator? (3) How will temperature increases affect hatchling success rates?
Our study only examined the effect of global warming on leatherback adult core temperatures and hatchling success. For an overview of the many threats from global warming (increased air and ocean temperature, sea level rise, skewed sex ratios, reduced hatchling success, ocean acidification and changing large-scale ocean-atmosphere patterns) to all sea turtle species, see the several comprehensive reviews (Hawkes et al. 2009, Poloczanska et al. 2009, Hamann et al. 2013). In addition there are many articles covering proposed or implemented sea turtle management strategies under global warming: a general review (Fuentes et al. 2012), threat assessments (Garcon & Grech 2010, Donlan et al. 2010, Fuentes & Cinner 2010, Fuentes et al. 2011), regional management units (Fuentes et al. 2013), climatesmart practices (Hansen et al. 2010), and marine protected areas (Hooker et al. 2011).
MATERIALS AND METHODS Literature search: adult thermal effects To aggregate current leatherback thermal and range data, we searched Web of Science using a combination of synonyms for leatherback, distribution, and thermal tolerance. Of the initial 131 results, we eliminated 97 articles based on title or abstract. Usable thermal range data was in 14 of the remaining articles. These 14 papers used 1 of 3 methods to measure ambient water temperatures around leatherbacks. Three studies matched fisherman and public leatherback sightings in their northern foraging waters (henceforth ‘foraging leatherbacks’) with water temperature at the sighting location (McMahon & Hays 2006, James et al. 2006b, 2007). Two articles had trackers measuring water temperature on foraging leatherbacks and 1 had water temperatures from bycatch incidents (Goff & Lien 1988, James & Mrosovsky 2004, James et al. 2006a). Nine articles had trackers on internesting leatherbacks (Southwood et al. 1999, 2005, James et al. 2006a, SherrillMix et al. 2007, Shillinger et al. 2008, Fossette et al. 2009, López-Mendilaharsu et al. 2009, Casey et al. 2010, Witt et al. 2011). We calculated a weighted average and weighted standard deviation for these 3 sets of temperature data. In addition to measuring ambient temperatures, 3 studies measured internal body temperatures with deep cloaca probes or ingested data loggers. The cloaca probe study was in foraging waters (James & Mrosovsky 2004) and the 2 data logger studies were during internesting (South-
Dudley & Porter: Global warming models and leatherbacks
267
wood et al. 2005, Casey et al. 2010). We calculated a weighted average body temperature from the 2 internesting studies. Wallace & Jones (2008) aggregated metabolic data from marine turtles. We pulled from these studies average leatherback metabolic rates for internesting (Wallace et al. 2005), crawling (Paladino et al. 1990, 1996), oviposition (Lutcavage et al. 1992, Paladino et al. 1996), and nest covering (Paladino et al. 1990).
Biophysical/physiological model The biophysical/physiological model had 2 stages: a steady state stage when the leatherback is in water and a transient stage when the leatherback is nesting (outlined in Fig. 1). Both stages used an ellipsoid (the three-dimensional (3D) analogue of an ellipse) shape
Fig. 1. Dermochelys coriacea. A schematic diagram of the physiological model. A steady state model uses core temperatures, water temperatures, field metabolic rates (FMR), an ellipsoidal geometry, and conduction and convection constants to establish a minimum effective insulating layer thickness. The insulating layer thickness, the abiotic conditions, the same ellipsoidal geometry, the metabolic rates for different nesting phases (i.e. crawling, covering, laying, etc.) and the conduction and convection coefficients are the inputs for a transient, nesting leatherback model. We use both of these models to predict current and future core body temperatures during both terrestrial and marine parts of the nesting season
Fig. 2. Dermochelys coriacea. We approximated the leatherback’s body geometry as an ellipsoid. We based the ellipsoid axes ratios on ratios taken from 9 leatherback photos (2 examples shown). The leatherback’s weight sets the absolute size of the axes. Photo credits: top, Shuva Rahim (date unknown); bottom, National Park Service (2013)
to approximate the leatherback. The ratios of the ellipsoid semi-principal axes corresponded to the ratio of leatherback body dimensions measured from images. We used 9 leatherback images where the perspective allowed us to measure a ratio without distortions (Fig. 2; source information for the images is given in the Appendix). As leatherbacks are close to neutrally buoyant, we set the turtle tissue to the
268
Mar Ecol Prog Ser 501: 265–278, 2014
same density as seawater, and set the ellipsoid volume so its mass matched the leatherback’s mass. We used 2 turtle sizes (curved carapace length (CCL) 125 and 172 cm, mass 197 and 593 kg) based on the size range James et al. (2007) documented. We divided the ellipsoid into 2 regions: the first was a core region with uniform temperature, and the second was an insulating layer. The first stage (steady state internesting model) used the current average temperature difference (calculated above) between internesting water and the leatherback core to calculate an ‘effective insulating layer thickness’ (EILT); a fat layer thickness that would result in the ellipsoid leatherback having the same temperature difference as real leatherbacks. Thus, this EILT uses a single number to represent a leatherback’s total insulating capabilities, including flippers, soft head and neck skin, and fat insulation around the body cavity. The EILT is not meant to accurately predict the fat layer thickness in a leatherback, but rather to represent a leatherback’s insulating capabilities. We set the size, ambient temperature and core temperature in our steady state model to the averages from the 2 studies reporting core and ambient temperatures. We then solved for an EILT. We scaled this thickness to the 2 leatherback sizes in our model. McMahon & Hays (2006) showed leatherbacks behaviorally cool themselves during their internesting period. Thus, we assumed that this effective insulating layer thickness represented the minimum achievable physiological insulation of a leatherback. In the second stage (transient nesting model), we used the same core volume and effective insulating layer as the steady state internesting model (Fig. 3). The transient nesting model divided the turtle’s surface into 2 regions. One region was in contact with the ground and transferred heat by conduction. This region was either 40 or 50% of the leatherback’s surface area and matched the portion of the leatherback’s surface in contact with the ground during different nesting phases (i.e. crawling versus laying). The other region transferred heat by both convection and thermal infrared long wavelength radiation. As most leatherbacks nest at night, we did not include solar heating. The model did include metabolic heat and respiratory evaporative heat loss. We calculated respiratory heat loss using the turtle’s tidal volume and respiration rate from the literature. We assumed the lungs’ interior surfaces were free water surfaces. The heterogeneous core body volume had the thermal characteristics of animal tissue. We assigned the insulating layer the thermal properties of blubber.
Fig. 3. Dermochelys coriacea. (A) A representation of the 4 thermal regions (core, insulating layer, air and ground) that comprise the transient thermal model. (B) An equivalent circuit diagram for the nesting leatherback transient model. The symbols are as follows: Qm: metabolic heat (W), Qr: respiratory heat loss (W), Ti: core body temperature (°C), Cc: core body heat capacitance (J K−1), Rs: shell thermal resistance (K W−1), Rp: plastron thermal resistance (K W−1), Ts: inner shell temperature (°C), Tp: inner plastron temperature (°C), Cs: shell heat capacitance (J K−1), Cp: plastron heat capacitance (J K−1), To: outer skin temperature (°C), Tg: ground temperature (°C), Rr: radiative resistance (K W−1), Rf: convective resistance (K W−1), Tr: sky radiative temperature (°C), and Ta: air temperature (°C). Since most leatherbacks nest at night, the model did not include solar radiation. The initial temperatures were the steady state temperatures from a swimming turtle
We used the Nusselt-Reynolds relation coefficients of a sphere to set the convection coefficient. The characteristic length of the ellipsoid was the cube root of the volume (Mitchell 1976). We calculated the sky temperature from the Swinbank relation (Swinbank 1963). Table 1 presents these and other model parameters. To compare current and future leatherbacks we selected 3 locations with sizable leatherback nesting populations (Gabon, French Guiana, and West Papua). These 3 locations represent the 3 largest nesting populations in the East Atlantic, West Atlantic, and East Pacific, respectively. We used GCM data from the Geophysical Fluid Dynamics Laboratory–Earth Systems Model with generalized ocean layer dynamics (GFDL-ESM2G) (Dunne et al.
Dudley & Porter: Global warming models and leatherbacks
Table 1. Dermochelys coriacea. The data used to calculate the steady state (internesting) and/or transient (nesting) model, in addition to present and future climatic data for the 3 locations (not shown here). Values with multiple citations indicate an average from several sources weighted by number of measurements. EILT: effective insulating layer thickness Parameter Mass Tissue density Length to width to height ratio
Value
Unit
Source
197.4−593.2 1025
kg kg m−3
James et al. (2007) Same as sea water
1.000:0.830:0.425
Various images (see Appendix)
Specific heat Tissue Fat
3750 1880
J kg−1 K−1 J kg−1 K−1
Time Crawling up Digging Laying Covering Crawling Total
180 1320 900 2700 480 5580
s s s s s s
Metabolism Crawling Digging or covering
1.045 1.381
W kg−1 W kg−1
Paladino et al. (1990, 1996) Paladino et al. (1990)
0.148
W kg−1
Lutcavage et al. (1990) Paladino et al. (1996) Wallace et al. (2005)
Laying
Bostrom & Jones (2007) Minard (1970) Carr & Ogren (1959) Carr & Ogren (1959) Carr & Ogren (1959) Carr & Ogren (1959) Carr & Ogren (1959) Carr & Ogren (1959)
269
As leatherbacks come ashore, their movement digs down through several centimeters of sand. Thus, to find the sand temperature the leatherback plastron is in contact with, we used the Niche MapperTM microclimate model (Porter et al. 1973, Porter & Mitchell 2006) to calculate the sand temperature 15 cm below the surface. Table 2 presents the inputs for this Niche MapperTM simulation. The calculated results from Niche MapperTM were in good agreement (average difference 2.2%) with 2 studies which measured beach temperatures at leatherback nesting sites (Hilterman et al. 2003, Santidrián Tomillo et al. 2009).
Literature search: incubation thermal effects
This Web of Science search combined terms for leatherbacks, eggs or Ventilation frequency hatchlings, and hatchling success. Active 0.083 s−1 Paladino et al. (1996) Removing studies based on title and −1 Laying 0.065 s Paladino et al. (1996) abstract reduced the initial 80 articles Tidal volume to 32. Selecting only papers with in3 Active 0.00412−0.01240 m Paladino et al. (1996) ground or in-nest temperatures and Laying 0.00150−0.00450 m3 Paladino et al. (1996) which measured hatchling success EILT 0.0087−0.0127 m First stage of model −1 −1 reduced the number to 4 papers with Fat conductance 0.25 WK m Bostrom et al. (2010) −1 a total of 530 nests (Tapilatu & Tiwari Eckert (2002) Swim speed 0.7 ms 2007, Houghton et al. 2007, Santidrián Tomillo et al. 2009, Patino2012). We compared 2 emission scenarios. The first Martinez et al. 2012). Two of these studies used inwas Representative Concentration Pathway 8.5 nest temperature measurements and 2 used probes (RCP8.5) (Riahi et al. 2007) and the second was at nest depths. Using the known metabolic heat RCP2.6 (Vuuren et al. 2007). RCP8.5 is the ‘business Table 2. The inputs for the Niche MapperTM microclimate as usual’ pathway while RCP2.6 is a mitigation scemodel nario aimed at limiting the global increase in temperature to 2°C. The scenarios result in a radiative forParameter Value Unit cing increase of 8.5 W m−2 and 2.6 W m−2 by 2100 (the standard end year for climate projections). In each of Surface roughness 0.0001 m the 3 locations, we extracted monthly minimum, Soil thermal conductivity 3.0 W m−1 °C−1 maximum, and mean air temperatures; water temSoil reflectivity 0.3 Fraction Soil density 1922 kg m−3 peratures; relative humidities; and average wind Soil specific heat 1830 J kg−1 K−1 speeds for the 2100 nesting period (Gabon — NovemSoil IR emissivity 0.76 Fraction ber to February, French Guiana — March to August, Cloud cover 0.0 Fraction West Papua — May to September). Local weather staFraction shade 0-1 Fraction Relative humidity 0.8 Fraction tions provided current temperature data; all other Wind speed 1.0 m s−1 current climate data were the GCM simulation conTemperature Varies °C ditions in the year 2010. Swimming
0.395
W kg−1
Mar Ecol Prog Ser 501: 265–278, 2014
270
which a set quantity of successful eggs produces we scaled the in-clutch temperatures to remove the metabolic-sourced temperature increase (PatinoMartinez et al. 2012).
Bayesian regression In order to calculate the 2100 credible hatchling success rate distributions, i.e. those future values of success that are the most likely and therefore lay inside the 95% HDI (highest density interval), we conducted a Bayesian regression on the hatchling success data. We weighted each data point by the number of nests it represented. The model (i.e. the likelihood function) was a logistic function (Eq. 1) about which the data was normally distributed (Eq. 2) (Fig. 4). This model had 4 parameters: the 3 coefficients that describe the shape of the logistic function and the normal distribution precision (t) (inverse of variance); and 1 variable (ground temperature):
(
y i (Ti ) = β0 1 –
z i (y ) =
1 1+ e
t e 2π
−β1(Ti −β2 )
–t (y – y i )2 2
)
(1)
Fig. 4. Dermochelys coriacea. A representation of the likelihood function used in the hatchling success versus temperature Bayesian regression. The function is a logistic curve about which the data is normally distributed. The axes values are for demonstration and not actual data
RESULTS Adult thermal effects
(2)
where zi is the probability of a data point occurring at y, yi is the average of the success at a given temperature (Ti), Ti is a set sand temperature at nest depth, t is the precision of the normal distribution, β0 is a scaling coefficient of the logistic equation, β1 is a shape coefficient of the logistic equation, and β2 is a displacement coefficient of the logistic equation. All priors were noncommittal. The prior on b0 was a uniform distribution from 0.001 to 1.0. The prior on b1 was a uniform distribution from 1 × 10⁻⁶ to 1 × 10⁶. The prior on b2 was a uniform distribution from 0 to 100. The precision prior was a gamma distribution with shape and scale parameter set to 0.001. There were 3 MCMC (Markov chain Monte Carlo) runs with 500 burn-in steps and 500 adaption steps. We saved a total of 100000 non-thinned points from the chain. In order to calculate future temperatures the nests will experience we again used the microclimate model in Niche MapperTM. We calculated the average belowground temperature at a depth of 0.5 m, i.e. similar to the depth of a typical leatherback nest (Chan & Liew 1995, Godfrey & Barreto 1996) for both shaded and exposed nests during the nesting season plus 60 d (the incubation time).
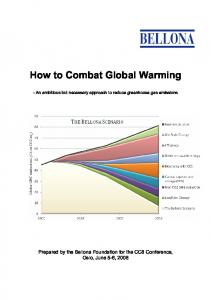
The average water temperature was 26.4 ± 1.6°C for internesting adults and 13 ± 4°C for foraging adults: the average foraging sighting temperature was 16 ± 2°C (Fig. 5). We expected the sighting temperature to be warmer than the tracking temperature for any region because the tracking temperatures include colder waters that the leatherback encounters during dives. Combining this data with RCP8.5 GCM data we find that by 2100, the North Atlantic 16°C isotherm (the location with the most foraging leatherback sightings) will likely move approx. 3.5° north along the western Atlantic coast and 4.5° along the eastern Atlantic coast (Fig. 6). The 2 studies that measured internesting external and internal body temperatures showed that leatherbacks maintain their body temperature 2.2 ± 1.1°C above ambient. Inputting the internesting temperature difference into our biophysical/physiological model, we found that under RCP8.5 West Papua leatherbacks experienced the largest increase in internesting core temperatures (3.4°C). Gabon experienced the smallest increase between current and future internesting core temperatures with an increase of 1.8°C. Under RCP2.6 there was a small decrease in core temperature between Gabon and West Papua leatherbacks and a slight increase in core temperature in French Guiana leatherbacks (Table 3).
Dudley & Porter: Global warming models and leatherbacks
Fig. 5. Dermochelys coriacea. The ambient water temperature leatherbacks experience in their foraging (3 articles for tracking and 3 for sighting) and nesting waters (9 articles). The light gray bars are from attached data loggers or direct water measurement during a leatherback encounter. The dark gray foraging bar represents average water temperature from public and fishermen sightings. We combined data for foraging with trackers (Goff & Lien 1988, James & Mrosovsky 2004, James et al. 2006a), foraging sightings (McMahon & Hays 2006, James et al. 2006b, 2007), and internesting (Southwood et al. 1999, 2005, James et al. 2006a, Sherrill-Mix et al. 2007, Shillinger et al. 2008, Fossette et al. 2009, López-Mendilaharsu et al. 2009, Casey et al. 2010, Witt et al. 2011) into averages weighted by number of turtles counted or tagged
The typical results from the transient model showed the core body temperature increased during all stages except oviposition (e.g. Fig 7). During oviposition, a leatherback reduces its metabolic rate by an order of magnitude when compared to crawling and covering/digging (Lutcavage et al. 1990, Paladino et al. 1990, 1996). At the point of oviposition we calculated that the turtle had heated to between 1.4 to 3.1°C above water temperature, which is in agreement with measurements made by Mrosovsky & Pritchard (1971) (2.3 to 3.0°C; no CCLs given). The model using RCP8.5 predicted that by 2100 all leatherbacks will experience most of their increase in core body temperature while in the water. Almost all of the French Guiana leatherbacks’ core temperature increase was predicted to happen during the internesting period. West Papua leatherbacks were predicted to experience a substantial temperature increase during nesting — but still less than during internesting (Fig. 8). Under RCP8.5 the model predicted that larger leatherback in West Papua will have the highest core temperature (37.2°C) while the smaller leatherback at the same location will have the greatest increase in core temperature (4.6°C) over the present day (Table 4).
271
Fig. 6. Dermochelys coriacea. The North Atlantic, showing the 16°C isotherm (boundary between black and white) for the most active foraging month (a value of 16°C is the most common water temperature for leatherback sightings in this area). The boundary is predicted to move approximately 3.5° north along the western Atlantic coast and 4.5° north along the eastern Atlantic coast
Table 3. Dermochelys coriacea. The current and future internesting core body temperature for 2 sizes of leatherback sea turtles (based on curved carapace length, CCL) at 3 locations under 2 different emissions scenarios. RCP8.5 is the ‘business as usual’ pathway while RCP2.6 is a mitigation scenario aimed at limiting the global increase in temperature to 2°C Location
CCL (cm)
Gabon
172 125 172 125 172 125
West Papua French Guiana
Core temperature (°C) Present 2100 2100 RCP2.6 RCP8.5 32.3 30.9 32.6 31.2 29.0 27.7
31.9 30.6 32.4 31.1 29.9 28.6
34.1 32.7 36.0 34.6 32.0 30.7
In the model, none of the future internesting or nesting body temperatures were above the presumed leatherback critical thermal maximum (CTM) (40°C) (Spotila et al. 1997). This result, however, is not a guarantee of persistence in these regions (see Discussion).
272
Mar Ecol Prog Ser 501: 265–278, 2014
Incubation thermal effects The Bayesian regression achieved a good fit with a narrow 95% HDI (Fig. 9). The future posterior distributions (Figs. 10 & 11) for projected belowground temperatures showed some consistent trends. Shaded nests always had higher credible
Table 4. Dermochelys coriacea. The maximum present nesting core body temperatures and 2100 nesting core body temperatures of 2 sizes (curved carapace length, CCL) of leatherback sea turtles at 3 locations under 2 different emissions scenarios Location
CCL (cm)
Gabon
172 125 172 125 172 125
West Papua French Guiana
Max. core temperature (°C) Present 2100 2100 RCP2.6 RCP8.5 33.2 31.8 33.1 31.3 30.4 29.3
33.1 31.9 33.4 31.9 31.2 30.1
35.4 34.2 37.2 35.9 33.5 32.4
Fig. 7. Dermochelys coriacea. An example of a core temperature profile for a 172 cm curved carapace length (CCL) Gabon leatherback under emission scenario RCP8.5. The vertical lines separate different phases of the nesting process. These functions are exponential despite appearing linear. They appear linear owing to the large thermal inertia of the leatherback and the short time spent on land
Fig. 9. Dermochelys coriacea. A graph of the raw data from 4 studies (Tapilatu & Tiwari 2007, Houghton et al. 2007, Santidrián Tomillo et al. 2009, Patino-Martinez et al. 2012) with 95% HDIs (highest density interval) overlaid at several temperature values. The hash marks in the middle of the HDI vertical bars are the most credible success value for the given temperature. For each given temperature, 95% of the credibility lies within the vertical line. Data is weighted by number of nests, thus certain data points have more weight in the regression than others
Fig. 8. Dermochelys coriacea. The increase in leatherback body temperature during the nesting process between the present and the year 2100 under emission scenario RCP8.5. The vertical lines separate different phases of the nesting process
seasonal average success values than exposed nests. There was generally a small difference between present and RCP2.6 credible seasonal average success values. The exception to this finding was the exposed Gabon nests. For exposed nests under RCP8.5 in all 3 locations, zero was a credible seasonal average success value. In general, nests in Gabon and West Papua were more at risk of having low credible seasonal average success values.
Dudley & Porter: Global warming models and leatherbacks
273
Fig. 10. Dermochelys coriacea. The posterior distributions for the average temperature (in parentheses under the x-axes) that shaded clutches will experience at present and in year 2100 under 2 different emission scenarios. The most credible values are the means of the distributions and the region above the black horizontal bar denoting the 95% HDI (highest density interval) contains 95% of the credible values
DISCUSSION Adult thermal effects The adult leatherback biophysical/physiological models suggest it is possible but unlikely that thermal distress will make the equatorial region inaccessible. The maximum steady state core temperature the model predicted was 36.0°C in West Papua (below the presumed CTM of 40°C). This adult CTM value is, however, only an estimate and researchers have not explicitly measured it. Additionally, while optimum temperature does correlate with CTM, exceeding other lower temperature limits, such as pejus range (turning worse, progressively deleterious) or the critical thermal minimum, does have a negative effect on fitness (Huey et al. 2012). Therefore, results near the assumed CTM should raise con-
cern. West Papua and Gabon under scenario RCP8.5 were also of concern because temperatures were above the 33.6°C threshold where hatchlings begin to experience uncoordinated movement (Drake & Spotila 2002). If adults do not have a higher thermal tolerance than hatchlings, they will likely not nest in these regions. Overheating during nesting is a greater concern than overheating while internesting. The increased metabolic heat as well as the reduced convective cooling puts leatherbacks at additional thermal risk. Our model under scenario RCP8.5 showed that large leatherbacks in West Papua were within 2.8°C of their presumed CTM and those in Gabon were within 4.6°C. Under scenario RCP8.5, all leatherbacks in Gabon and West Papua were above 33.6°C and leatherbacks in French Guiana were only slightly below 33.6°C.
274
Mar Ecol Prog Ser 501: 265–278, 2014
Fig. 11. Dermochelys coriacea. The posterior distributions for the average temperature (in parentheses under the x-axes) that exposed (i.e. not shaded) clutches will experience at present and in year 2100 under 2 different emission scenarios. The most credible values are the means of the distributions and the region above the black horizontal bar denoting the 95% HDI (highest density interval) contains 95% of the credible values
While these results are concerning, they indicate that leatherbacks could possibly tolerate the projected warming even under ‘business as usual’ scenarios. An important caveat is that the longer a leatherback remains on land the more its temperature rises. Thus, in cases where nesting takes longer than our modeled 90 min, the leatherback will face an increased threat from rising global temperatures. Adult leatherback thermal distress experiments are excessively difficult as well as unethical. Thus, the most appropriate tool for determining if leatherbacks will be in thermal distress may be advanced thermal models. Like Bostrom & Jones (2007) and Paladino et al. (1990), this study used simple models to examine the relationship between metabolic rate and temperature difference. Leatherbacks, however,
have a much more complex shape than a cylinder or ellipsoid (i.e. lower volume to area ratio) and so have many more opportunities to dissipate heat. In addition, their ability to shed heat both through their soft skin and flippers (Greer et al. 1973, Spotila 2004) means they can likely maintain a lower thermal gradient than a basic model can calculate. This study used the calculated effective insulating layer thickness to account for this complexity. Future models should attempt to incorporate the leatherback’s complex morphology and physiology. In addition to advanced modeling, we suggest an increased focus on research of adult thermal tolerances through advanced trackers (measuring both acceleration and sub-carapace temperature) and increased efforts to sustain leatherbacks in captivity.
Dudley & Porter: Global warming models and leatherbacks
Incubation thermal effects Our analysis showed that while a scenario like RCP2.6 is of minimal concern, emissions scenario RCP8.5 is a threat in all 3 regions but particularly West Papua. Our results for shaded nests showed there are possible refuges from this increased heat. While the shaded credible seasonal average success values decrease from present values, a zero success value was not credible. However, while vegetation may provide shade refuges, it also may pose risks. For example, if the hatchlings emerge in dense vegetation they are unable to visually orient themselves toward the ocean (Kamel & Mrosovsky 2004). The excavation and frenzy period is another point where elevated temperature may have deleterious effects. Increased nest temperatures can elevate hatchling temperatures and change sand properties, possibly forming a surface thermal barrier (J. Wyneken pers. comm.). With a CTM of 40.2°C and uncoordinated movement beginning at 33.6°C it is unsafe for hatchlings to emerge from the nest if the sand surface temperature is over 36°C (Drake & Spotila 2002). Under RCP8.5, exposed nests in West Papua on average will already be above the temperature that causes uncoordinated movement. In addition to reduced hatchling success rates, skewed sex ratios are also a threat to leatherbacks as they are a temperature-dependant sex determination species. There are 5 studies in the literature that measured and report leatherback sex ratios under different temperatures. One study uses natural nests and records sand temperatures but does not report success (Godfrey & Barreto 1996). Thus, we cannot scale this data to correct for metabolic heating. Another study examined Malaysian clutches in incubators (Chan & Liew 1995). Each of these clutches produced only one sex, with 27.3°C being the hottest all male clutch and 28.4°C being the coolest all female clutch (which had a very small sample size of n = 5). Chevalier et al. (1999) conducted a maximum likelihood analysis with the data from the other 3 studies. For a Pacific population nesting in Costa Rica, 28.8°C and 30.0°C are the temperature cutoffs for 5 percent and 95 percent female hatchlings, respectively. For an Atlantic population nesting in French Guiana, 29.2°C and 29.8°C are the temperature cutoffs for 5 percent and 95 percent female hatchlings, respectively. For our simulations, all year 2100 scenario RCP8.5 exposed clutches were above 30.0°C, along with West Papua shaded clutches, and year 2100 scenario RCP2.6 Gabon exposed clutches. The only clutch in between the 2 different 95 percent
275
female cutoffs was year 2100 scenario RCP8.5 Gabon shaded. We reiterate that our temperatures were the ground temperature at the location of the clutch (i.e. no egg metabolic heating) and that the metabolic heat of the clutch raises the temperature approximately 0.7°C (Patino-Martinez et al. 2012). Despite the relative accessibility of nests compared to adults, questions remain about the aggregate effect of abiotic factors on the internal clutch temperature. Santidrián Tomillo et al. (2012) stastically examined the aggregate effect of precipitation and atmospheric temperature on hatchling success in northwest Costa Rica. Although not directly comparable to our results, their projections showed similar decreases in hatchling success under a global warming scenario analogue to RCP8.5. However, as most of these abiotic effects (e.g. evaporative cooling, conduction) are understood in isolation, numerical models may be able to sum the effects of a suite of abiotic factors and estimate the clutch temperatures under differing conditions.
CONCLUSIONS We demonstrated that the incubation phase in the leatherback life cycle is the most vulnerable to temperature increases. Since the internesting steady state core temperatures were below the CTM the adults will not definitively diverge from the equatorial region; however, temperatures high enough to possibly induce uncoordinated movement may force them to leave some regions. The transient model showed that nesting leatherback core temperatures will not rise above the CTM, but will come dangerously close. Managers and conservationists should investigate the possibilities of constructing shade devices out of local, biodegradable materials that will not disorient hatchlings and deploying them over nests on beaches. Patino-Martinez et al. (2012) have already used shading techniques to increase the percentage of males and overall hatchling success. Also, managers may consider beginning public awareness campaigns in regions traditionally cooler than current nesting locations as leatherback nesting may shift to those regions in the future.
Acknowledgements. We thank the 3 anonymous reviewers whose thoughtful critique of our manuscript greatly improved its quality. We also thank Samantha Greene for writing and stylistic editing of this manuscript. An NSF EAGER grant number 1116343 to W.P.P. provided one sum-
Mar Ecol Prog Ser 501: 265–278, 2014
276
mer of support to P.N.D. Any opinions, findings, and conclusions or recommendations expressed in this material are those of the author(s) and do not necessarily reflect the views of the National Science Foundation.
➤ LITERATURE CITED
➤ ➤ Barreiros JP, Barcelos J (2001) Plastic ingestion by a leather➤
➤
➤ ➤ ➤
➤
➤ ➤
➤
➤
➤
back turtle Dermochelys coriacea from the Azores (NE Atlantic). Mar Pollut Bull 42:1196−1197 Bostrom BL, Jones DR (2007) Exercise warms adult leatherback turtles. Comp Biochem Physiol A Mol Integr Physiol 147:323−331 Bostrom BL, Jones TT, Hastings M, Jones DR (2010) Behaviour and physiology: the thermal strategy of leatherback turtles. PLoS One 5:e13925 Bugoni L, Krause L, Petryà MV (2001) Marine debris and human impacts on sea turtles in Southern Brazil. Mar Pollut Bull 42:1330−1334 Carr A, Ogren L (1959) The ecology and migrations of sea turtles, 3. Dermochelys in Costa Rica. Am Mus Novit No 1958 Casey J, Garner J, Garner S, Williard AS (2010) Diel foraging behavior of gravid leatherback sea turtles in deep waters of the Caribbean Sea. J Exp Biol 213:3961−3971 Chan EH, Liew HC (1995) Incubation temperatures and sexratios in the Malaysian leatherback turtle Dermochelys coriacea. Biol Conserv 74:169−174 Chan SKF, Cheng IJ, Zhou T, Wang HJ (2007) A comprehensive overview of the population and conservation status of sea turtles in China. Chelonian Conserv Biol 6: 185−198 Chevalier J, Godfrey MH, Girondot M (1999) Significant difference of temperature-dependent sex determination between French Guiana (Atlantic) and Playa Grande (Costa-Rica, Pacific) leatherbacks (Dermochelys). Ann Sci Nat 20:147−152 Donlan CJ, Wingfield DK, Crowder LB, Wilcox C (2010) Using expert opinion surveys to rank threats to endangered species: a case study with sea turtles. Conserv Biol 24:1586−1595 Drake DL, Spotila JR (2002) Thermal tolerances and the timing of sea turtle hatchling emergence. J Therm Biol 27: 71−81 Dunne JP, John JG, Adcroft AJ, Griffies SM and others (2012) GFDL’s ESM2 Global Coupled Climate−Carbon Earth System Models. Part I: physical formulation and baseline simulation characteristics. J Clim 25:6646−6665 Eckert SA (1997) Distant fisheries implicated in the loss of the worlds largest leatherback nesting population. Mar Turtle Newsl 78:2−7 Eckert SA (2002) Swim speed and movement patterns of gravid leatherback sea turtles (Dermochelys coriacea) at St Croix, US Virgin Islands. J Exp Biol 205:3689−97 Fossette S, Girard C, Bastian T, Calmettes B and others (2009) Thermal and trophic habitats of the leatherback turtle during the nesting season in French Guiana. J Exp Mar Biol Ecol 378:8−14 Fuentes MMPB, Cinner JE (2010) Using expert opinion to prioritize impacts of climate change on sea turtles’ nesting grounds. J Environ Manage 91:2511−2518 Fuentes MMPB, Limpus CJ, Hamann M (2011) Vulnerability of sea turtle nesting grounds to climate change. Glob Change Biol 17:140−153
➤
➤
➤ ➤ ➤
➤
➤
➤
➤ ➤
➤ ➤
Fuentes M, Fish M, Maynard J (2012) Management strategies to mitigate the impacts of climate change on sea turtle’s terrestrial reproductive phase. Mitig Adapt Strateg Glob Change 17:51−63 Fuentes MMPB, Pike DA, Dimatteo A, Wallace BP (2013) Resilience of marine turtle regional management units to climate change. Glob Change Biol 19:1399−1406 Garcon J, Grech A (2010) Relative Exposure Index: an important factor in sea turtle nesting distribution. Aquat Conserv Mar Freshw Ecosyst 20:140−149 Godfrey MH, Barreto R (1996) Estimating past and present sex ratios of turtles in Suriname. Can J Zool 74:267−277 Goff GP, Lien J (1988) Atlantic leatherback turtles, Dermochelys coriacea, in cold water off Newfoundland and Labrador. Can Field Nat 102:1−5 Greer AE, Lazell JD, Wright RM (1973) Anatomical evidence for a counter-current heat exchanger in the leatherback turtle (Dermochelys coriacea). Nature 244:181 Hamann M, Fuentes MMPB, Ban NC, Mocellin VJL (2013) Climate change and marine turtles. In: Sea turtle biology, Vol III. CRC Press, Boca Raton, FL, p 353−378 Hansen L, Hoffman J, Drews C, Mielbrecht E (2010) Designing climate-smart conservation: guidance and case studies. Conserv Biol 24:63−69 Hawkes L, Broderick A, Godfrey M, Godley B (2009) Climate change and marine turtles. Endang Species Res 7: 137−154 Hernandez R, Buitrago J, Guada H, Hernandez-Hamon H, Llano M (2007) Nesting distribution and hatching success of the leatherback, Dermochelys coriacea, in relation to human pressures at Playa Parguito, Margarita Island, Venezuela. Chelonian Conserv Biol 6:79−86 Hilterman M, Goverse E, Godfrey M, Girondot M, Sakimin C (2003) Seasonal sand temperature profiles of four major leatherback nesting beaches in the Guyana Shield. In: Proc 22nd Ann Symp Sea Turtle Biol Conserv, Miami, FL, p 189−190 Hooker S, Cañadas A, Hyrenbach K, Corrigan C, Polovina J, Reeves R (2011) Making protected area networks effective for marine top predators. Endang Species Res 13: 203−218 Houghton JDR, Myers AE, Lloyd C, King RS, Isaacs C, Hays GC (2007) Protracted rainfall decreases temperature within leatherback turtle (Dermochelys coriacea) clutches in Grenada, West Indies: ecological implications for a species displaying temperature dependent sex determination. J Exp Mar Biol Ecol 345:71−77 Huey RB, Kearney MR, Krockenberger A, Holtum JA, Jess M, Williams SE (2012) Predicting organismal vulnerability to climate warming: roles of behaviour, physiology and adaptation. Philos Trans R Soc Lond B Biol Sci 367: 1665−1679 James MC, Mrosovsky N (2004) Body temperatures of leatherback turtles (Dermochelys coriacea) in temperate waters off Nova Scotia, Canada. Can J Zool 82:1302−1306 James MC, Davenport J, Hays GC (2006a) Expanded thermal niche for a diving vertebrate: a leatherback turtle diving into near-freezing water. J Exp Mar Biol Ecol 335: 221−226 James MC, Sherrill-Mix SA, Martin K, Myers RA (2006b) Canadian waters provide critical foraging habitat for leatherback sea turtles. Biol Conserv 133:347−357 James MC, Sherrill-Mix SA, Myers RA (2007) Population characteristics and seasonal migrations of leatherback sea turtles at high latitudes. Mar Ecol Prog Ser 337:245−254
Dudley & Porter: Global warming models and leatherbacks
➤ Kamel SJ, Mrosovsky N (2004) Nest site selection in leather➤ ➤
➤
➤
➤
➤ ➤
➤ ➤ ➤ ➤
➤
➤
➤
backs, Dermochelys coriacea: individual patterns and their consequences. Anim Behav 68:357−366 Kaplan IC (2005) A risk assessment for Pacific leatherback turtles (Dermochelys coriacea). Can J Fish Aquat Sci 62: 1710−1719 Lewison RL, Freeman SA, Crowder LB (2004) Quantifying the effects of fisheries on threatened species: the impact of pelagic longlines on loggerhead and leatherback sea turtles. Ecol Lett 7:221−231 Lin ZH, Ji X, Luo LG, Ma XM (2005) Incubation temperature affects hatching success, embryonic expenditure of energy and hatchling phenotypes of a prolonged eggretaining snake, Deinagkistrodon acutus (Viperidae). J Therm Biol 30:289−297 López-Mendilaharsu M, Rocha CFD, Miller P, Domingo A, Prosdocimi L (2009) Insights on leatherback turtle movements and high use areas in the Southwest Atlantic Ocean. J Exp Mar Biol Ecol 378:31−39 Lutcavage ME, Bushnell PG, Jones DR (1990) Oxygen transport in the leatherback sea turtle Dermochelys coriacea. Physiol Zool 63:1012−1024 Lutcavage ME, Bushnell PG, Jones DR (1992) Oxygen stores and aerobic metabolism in the leatherback sea turtle. Can J Zool 70:348−351 Martinez S (2011) Dermochelys coriacea. IUCN Red List Threat Species Mazaris AD, Matsinos G, Pantis JD (2009) Evaluating the impacts of coastal squeeze on sea turtle nesting. Ocean Coast Manage 52:139−145 McMahon CR, Hays GC (2006) Thermal niche, large-scale movements and implications of climate change for a critically endangered marine vertebrate. Glob Change Biol 12:1330−1338 Minard D (1970) Body heat content. In: Physiological and behavioral temperature regulation. Charles C. Thomas Publishing, Springfield, IL, p 345−357 Mitchell JW (1976) Heat transfer from spheres and other animal forms. Biophys J 16:561−569 Mrosovsky N, Pritchard PCH (1971) Body temperatures of Dermochelys coriacea and other sea turtles. Copeia 4: 624−631 Mrosovsky N, Ryan GD, James MC (2009) Leatherback turtles: the menace of plastic. Mar Pollut Bull 58:287−289 Packard G, Packard M, Miller K, Boardman T (1987) Influence of moisture, temperature, and substrate on snapping turtle eggs and embryos. Ecology 68: 983−993 Paladino FV, O’Connor MP, Spotila JR (1990) Metabolism of leatherback turtles, gigantothermy, and thermoregulation of dinosaurs. Nature 344:858−860 Paladino FV, Spotila JR, O’Connor MP, Gatten RE Jr (1996) Respiratory physiology of adult leatherback turtles (Dermochelys coriacea) while nesting on land. Chelonian Conserv Biol 2:223−229 Patino-Martinez J, Marco A, Quiñones L, Hawkes L (2012) A potential tool to mitigate the impacts of climate change to the Caribbean leatherback sea turtle. Glob Change Biol 18:401−411 Pike DA (2013) Climate influences the global distribution of sea turtle nesting. Glob Ecol Biogeogr 22:555−566 Poloczanska ES, Limpus CJ, Hays GC (2009) Vulnerability of marine turtles to climate change. In: Advances in marine biology, Vol 56, 1st edn. Elsevier, Madison, Wisconsin, p 151−211
➤
➤
➤ ➤
➤
➤ ➤
➤
➤
➤ ➤
➤
➤
277
Porter WP, Mitchell JW (inventors), Wisconsin Alumni Research Foundation (assignee) (2006) Method and system for calculating the spatial-temporal effects of climate and other environmental conditions on animals. United States patent US 7,155, 377 B2. 2006 Dec 26 Porter W, Mitchell J, Beckman W, DeWitt CB (1973) Behavioral implications of mechanistic ecology. Thermal and behavioral modeling of desert ectotherms and their microenvironment. Oecologia 13:1−54 Riahi K, Grübler A, Nakicenovic N (2007) Scenarios of longterm socio-economic and environmental development under climate stabilization. Technol Forecast Soc Change 74:887−935 Saba V, Stock C, Spotila J (2012) Projected response of an endangered marine turtle population to climate change. Nat Clim Change 2:814−820 Santidrián Tomillo P, Suss JS, Wallace BP, Magrini KD, Blanco G, Paladino FV, Spotila JR (2009) Influence of emergence success on the annual reproductive output of leatherback turtles. Mar Biol 156:2021−2031 Santidrián Tomillo P, Saba VS, Blanco GS, Stock CA, Paladino FV, Spotila JR (2012) Climate driven egg and hatchling mortality threatens survival of eastern Pacific leatherback turtles. PLoS ONE 7:e37602 Sherrill-Mix SA, James MC, Myers RA (2007) Migration cues and timing in leatherback sea turtles. Behav Ecol 19:231−236 Shillinger GL, Palacios DM, Bailey H, Bograd SJ and others (2008) Persistent leatherback turtle migrations present opportunities for conservation. PLoS Biol 6:e171 Southwood A, Andrews R, Paladino F, Jones DR (1999) Body temperatures of leatherback sea turtles during the internesting interval. In: Proc 19th Ann Symp Sea Turtle Conserv Biol, South Padre Island, TX, p 117−119 Southwood AL, Andrews RD, Paladino FV, Jones DR (2005) Effects of diving and swimming behavior on body temperatures of Pacific leatherback turtles in tropical seas. Physiol Biochem Zool 78:285−297 Spotila JR (2004) Sea turtles: a complete guide to their biology, behavior, and conservation, 1st edn. John Hopkins University Press, Baltimore, MD Spotila J, Zimmerman L (1994) Effects of incubation conditions on sex determination, hatching success, and growth of hatchling desert tortoises, Gopherus agassizii. Herpetol Monogr 8:103−116 Spotila JR, Dunham AE, Leslie AJ, Steyermark AC, Plotkin PT, Paladino FV (1996) Worldwide population decline of Dermochelys coriacea: are leatherback turtles going extinct? Chelonian Conserv Biol 2:209−222 Spotila JR, O’Connor MP, Paladino FV (1997) Thermal biology. In: Lutz PL, Musick JA (eds) The biology of sea turtles. CRC Press, Boca Raton, FL, p 297−314 Swinbank WC (1963) Long-wave radiation from clear skies. Q J R Meteorol Soc 89:339−348 Tapilatu RF, Tiwari M (2007) Leatherback turtle, Dermochelys coriacea, hatching success at Jamursba-Medi and Wermon beaches in Papua, Indonesia. Chelonian Conserv Biol 6:154−158 Tomillo PS, Saba VS, Piedra R, Paladino FV, Spotila JR (2008) Effects of illegal harvest of eggs on the population decline of leatherback turtles in Las Baulas Marine National Park, Costa Rica. Conserv Biol 22: 1216−1224 Vuuren DP, Elzen MGJ, Lucas PL, Eickhout B and others (2007) Stabilizing greenhouse gas concentrations at low
Mar Ecol Prog Ser 501: 265–278, 2014
278
➤ ➤
➤
levels: an assessment of reduction strategies and costs. Clim Change 81:119−159 Wallace BP, Jones TT (2008) What makes marine turtles go: a review of metabolic rates and their consequences. J Exp Mar Biol Ecol 356:8−24 Wallace BP, Williams CL, Paladino FV, Morreale SJ, Lindstrom TR, Spotila JR (2005) Bioenergetics and diving activity of internesting leatherback turtles Dermochelys coriacea at Parque Nacional Marino Las Baulas, Costa Rica. J Exp Biol 208:3873−3884 Wallace BP, Sotherland PR, Spotila JR, Reina RD, Franks BF, Paladino FV (2004) Biotic and abiotic factors affect the nest environment of embryonic leatherback turtles, Der-
➤
mochelys coriacea. Physiol Biochem Zool 77:423−432 Weems R (1988) Paleocene turtles from the Aquia and Brightseat formations, with a discussion of their bearing on sea turtle evolution and phylogeny. Proc Biol Soc Wash 101:109−145 Witherington B, Hirama S, Mosier A (2011) Barriers to sea turtle nesting on Florida (United States) beaches: linear extent and changes following storms. J Coast Res 27: 450−458 Witt MJ, Augowet Bonguno E, Broderick AC, Coyne MS and others (2011) Tracking leatherback turtles from the world’s largest rookery: assessing threats across the South Atlantic. Proc R Soc Biol Sci 278:2338−2347
Appendix. Source information of the 9 internet images used to measure the ratio of leatherback body dimensions (see ‘Materials and methods: biophysical/physiological model’ and Fig. 2). All images were accessed on 17 June 2013 Photo credit (Year)
Photo title, legend or page title
Georges JY (2011)
Atlantic leatherback strategy Sea Turtle Conservancy retreat at St. Catherines Is
http://www.conserveturtles.org/ images/seaturtles/leatherback-onbeach-Georges.jpg
Isley J (2013)
Leatherback turtle (Dermochelys coriacea)
ARKive
http://cdn2.arkive.org/media/D1/ D123BCA6-C8CB-4FCC-8AFAF8341EFBC3F6/Presentation.Large/ Dead-captured-leatherback-turtlehanging-under-fishing-boat.jpg
Majzy B (2012)
Leatherback
Intelligent travel (National Geographic)
http://intelligenttravel. nationalgeographic.com/files/2012/08/ Leatherback_Bernard_Majza_225326950x626.jpg
National Park Service (2010)
Leatherback turtle (Dermochelys coriacea)
National Park Service
www.nature.nps.gov/biology/ migratoryspecies/images/ exLeatherback.jpg
National Park Service (2013)
Virgin Islands National Park: National Park Service photo gallery, sea turtles
www.nps.gov/common/uploads/ photogallery/akr/park/viis/2D4053B61DD8-B71C-07F4200E8812FB0D/ 2D4053B6-1DD8-B71C07F4200E8812FB0D-large.jpg
Perrine D (2010)
Conservation coalitions support leatherback critical habitat
http://seaturtles.org/img/original/ Doug%20Perrine%20 Leatherback%201.jpg
Project STR (2013)
Leatherback on international Sea Turtle Restoration climate change hit list Project
http://seaturtles.org/img/ original/Doug%20Perrine%20 Leatherback%202.jpg
Rahim S (date unknown)
#2249229-leatherback
Fotolia
http://us.fotolia.com/id/2249229
Skerry B (2009)
Ancient mariner
National Geographic
http://s.ngm.com/2009/05/ leatherbacks/img/leatherbacks-01615.jpg
Editorial responsibility: Brian Helmuth, Nahant, Massachusetts, USA
Host homepage title
Sea Turtle Restoration Project
Photo url
Submitted: January 23, 2013; Accepted: November 23, 2013 Proofs received from author(s):March 6, 2014