Discrete Event Simulation of manufacturing systems has become widely ... mum design for a manufacturing system in the shortest possible time. Systems ...
Proceedings of the 2003 Winter Simulation Conference S. Chick, P. J. Sánchez, D. Ferrin, and D. J. Morrice, eds.
USING EMPIRICAL EVIDENCE OF VARIATIONS IN WORKER PERFORMANCE TO EXTEND THE CAPABILITIES OF DISCRETE EVENT SIMULATIONS IN MANUFACTURING Tim Baines Linda Hadfield Steve Mason
John Ladbrook Dunton Engineering Centre Ford Motor Company Laindon, Essex, SS15 6EE, ENGLAND
School of Industrial and Manufacturing Science Cranfield University Cranfield, Bedfordshire, MK43 0AL, ENGLAND
tion of the results predicted by DES models of systems involving workers against wholly automated systems suggests that the basis for this difference lies in the inability of DES to represent the performance of direct workers accurately. Consequently, in order to improve the effectiveness of manufacturing systems, there is a need for the development of techniques that can be used to extend the scope of DES by taking into account the performance of direct workers (Baines and Kay 2002). The work described in this paper is concerned with the development of tools and techniques for modeling the performance of direct workers, known as Human Performance Modeling (HPM). In order to develop such tools, it is first necessary to demonstrate the existence of variability in worker performance, and define its magnitude, profile and impact on the overall manufacturing system. To achieve this aim a three-month study was carried out to track the performance of direct workers on an assembly line. Data were collected on the processing times taken by each worker to complete a task. The study was based on two null hypotheses: that the times taken to complete a task by different workers would be equivalent; and that the time taken to complete different tasks would be equivalent. However, the data revealed that considerable variations exist both between workers and between tasks. The study produced distributions of task completion times that vary both in the form of the distribution and the mean values observed. These empirical distributions will be used in the development of a modeling tool to improve the accuracy of DES. The structure of the paper is as follows: a review of the background to the use of assembly lines in manufacturing, and the assumptions of worker behaviour embodied by this; a discussion of the use of empirical data to improve DES accuracy; a description of the design and execution of the empirical study; a summary of the main results from the analysis of the empirical study; and a discussion of the implications for the development of HPM tools, and the design of manufacturing systems in general.
ABSTRACT Discrete Event Simulation of manufacturing systems has become widely accepted as an important tool to aid the design of such systems. Often, however, it is applied by practitioners in a manner which largely ignores an important element of industry; namely, the workforce. Workers are usually represented as simple resources, often with deterministic performance values. This approach ignores the potentially large effect that human performance variation can have on a system. A long-term data collection exercise is described with the aim of quantifying the performance variation of workers in a typical automotive assembly plant. The data are presented in a histogram form which is immediately usable in simulations to improve the accuracy of design assessment. The results show levels of skewness and range which are far larger than anticipated by current researchers and practitioners in the field. 1
INTRODUCTION
Modern demand-led approaches to manufacturing, such as JIT (just-in-time) and lean manufacturing impose a requirement on manufacturing systems to be flexible and able to respond rapidly to changes in demand for end products. This presents a challenge for the designers of manufacturing systems, who are expected to be able to respond rapidly to changes in requirements, and produce the optimum design for a manufacturing system in the shortest possible time. Systems designers use Discrete Event Simulation (DES) to respond to this challenge, designing and redesigning the required systems through the use of computer models, which can be easily adapted and re-evaluated without the need to invest time and effort in changing the physical systems (Chan 1995). However, the results predicted by DES models have consistently been shown to be different from the results that occur in practice. Observa-
1210
Baines, Hadfield, Mason, and Ladbrook 2
designers if the scope of DES could be extended by developing tools to simulate worker behaviour, allowing informed design decisions that positively impact both the system and the workforce. Ideally a HPM tool would predict the impact of those human behaviours and performance variations that significantly affect system performance. In practice, social science has yet to address many of the issues of behaviour at work, and much of the social science literature is not suitable for predicting human performance. However, models and techniques are emerging within the social science domain (Ilgen and Hulin 2000), and the military arena (Pew and Mavor 1998), that clearly indicate that some valid modeling of worker performance is possible. Outside of the laboratory, in the specific context of manufacturing, the time and cost of developing theoretical models of human performance of sufficient rigour to improve DES accuracy is prohibitive. An alternative approach is to use empirical data to represent human performance variation, rather than attempting to predict from social science theory.
BACKGROUND
The origins of the modern assembly line lie in the development of the “Scientific Management” approach to industrial production, originally designed by F. W. Taylor in the early 20th century, and put to practical application by Henry Ford in his factory at Highland Park, Detroit, Michigan, constructed in 1913 (Womack, Jones and Roos 1990). The basis of scientific management involved two aspects: the principle of interchangeability and the division of labour (Askin and Standridge 1993). The principle of interchangeability refers to the standardization of the individual components that make up a finished product, such that components are interchangeable between product units. Division of labour refers to the breaking down of a job into smaller component tasks and activities that can be easily learnt with a minimum of training of the workers. In this way, workers, as well as parts, become interchangeable units, able to repeat the actions required of them in a standardized, controllable and highly predictable manner. In order to coordinate the overall production process, the various tasks that are carried out sequentially must be equivalent in the time taken to execute them. If this is not the case, bottlenecks and part shortages will occur as the product unit moves down the line. The tasks are carefully designed, and predicted execution times (work standard times) calculated based on observation (work study) of the times typically taken to carry out similar activities. In this way, designers attempt to ensure that the line is ‘balanced’, i.e. that different tasks can be completed in equivalent time, and that the line can therefore run smoothly. The design of the assembly line thus implies two assumptions. Firstly, because of the way in which tasks are designed to be as simple and standardized as possible, the performance of different individual workers should be equivalent. Secondly, in order for the line to be balanced correctly, the time taken to perform different tasks must also be equivalent. There should therefore be no scope for individual human variability, which in theory has been designed out of the system. Discrete Event Simulation models, which are designed to allow system designers to investigate and predict the performance of manufacturing systems, have therefore to date treated direct workers as simple components, and assumed no variation between them (Bernhardt and Schilling 1997). However, the predictions produced by DES models of highly automated systems are notably more accurate than those involving direct workers (Baines and Kay 2002). The existence of this ‘gap’ suggests that individual workers can in fact have an impact on overall system performance. This gap between manufacturing system performance as predicted by DES models, and the outputs that such systems generate in practice, creates problems for system designers. It would therefore be helpful for system
3
EMPIRICAL DATA IN SIMULATION MODELS
The use of empirical data to represent parameter variance is a well-established technique in DES. Machine breakdowns, tool change intervals, and component inter-arrival times are all often modeled using probability distributions, derived either from empirical data or mathematical distributions which have been shown to fit certain parameters e.g. the Weibull distribution used to represent the time to failure of equipment (Law and Kelton 1991). Simulation models employing such techniques are identified as stochastic, rather than deterministic, models. Many simulation tools already have the capability to attach probability distributions to worker activity times, and thus introduce human performance variability with little programming or run-time overheads. The difficulty in applying this approach successfully is knowing which distribution to apply, and what limits to set. For any given task, there will be a minimum task time below which it is impossible to complete the task with an appropriate level of quality or stamina. In theory there is no upper limit for a task, a worker can conceivably take as long as they like, in practice however the controls of the system, management and peer pressure ensure that the task is completed in a reasonable time. Long task times may occur, but they will have a low probability of occurrence. These upper and lower limits will change depending on which operator is conducting the task. At present such limits may be set by company work-study conventions. In the host company studied during the experimental work the limits expected were from 80% to 120% of the standard time for a task. If the profile of the distribution is known, these limits could be used to approximate worker variability. However, this work shows that in reality the limits lie
1211
Baines, Hadfield, Mason, and Ladbrook ity (e.g. viable parts per million). Such measures provide an insight into the overall performance of a proposed system. Micro measures can also be taken of individual machines, such as utilization etc. A number of performance variables relating to the performance of individual workers were considered in the study: • Work station activity time: The time taken to complete a single task. • Error rate: An indication of how well an operator conducts a task. Errors are any deviation from product specification, which may result in unserviceable product (“scrap”) or product that requires additional processing to become serviceable (“rework”). • Dependability: Given that all conditions for a task to commence are met, when does the operator start the activity in response to a request? This paper will concentrate on workstation activity rate. Various methods of measuring activity rate were considered. Methods involving direct observation were discarded for two major reasons: firstly, because of objections from the workers taking part in the study, and the concerns that direct observation would potentially affect the performance which was being measured, as occurred in the classic Hawthorne studies (Mayo, in Pugh 1997). Secondly, direct observation was infeasible because of the impracticality of observing workers for long periods of time to gather sufficient data to form complete distributions. The assembly line used in the study is divided into ten main work zones, which were included in the study, with additional testing and finishing zones, which were not included because the processes performed on them are atypical. Product units travel along the line on platens, passing through all of the zones in turn. Each of the zones included in the study contains a number of tasks, or operations, which are performed by a team of workers, varying in size from 6 to 12 people. Each individual on the team works on all the operations in their zone, moving on to the next operation on an hourly basis. The workers voiced concerns about the measuring and traceability of personal performance, and it was therefore decided to monitor just one operation in each of the ten zones, the operations chosen being those in each zone with the highest planned workstation activity time. This allowed the researchers to monitor differences in activity time on different operations and for different teams of workers, but without being able to relate specific performance back to identifiable individuals. The manufacturing system under study assembles automotive engines, with the engines moving from one workstation to another along powered and free roller track. The line consists of a mixture of manual and high precision automatic machines which necessitates that the engines are mounted on metal platens (Figure 1), which act not only as material handling pallets but also as work holders during the operations. The plant has an active union representa-
far outside the work-study limits. The experimental results also provide accurate distribution profiles for a variety of different tasks. Several possible alternative approaches to integrating empirical data into DES exist. Trace driven models use time series data streams of real parameters, collected in existing systems, to drive the simulation runs (Law and Kelton 1991). This technique has a number of limitations. Firstly, it is difficult and time consuming to gather sufficient data for long simulation runs or to allow different data streams to be used in each experiment. Secondly, the data will be a function of the system it is collected from, and may be completely inappropriate for the system being modelled. Thirdly, trace driven models ignore the effect that the system has on the performance of the individual. The second and third limitations apply also to the use of distributions, and are therefore limitations of the current research approach. The limitations of data driven models can be overcome by incorporating more detailed empirical data concerning not only performance variation, but also worker behaviour and the effect of the system. For example, it is known that the state of the buffers surrounding a workstation may influence the performance of a worker. Such feedback mechanisms are prevalent in the study of human behaviour. Mediating effects like these may be represented using techniques such as micro modeling, where numerical models are used to relate input parameters such as environmental conditions, system status, and organizational issues, to output parameters such as activity time and error rate (Mason, Siebers and Baines, 2002). Although the use of such advanced techniques may improve the accuracy of DES beyond the capabilities of probability distributions and time series data, a significant research effort is required to develop and implement them. 4
EXPERIMENT DESIGN
The aim of the study was to investigate the magnitude and profile of worker activity time variation on a manual assembly line. Two objectives were therefore identified. The first was to define the true limits of human variability in performance on an assembly line, as measured by activity time, the time taken to perform a manual task. The second was to form probability distributions of worker activity times for application to DES, thus revealing the profile of human variability in the experimental context of a flowline assembly system. In order to achieve these objectives, some mechanism was required to allow the collection of information on worker performance. This section of the paper describes the methodology adopted to gather the required data. Design engineers assess the effectiveness of manufacturing systems on the basis of many performance measures generated by DES models. Typical measures include: output of the system (e.g. units per hour), lead-time and qual-
1212
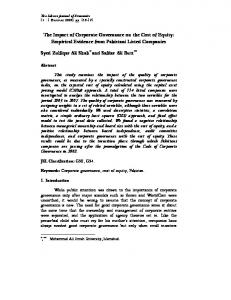
Baines, Hadfield, Mason, and Ladbrook length out of the station. Figure 1 shows the four stages and times involved in the time logging process. The time recorded by the logger, tL , is given by t3 – t0, while the true activity time, tat is given by t2 – t1. The error tL – tat is a constant for all the operations measured, and based on measurements of the line speed, and ignoring deceleration and acceleration effects the constant error is estimated as 2.5 seconds. However, since it is common practice for the operator to begin work on the engine while it is still indexing in to the station, tL is regarded as synonymous with tWS for the purposes of the work described in this paper. Using this method, it was possible to monitor the work stations 24 hours a day, 5 days a week, over a 12 week period, generating approximately 150,000 data points for each operation monitored. The plant operates a twenty four hour, three times eight hours shift system, with three crews of workers. Of the three crews of workers working on the line during the study period, two were directly comparable, but the third consisted of a smaller number of workers per team, some of whom were required to perform more than one task. Although data were collected for this crew (Crew B), they were not included in the analysis. In addition to the workstation data, information was also collected about a number of contextual factors e.g. breakdowns, part shortages, and quality problems. and a number of potential contributory factors, relating to the individual attitudes of the workers, the physical environment and the organizational environment.
Stage 1: Platen enters workstation, activates logger switch, logger records event as a date and time, t0 ENGINE ON PLATEN
Event logger switch activates Stage 2 : Engine continues to move onto station, comes to rest with logger switch activated, t1 ENGINE ON PLATEN
Event logger switch activated
Stage 3: Operation completed, engine begins to move from station, t2 ENGINE ON PLATEN
Event logger switch activated
Stage 4: Engine leaves station completely, logger records event as a date and time, t3 Event logger switch deactivated
ENGINE ON PLATEN
5
DATA ANALYSIS
The data initially collected consisted of the time at which the switch on the underside of the platen was activated, t0, and the time at which the platen left the station, t3, as shown in figure 1. Hence, the activity time is given by
Figure 1: Activity Time Recording Process tion, and hence no automatic monitoring of activity times is carried out on the line. A logging system was therefore installed on the line to monitor the selected operations. In order to monitor the activity time on each operation, switches were installed underneath the workstations to record platen movements (Figure 1). The times measured were not exactly equal to the activity time, but were actually the length of time each engine spent at the monitored stations. The sequence of events for each operation on the line is as follows. The operator presses a foot switch to release the platen currently at their station, and move the next platen to their workstation from the upstream buffer. The platen arrives at the workstation and comes to a stop; the operator then performs the required activities, before starting the cycle again. Due to the configuration of the logging equipment, the time measured was actually equivalent to the time taken for the platen to move half its length and stop, the time the platen was stationary, and then the time taken for the platen to accelerate and move half its
t at (n) = t 3 (n) − t 0 (n) ,
(1)
where tat(n) is the activity time for platen n, t3(n) is the time at which platen n leaves the station and t0(n) is the time at which platen n arrives at the station. In addition, it is possible to calculate the gap between consecutive platens; t gap (n) = t 0 (n + 1) − t 3 (n) ,
(2)
where tgap (n) is the time between platen n leaving the station, and platen (n+1) arriving, t0(n+1) is the time at which platen (n+1) arrives at the station and t3(n) is the time at which platen n leaves the station.
1213
Baines, Hadfield, Mason, and Ladbrook The overall cycle time was calculated as the sum of work station activity time and the subsequent gap; tct (n) = t at (n) + t gap (n − 1) ,
2000
(3)
1500
1000
500
0 32
29
26
.0
.0
0
0
0
0
0
0
0
0
.0
.0
.0
.0
.0
23
20
17
14
.0
00
00
11
8.
5.
6
F requency
where tct(n) is the cycle time for platen n, tgap(n-1) is the time between platen (n-1) leaving the station, and platen n arriving. The data were examined to remove those data points which corresponded to a scheduled break, or the handover time between two crews of workers at the end of a shift. The remaining data were plotted as frequency histograms of activity times and cycle times for each of the 10 operations monitored. The initial histograms showed extreme workstation times of several minutes in some cases, as well as extremely short workstation times (less than 5 seconds). These short workstation times were clearly too short to possibly reflect actual work taking place, and it is to be assumed that they reflect cases where the worker moves the platen on without carrying out any work on the product unit, either because the product unit is faulty due to a problem upstream, or because the worker has been “working ahead”, i.e. working on the product unit before it arrives at the station. Various smoothing methods were tried to remove these extreme workstation times, including discarding the top 5% of workstation times for each hour (ninety-fifth percentile method) and discarding any jobs for which the overall cycle time (workstation time + subsequent gap) exceeded 27 seconds (line speed plus 20%). These smoothing methods removed the most extreme data points, but analysis showed that they did not significantly affect the shapes of the resultant distributions.
Activity time (Seconds)
Figure 2: Activity Time Frequency Histogram for Operation A 1000
F requency
800
600
400
200
RESULTS
0 36
33
29
26
22
19
15
.5
.0
0
0
0 .5
0 .0
0 .5
0 .0
0 .5
0 .0
50
00
12
8.
5.
As described in Section 2, the principles on which assembly lines are based assume that assembly tasks are designed to be as similar as possible in terms of the time required for their execution. Only if this is the case can the line be balanced and hence run smoothly. The most striking finding from the present study, however, was the marked differences in the distributions of activity time generated by the different tasks. Figures 2 and 3 show comparative frequency distributions for two of the operations monitored. Neither of the distributions has a statistically normal (bell-shaped) distribution. Figure 2 shows a bi-modal distribution, i.e. in addition to a large peak at an activity time of 8 seconds, there is also a smaller peak at 14 seconds. This suggests that there exist at least two different ways of completing the task, although the exact meaning of this cannot be interpreted from the numeric data alone, and direct observation is required to investigate this further.
Activity Time (Seconds)
Figure 3: Activity Time Frequency Histogram for Operation B Figure 3 shows an operation which has a single dominant peak at 19 seconds, but also a large number of extremely short activity times of 5 seconds or less. It is postulated that this is caused by the operator working “up the line” on product units which have yet to arrive at the station proper, and then pressing the button repeatedly to move the completed units through to the next work station. However, as before, this behaviour can only be confirmed through direct observation. In addition to the assumption that all tasks are substantially equivalent in the time they take to complete, similarly it is thought that different operators will take the same amount of time to complete a task. Time series analysis of the data has shown that there may be significant differ-
1214
Baines, Hadfield, Mason, and Ladbrook tools, which will allow system designers to investigate the impact of varying the underlying causal factors. It will also lead to a more robust understanding of the factors that affect the performance of direct workers. Through improving designers’ ability to predict the behaviour of direct workers, HPM offers the potential of designing more accurate models, improving the flexibility and effectiveness of the resulting systems.
ences in both the mean value and spread of activity time from hour to hour, as individual workers in the team rotate around the tasks in their work zone. Figure 4 shows data taken from a typical eight hour shift, where the differences from hour to hour can clearly be seen.
Activity time (secs)
60 50 40
ACKNOWLEDGMENTS
30 20
This work is funded by EPSRC and the Ford Motor Company. Many thanks to the Ford Modeling Group, including Sola Adesola, Rachel Asch, Sarah Fletcher, John Kay, Paul Mason, Peer Siebers, and Val Vitanov. Thanks also to the members of the HPM.net (see ).
10
0 :0 22
:0 0 21
:0 0 20
0 :0 19
0 :0 18
:0 0 17
0 :0 16
0 :0 15
14
:0 0
0
Hour in day (Late shift)
Figure 4: Time Series Scatter Plot of Activity Time Variations over Shift Period 7
REFERENCES Askin, R. G. and Standridge, C. R. 1993. Modeling and Analysis of Manufacturing Systems. New York: John Wiley & Sons. Baines, T. and Kay, J. M. 2002. Human performance modelling as an aid in the process of manufacturing system design: a pilot study. International Journal of Production Research 40(10): 2321-2334. Bernhardt, W. and Schilling, A. 1997. Simulation of Group Work Processes in Manufacturing. In Proceedings of the 1997 Winter Simulation Conference, ed. Andradóttir, S., Healy, K.J., Withers, D.H., and Nelson, B.L. 888-891. Chan, F. S. 1995. Using simulation to predict system performance: a case study of an electro-phoretic deposition plant. Integrated Manufacturing Systems 6 (5): 27-38. Hadfield, L., Fletcher, S., Mason, J. P., Baines, T. and Ladbrook, J. 2002. A Theoretical Framework for Human Performance Modelling. In Proceedings of the Second International Conference on Systems Thinking in Management (ICSTM02), Salford University, 3rd5th April 2002. Ilgen, D. R. and Hulin, C. L. (editors). 2000. Computational modeling of behavior in organizations. American Psychological Association. Law, A. M. and Kelton, W. D. 1991. Simulation modeling and analysis, 2nd ed. New York: McGraw-Hill. Mason, S., Siebers, P-O. and Baines, T. 2002. Humans: The Missing Link in Simulation? In Proceedings of the OR Society Simulation Study Group Two Day Workshop, University of Birmingham, 20-21st March. Mayo, E. 1997. Hawthorne and the Western Electric Company. In Organization Theory: Selected Readings, Pugh, D.S. (ed), Penguin Books, Chapter 17: 355-368. Pew, R. W. and Mavor, A. S (editors). 1998. Modeling human and organizational behavior: application to military simulations. National Academy Press.
CONCLUSIONS AND FURTHER WORK
The results of the study show that the performance of direct workers, as measured in terms of process times, varies considerably. This implies that current methods of predicting system performance, which ignore the effect of worker behaviour, are inadequate to explain system behaviour fully. Contrary to the hypothesis that the times taken to process these operations would be consistent, the study demonstrated that process times vary widely. It would seem, therefore, that the assumption that worker performance can be easily predicted is incorrect. This finding has implications for the effectiveness of both DES and work study, and indicates the importance of the development of Human Performance Modeling tools and methods. A first step in the exploitation of these findings to extend the scope of Discrete Event Simulation will make direct use of the distributions of activity times. Work is currently underway on the development of a computer-modeling tool which will allow the user to select from a number of distributions of activity times and incorporate these into models of the assembly line. This offers a significant improvement on present methods, in which activity times are assumed to be uniform, or randomly distributed. A further development of the work concerns the additional data which has been collected with relation to contextual factors, individual worker attitudes, environmental conditions and organizational factors. This information will be used to investigate a theoretical framework of the factors that affect direct worker performance. The identification of the most significant factors will permit the generation of numerical micro models of the relationships between input factors and performance measures. These will be used in the development of more sophisticated HPM
1215
Baines, Hadfield, Mason, and Ladbrook Womack, J. P., Jones, D. T., and Roos, D. 1990. The machine that changed the world. Oxford: Maxwell Macmillan International. AUTHOR BIOGRAPHIES TIM BAINES is a Senior Lecturer at Cranfield, having joined the department after completing a period of postdoctoral research at Massachusetts Institute of Technology, in the USA. His principal research streams are concerned with the strategic outsourcing of the manufacturing function, manufacturing technology sourcing, and human performance modeling within manufacturing system design. He has considerable industrially experience having worked for JCB Excavators, GEC, and APV Baker in the UK, and researched with Honda, Harley Davidson, Case, Caterpillar and Ford in the USA. Tim can be reached at . LINDA HADFIELD joined the Manufacturing Systems department in 2001 as a Research Officer. Her experience includes a BSc in Economics and Statistics from the University of Southampton; nine years in commercial IT (including stints in programming, operational research and systems analysis); an Open University degree in Systems and Social Science; and a PhD in Innovation and Technology Assessment from the International Ecotechnology Research Centre. She is currently working on the Ford Human Performance Modelling Project, looking at the effects of systemic and organisational factors on worker productivity and behaviour. STEVE MASON received a B.Eng. (Hons) Mechanical Engineering from North Staffordshire Polytechnic in 1988, a Postgraduate Diploma in Management Studies from the University of Wolverhampton in 1992 and a Postgraduate Diploma in Computer Aided Engineering from Staffordshire University in 2000. His experience includes industrial project engineering and academic roles at Staffordshire University. He is currently a research student at Cranfield University, sponsored by EPSRC and Ford, with interests in human factors and manufacturing simulation. JOHN LADBROOK has worked for the Ford Motor Company since 1968 where his current position is Simulation Technical Specialist. In 1998 he gained a M.Phil. (Eng.) at the University of Birmingham, where he has also been a part-time lecturer since 1996. He has been instrumental in the application of Discrete Event Simulation at Ford since 1982, and in this role he has been responsible for sponsoring and supervising many projects with software developers and academic institutions including Cranfield, Warwick and Aston University. He is has been a Cranfield University Fellow since 2001.
1216