water allocation and pollution reduction in the Middle Route of the South - North Water Transfer Project in China. Regression methods are used to formulate ...
254
2010206 46 (3)
北京师范大学学报 ( 自然科学版) Jo urnal of Beijing No rmal U niversity (Nat ural Science)
USING GAME THEO RY BASED APPROACHES TO SIM UL ATE STA KEHOLD ER CO NFL ICTS CO NCERNING DOMESTIC WATER ALLOCATIO N AND POLL UTIO N RED UCTIO N IN INTER2BASIN WATER TRANSFER IN CHINA 3 W E I S houke 1 , 2) YA N G H on g 1) ( 1) Swiss Federal Instit ute of Aquatic Science and Technology ( EAWA G) , CH28600 , Dü bendorf , Switzerland. 2) Depart ment of Ecosystem and Environmental Informatics , Brandenburg Universit y of Technology , D203046 ,Cott bus , Germany) )
Abstract The game t heoretic based simulation app roaches are p ropo sed to analyze conflict s co ncerning do mestic water allocatio n and pollution reduction in t he Middle Route of t he Sout h - No rt h Water Transfer Project in China. Regression met hods are used to fo rmulate payoff f unctions of t he players , eco nomic valuatio n met hods ( EVMs ) to t ransform non2mo netary value into eco no mic o ne , co st2benefit analysis (CBA) to co mpare t he game outcomes , as well as scenario analysis to investigate t he f ut ure uncertainties. The validity of t he game simulatio n was evaluated by co mparing p redictions wit h o bservations. The main result s p roved t hat cooperation would make t he players collectively better off , t ho ugh so me players would face lo sses. It also revealed t hat water pollutio n reductio n wo uld result in a p riso ners ’ dilemma due to unwilling cooperatio n f rom some players. Scenario simulatio n result s displayed t hat water deficit p roblem in t he water scarce area co uld not be solved wit ho ut cooperation even under an optimistic scenario . The application of t ho se app roaches and result s will be info rmative for a st rategic planning on water dist ributio n , water p ricing and ecological co mpensation in t he regio ns co ncerned. Key words water conflict s ; game t heo ry ; economic valuation ; scenario analysis ; t he Sout h2Nort h Water Transfer Project in China
( SN W T) Project s , including t he East Ro ute Project ,
0 Intro duction
t he Middle Ro ute Project and t he West Ro ute
Water scarcit y is o ne of t he vital p ro blems in
Project . However , interbasin water diversio n usually
many co unt ries in t he world. It is estimated t hat
involves different stakeholder s wit h co nt radictory or
today over 2 billio n people are affected by water
co nflicting interest s [ 526 ] , goal s and st rategies [ 3 ] .
shortage in more t han 40 co unt ries in which 11 1 [1 ]
Many eco no mic and political inst rument s have
. Water
been used to solve such co nflict s[ 2 ,7 ] , and water
qualit y degradatio n has beco me o ne of t he main
market app roach is o ne f requently cited in t he
billio n cannot get eno ugh drinking water reaso ns causing water shortage p ro blem
[ 223 ]
. Water
literat ure
[ 8212 ]
. Water market can p rovide water users
diver sio n has been an important measure to alleviate
wit h incentives to use water efficiently , but it
water scarcit y in many co unt ries , especially in China.
requires defining t he original water right s , creating
Due to spatially uneven dist ributio n of p recipitatio n ,
instit utio nal and legal mechanisms , and establishing
water shortage has been a p rolo nged and widesp read
basic inf rast ruct ures for water t rade
p ro blem in t he No rt hern regio n of China
[4 ]
[ 2 ,13 ]
before water
. In order
market can operate well . Waste discharge is a p ublic
to mitigate t he existing water crisis , t he engineer s in
bad , every polluter can f ree2ride ot her s’achievement
China p ropo sed t he So ut h to No rt h Water Transfer
of t reat ment
收稿日期 :2009212216
[ 14 ]
.
Free2riding p ro blem will cause
WEI Shouke , et al : U SIN G GAM E T H EOR Y BASED A PPROAC H ES TO SIMUL A TE STA KE HOLD ER CON FL IC TS CONCERN IN G DOM ESTIC WA TER ALLOCA TION AND POLL U TION 第 3 期 R EDUC TION IN IN T ER2BASIN WA TER TRANSFER IN C H INA
255
market failure. In t he absence of market and p ropert y
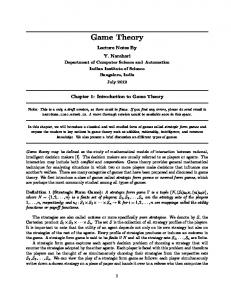
covers a total area of abo ut 155 000 km2 . The ro ute
multi2stakeholders
cro sses abo ut 200 river channel s or canal s wit h a total
right ,
co nflict s
between
co mpeting for water uses are unavoidable
[ 3 ,15 ]
.
[ 22 ]
lengt h of 1 246 km.
.
Game t heory is an app rop riate app roach to model
Beijing is located in t he nort h2eastern part of
and solve such water co nflict s. A game is a metap hor
China , and it covers an area of 16 808 km ( Fig. 12
of t he ratio nal behavior s of multi2actors in an
b) . It belo ngs to a temperate , semi2humid climate
interacting or interdependent
sit uatio n , such as
do minated mainly by t he Pacific mo nsoo n wit h t ypical
cooperating ,co nflicting ,co mpeting ,coexisting ,etc [ 3 ] .
diver sified nat ure : cold and dry winter , and hot and
In water reso urces management , it was originally
rainy summer , and t he annual average p recipitatio n is
applied in t he co st dist ributio n in joint water reso urce
abo ut 601mm. Due to t he rapid increase in water use
p roject s , i. e. waste water t reat ment and dispo sal
and water pollutio n , water scarcit y is o ne of t he
[ 7 ,16 ]
facilities
.
Lewandowski
[ 17 ]
game2
used a
serio us p ro blems facing t his cit y.
The current
t heoretic app roach to model t he behavio ur of water
available water reso urces per capita is 247 m3 per
user s in a qualit y co nt rol p ro blem , and he p ropo sed a
year , much less t han t he standard for water shortage
game2t heoretic solutio n to different uses of a water
( 1 000 m3 per capita ) defined by t he U nited Natio n
system. Game t heory was used to analyze equitable
( U N ) , and below t he minimum ( 300 m3 per capita )
allocatio n of waste loads to a co mmo n receiving
t hat t he U nited Natio ns Educatio nal , Scientific and
[ 14 ,18224 ]
medium
.
It was also applied into solve
p ro blem in t ransbo undary river pollutio n , including inter2co unt ry river
[6 ]
and int ra2co unt ry river
[ 21 ]
.
Cult ural Organizatio n ( UN ESCO ) defines to ensure a modern social life and production[ 23 ] . The Hanjiang River originates f ro m t he so ut hern
The aim of t his st udy is to establish game
part of Shaanxi p rovince , cro sses t hro ugh Shaanxi
t heoretical simulatio n model s to analyze t he potential
and Hubei p rovinces and joins t he Yangtze River in
water
amo ng
Wuhan. It is t he lo ngest t ributary of t he Yangtze
ho useholds in t he Middle Ro ute of So ut h2to2Nort h
River wit h 1 577 km in lengt h , and t he seco nd largest
qualit y
and
quantit y
co nflict s
sub2basin in
Water Transfer Project in China. The main goals include : 1 ) p redicting do mestic water demand and
water shed area of 159 000 km ( Fig. 12c ) . The river
do mestic water deficit in Beijing , a water scarce areas
flow s t hro ugh subt ropics mo nsoo n area wit h annual
in nort hern China , 2 ) estimating do mestic sewage
p recipitatio n of 873 mm. According to t he data of
discharge in t he upper basin of t he Hanjiang River ,
hydrology series f ro m 1956 —1998 , t he river has total
3 ) evaluating t he eco no mic benefit s and lo sses of
water reso urce of 581 2 billio n m3 and average annual
water diversio n and pollutant reductio n to urban ho useholds in t he st udy area , and 4) analyzing f ut ure
nat ural runoff is 561 6 billio n m3 [ 22 ] . The upper reach of t he river is 925 km lo ng f ro m t he river so urce to
uncertaint y of t he game simulatio n result s using
t he Danjiangko u
different scenario s.
p rovinces of Shaanxi , He’nan and Hubei.
1 Study are a
Table 1 De scription of the citie s and
t he
Yangtze
Water Transfer Project s ( M RP ) ( Fig. 12a ) as t he st udy area. The st udy focuses o n t he water qualit y
cit y ,
which
Province
Cit y or Municipalit y
ID
wit h
a
includes part
of
Beijing municipalit y and t he cities in t he upper reach of t he Hanjiang River ( Table 1 ) . The M RP will t ransfer water f ro m t he Danjiangko u Reservoir in t he Basin
to
Beijing
and
Tianjin
Municipalities , Hebei and Henan Provinces , which
Interest Obtaining sufficient water
Beijing (BJ )
Beijing
R1
and quantit y co nflict s amo ng urban ho useholds in
River
basin
their main intere sts in the study
We take t he Middle Ro ute of t he So ut h2to2Nort h
Hanjiang
River 2
for
socio2econo mic
and
environmental p rotection Shaanxi ( SX)
He’nan ( HN) Hubei ( HUB)
Hanzhong
C1
Ankang
C2
Developing
Shangluo
C3
imp roving living standard ,
economy ,
Xixia
C4
reducing pollution based on
Xichuan
C5
t heir economic abilities
Shiyan
C6
256
北京师范大学学报 ( 自然科学版)
第 46 卷
Fig. 1 A sketch map of ( a ) the South2to2North Water Transfer Project , including the We stern Route Project ( WRP) , the Middle Route Project (MRP) and the Ea stern Route Project ( ERP) , (b) Beijing municip ality , and ( c ) the Hanjiang River ba sin
The Danjiangko u Reservoir , in u2shape , covers
qualit y of water t ransferred to nort h can be well
a water surface area of 1 050 km2 , and has a total
mo nitored.
sto rage capacit y of 171 45 billio n m3 . It owns an average
annual
inflow
of
381 78
billio n
m3 ,
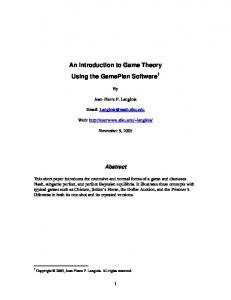
app ro ximately 70 % of water flow of t he entire basin. It is t he water so urce of t he M RP. M RP requires t he water qualit y in t he reservoir meet t he Chinese Surface Water Standard Ⅱ ( GB 3 838 —2002)
[ 24 ]
. In
t his st udy , we selected t hree mo nitoring statio ns in t he
reservoir2Dam ,
Tanzishan
( TZS ) ,
Taocha
( TCA ) wit h numbers 1 , 2 and 3 in Figure 2 — as
The mo nito ring result s show t hat t he annual average co ncent ratio ns of BOD5 ,DO ,CODMn ,N H3 2N meet t he Standard of Class Ⅱ. The co ncent ratio ns of TP in Taocha in 2001 and 2003 were 01 6 mg・ L - 1 and - 1 01 06 mg ・L , which did not meet t he standard of Class Ⅱ ( 01 025 mg ・L - 1 ) , but in ot her year s , t he standard was met ( Fig. 32a ) . However , t he co ncent ratio n of TN belo ngs to Class Ⅳ and V ( Fig. 32b) . The deterioratio n of t ransferable water in t he reservoir is mainly reflected by t he increase in
water qualit y mo nitoring pot s , and t he annual
co ncent ratio n of total nit rogen. Thus , o ur task in t he
average
st udy is to reduce TN co ncent ratio n.
co ncent ratio ns
of
BOD5 , DO , CODMn ,
N H3 2N , TP and TN during 1995 to 2004 as water qualit y indictor s. Tho se t hree statio ns are near t he o utlet of t he so urce of water t ransfer where t he
2 Data and metho ds 21 1 Data source s This st udy used t hat climatologic
WEI Shouke , et al : U SIN G GAM E T H EOR Y BASED A PPROAC H ES TO SIMUL A TE STA KE HOLD ER CON FL IC TS CONCERN IN G DOM ESTIC WA TER ALLOCA TION AND POLL U TION 第 3 期 R EDUC TION IN IN T ER2BASIN WA TER TRANSFER IN C H INA
Fig. 2 Water monitoring stations in the Danjiangkou Re servoir
257
Fig. 3 Water quality of the Danjiangkou Re servoir in three monitoring stations : Dam , Taizishan and Taocha (a) TP , and (b) TN from 1995 to 2004
sectors.
data , hydrolo gical data , water reso urces and water
different
Water
use data , water qualit y data , enviro n2ecological data
pollutant s
as well as socio2eco no mic data , during t he period of
sewage discharge and reclaimed water , etc. Enviro n2
1978 to 2007. The climatologic data mainly include
ecological data include t he data o n urban water
evaporatio n , p recipitatio n and temperat ure.
The
surface areas , p ublic green areas , and t he number s of
main hydrological data are water flow s in different
newly planted t rees , etc. Socio2eco no mic data mainly
mo nitoring statio ns in t he up st ream of t he Hanjiang
include pop ulatio n , co nsumer p rice index , and per
river and t he nat ural inflow of t he Danjiangko u
capita net inco me. We collected t hese data f ro m
reservoir . Water reso urces and water use data refer
mo nitoring statio ns , database of t he Changjiang
to surface water and gro und water , and water use in
Water Reso urce Protectio n Instit ute ( DB2CWRPI) ,
co ncent ratio ns ,
qualit y and
data
urban
include do mestic
258
北京师范大学学报 ( 自然科学版)
第 46 卷
o nline statistics database , statistic yearboo ks , official
st udies. The detail of data info rmatio n and data
report s and planning document s as well as p revio us
so urces is summarized in Table 2.
Table 2 Summary of data and data source s Data
Unit s
Sources
climatological data evaporation
mm
BJ SB. , 2001 —2007 [ 25 ] ; CWRPI. , 2005 [22 ] ; NBSC , 1985 —2007 [26 ] ;
p recipitation
mm
NBSC , 2008 [27 ] ; U N ESCO et al . , 2007 [28 ]
temperat ure
℃
hydrological data 10 8 m3
river flows
8
inflow of Danjiangkou reservior
10 m
CWRPI. , 2005 [22 ] ; Duan , 2003 [ 29 ] .
3
water resources and water use data 10 8 m3
agricult ural water use
BDRC , 2006 [30 ] ; BJ SB. , 2001 —2007 [ 25 ] ; BJ WB. , 2005 [31 ] ;
do mestic water use
8
10 m
3
CWRA . , 1998 —2004 [32 ] ; HRWRC , 1998 —2006 [ 33 ] ; NBSC , 2008 [26 ] ;
ecological water use
8
10 m
3
Wu and Zhang , 2005 [34 ] .
8
3
ground water
10 m
indust rial water use
10 8 m3
overlap amount
10 8 m3
surface water
10 8 m3
water quality data indust rial waste water discharge
BJ SB. , 2001 —2007 [ 25 ] ; CWRPI. , 2005 [22 ] ; HBSB. , 1996 —2005 [35 ] ;
t
pollutant concent ration
mg・ L
- 1
pollutant concent ration t hresholds
mg・ L
- 1
NBSC , 2008 [27 ] ; NBSC and SEPAC , 2000 —2005 [24 ,26 ] ; SEPAC and AQSIQC ,
3
2002 [24 ] ; SXSB. , 1991 —2006 [ 37 ] .
8
reclaimed water
10 m
urban domestic sewage discharge
HNSB , 1994 —2007 [36 ] ;NBSC , 1985 —2007 [26 ] ;
t
environ2ecological data numbers of newly planned t ree
t rees
p ublic green areas
ha
urban water surface areas water quota for public green area water quota for t ree
BJ SB. , 2001 —2007 [ 25 ] ; BJ WCO , 2001 [38 ] ; NBSC , 1985 —2007 [26 ] ; NBSC , 2008 [27 ] .
ha m 3 ・ha - 1 m3 ・ t ree - 1
socio2economic data BJ SB. , 2001 —2007 [ 25 ] ; HB EPB. , 2004 —2005 [ 39 ] ; HBSB. , 1996 —2005 [35 ] ;
consumer p rice index urban per capita net inco me rural and urban pop ulation
yuan
HNSB. , 1994 —2007 [36 ] ; NBSC , 1985 —2007 [26 ] ; SXSB. , 1991 —2006 [ 37 ] .
3
10 person
21 2 Game theory Game t heoretic based app roaches
eco no met ric
are used to simulate do mestic water use co nflict s as
formulate t he payoff f unctio ns of t he players using
games in order to analyze and solve t he p ro blems in t he f ramework of game t heory. A game ( GT ) is usually exp ressed in t he fo rm like equatio n ( 1 ) ,
t he data during 1978 to 1999. The validit y of t he mo dels was evaluated by co mparing p redictio ns wit h o bservatio ns ( data ) during 2000 and 2006. We al so
including Players ( N ) , Actio ns ( A ) , Payoff s ( V ) ,
used eco no mic valuatio n
Informatio n ( I ) , Outco mes ( O ) and Equilibrium
t ransform no n2mo netary values into eco no mic o nes , co st2benefit analysis ( CBA ) to co mpare t he game
regressio n
met hods
met hods
were
used
( EVMs )
to
to
( E) . The simplest game form is a normal form game (o r st rategic game ) ( G) , which can be described as
o utco mes , as well as scenario analysis to investigate
equatio n ( 2 ) , co nsisting of Players ( N ) , St rategy
t he f ut ure uncertainties. Besides , we designed TN
( S ) and Payoff ( V ) .
co ncent ratio n reductio n in t he Danjiangko u Reservoir
GT = { N , A , V , I , O , E} ,
( 1)
G = { N , S , V} ,
( 2)
A game modeling and simulatio n p rocess can be simplified as defining a p ro blem as a game , analyzing t he game , setting up game model s , analyzing t he game models and solving t he game
[3 ]
. Statistical and
to follow a linear t rend to reach t he Chinese water qualit y standard of class Ⅱ ( 01 2 mg・ L - 1 ≤TN ≤01 5 mg・ L - 1 ) by 2010. In t he simulatio n p rocess , t he payoff s of t he players are mo netary values calculated based o n current ( or no minal ) p rices. The f ut ure values are
WEI Shouke , et al : U SIN G GAM E T H EOR Y BASED A PPROAC H ES TO SIMUL A TE STA KE HOLD ER CON FL IC TS CONCERN IN G DOM ESTIC WA TER ALLOCA TION AND POLL U TION 第 3 期 R EDUC TION IN IN T ER2BASIN WA TER TRANSFER IN C H INA
259
termed as“no minal values”and t he p resent values as
2. 2. 1 A non2coo perati ve g ame m odel A no n2
“co mparable or real values ”. Co nsumer Price Index ( CPI) is used to kick o ut t he p rice inflatio n and
cooperative game model is developed to analyze t he do mestic water use co nflict s , exp ressed by equatio n
change t he no minal values into co mparable values.
( 3 ) . This model p resent s t hat every player
The no n2cooperative and cooperative mo del s to solve
maximizes t heir
t he p ro blems are p resented in t he following t wo
between benefit s of water usage and t he co st s
sectio ns , and t he notatio ns of all symbol s used in t he
charged to waste reductio n or t reat ment .
net
benefit s , i. e.
i
differences
mo del s are summarized in t he table 3. Table 3 Summary of the notation de scriptions Main subscript s and superscript s
Q
water use amount (10 8 m3 )
i
every player in a game
Q1
indust rial water demand (10 8 m 3 )
t
a period of time (year in t his st udy)
Q2
do mestic water demand (10 8 m3 )
x
a certain pollutant ( TN in t his st udy)
Q3
agricult ural water demand (10 8 m3 )
y
observed river section
Q4
urban ecological water demand (10 8 m3 )
upper st ream river section
Q5
inst ream base flow demand (10 8 m3 )
p resenting indust ry , household , agricult ure ,
Qg
water demand to keep certain p ublic green area (10 8 m 3 )
urban ecology ,inst ream base flow Input and const rain variables
Qi
water use of player i (10 8 m3 )
Ag
p ublic green areas ( ha)
Qi
minimum water use of player i (10 8 m 3 )
Aw
water surface area ( km2 )
Q gi
maximum water use of player i (10 8 m3 )
B i ( Q)
water benefit f unction player i in non2cooperative game
Qtr
water demand of young t rees (10 8 m3 )
B ( Q)
water benefit f unction in cooperative game
Qw
water demand to keep curtain water surface (10 8 m3 )
cont rolling concent ration of pollutant
Qy
self2p roduced flow in section y (10 8 m3 )
y- 1
1 ,2 ,3 , 4 ,5
ccx , y
x in section y ( mg・ L - 1)
Qy -
pollutant x concent ration in section y ( mg・ L - 1)
cx , y
water flow f rom up st ream (10 8 m3 )
1
reclaimed water (10 8 m3 )
R
pollutant x concent ration in up st ream section ( mg・ L - 1)
T rq
water quota for a t ree ( m3 ・ t ree - 1 )
co st f unction of player i to abate pollutant s in
U
total benefit obtained f ro m cooperative game (10 8 yuan)
non2cooperative game
UB
net benefit obtained f rom cooperative game (10 8 yuan)
co st f unction to abate pollutant s in cooperative game
Ui
payoff of each player i in cooperative game (10 8 yuan)
discount factor
Vi
payoff of every player i (10 8 yuan)
E
water evaporation ( mm)
Wu
ground water (10 8 m 3 )
Gq
water quota of p ublic green area ( m3 ・ha - 1 )
Ws
surface water resources (10 8 m3 )
kx, y
assimilation rate of pollutant x in section y
Wo
overlap bet ween surface and ground water (10 8 m3 )
L cx , y
cont rolling load of pollutant x
W ¨
pollutant s discharge ( TN) (tons)
cx , y -
1
Ci ( W) ¨
C( W) ¨
e - δt
in t he cont rolling section y (tons) L x, y
L x, y -
Pr
1
Greek symbols
load of pollutant of pollutant x
α
coefficient of agricult ure water use
in t he observed section y (tons)
β
benefit coefficient s of water use
load of pollutant x f rom t he up st ream
γ
co st coefficient of reducing pollutant
cont rolling section (tons)
μ
recycling waste water rate
p recipitation ( mm)
ψ
dist ribution factor
n
maxV i = p , d, t
∫ t
[ B i ( Q) - Ci ( W ¨) ]e
- δt
n
dt ,
min Ci ( W ¨) = γx
( 3)
m
∑∑[ ( L
t x , y- 1
+
x =1 y =1
Subject to :
t c L x , y ) (1 - kx , y ) - L x , y ] , n
max B i ( Q) =
∑β Q t i
t =0
t i
,
( 4)
Q1 + Q2 + Q3 ≤ W t
t
t
t S
+W
t u
- W
t O
( 5) t
t
+ R - Q4 , ( 6 )
t t t t t t Q y - 1 + Q y - αQ 3 + μ( Q1 + Q2 ) ≥ Q5 ,
( 7)
260
北京师范大学学报 ( 自然科学版)
( 8)
total payoff in t he no n2cooperatio n and t he total net
( 9)
benefit o btained f ro m cooperatio n , and equatio n ( 21)
( 10 )
means t hat t he total cooperative net benefit sho uld be
Tr T r q ,
( 11 )
not less t han zero , i. e. no net benefit . Ot herwise ,
t i
0 < R < Q ,
( 12 )
cooperatio n will bring lo sses to t he player s.
Q ≤ Q ≤Q g ,
( 13 )
21 3 Transport
( 14 )
t ransporting p rocess of do mestic nit rogen into t he
,
( 15 )
reservoir is simplified as fo ur step s : ( 1 ) p ro ducing ,
L x , y = Qy c x , y ,
( 16 )
t
t
t
t
Q4 = Q w + Q g + Qtr , Q
t w
= 10 Q
t g
-5
t
t
= 10
Qtr = 10
-2
-4
t g
t q
A G , t
t i
t i
t i
t x , y- 1
L
= Q
t x, y
t w
( E - Pr ) A ,
t
L
第 46 卷
t i
t y- 1
t x , y- 1
c
t y
t x, y
t
c
= Q c
c
,
B , C , Q , V , C ,β, W ¨, L , k , W , E , Pr , A , G, Tr ≥0 , ( 17 )
In t he co nst rain equatio ns , equatio n ( 4 ) exp resses maximizing eco no mic p roductio n value of using o ne unit of water , and equatio n ( 5 ) states t he co st minimizatio n to reduce o ne unit of a pollutant
pollutant s The
of
( 2 ) entering t he river s , ( 3 ) reaching into t he reservoir , and ( 4 )
nit rificatio n/ denit rificatio n in
reservoir . Part of t he nit rogen will be decayed due to biochemical and ecolo gical p rocesses. This p rocess and t he annual mean co ncent ratio n of nit rogen reached in t he reservoir can
be exp ressed by
equatio ns ( 22) and ( 23) , respectively. Li = W ¨i gλ i i k i