watershed has been sighted by the Illinois EPA for excessive sediment and nutrient loadings and ..... Addison-Wesley Publishing Co., Inc., Reading, MA.
Using Genetic Algorithms and SWAT to Minimize Sediment Yield
From an Agriculturally Dominated Watershed
Misgana K. Muleta
John W. Nicklow
Abstract Non-point source pollution is well recognized as one of the most critical environmental hazards of modern times. In Illinois, non-point source pollution is the major cause of water quality problems, and soil erosion from agricultural lands is the major source of such pollution. Accelerated by anthropogenic activities, soil erosion reduces crop productivity and leads to subsequent problems from deposition on farmlands and in water bodies. Watershed management, however, promotes protection and restoration of these natural resources while allowing for sustainable economic growth and development. In this study a discrete time optimal control methodology and computational model are developed for determining land use and management alternatives that minimize sediment yield from agriculturally dominated watersheds. The methodology is based on an interface between a genetic algorithm and a U.S. Department of Agriculture watershed model known as Soil and Water Assessment Tool (SWAT). The original structure of the SWAT model is preserved and modifications are embedded for computational efficiency. The analysis is based on a farm field level to capture the perspectives of different stakeholders. The model thus supports Illinois EPA’s plan of developing a program based on enabling and empowering local stakeholders to take charge of the fate of their watershed. Management alternatives available for all land uses modeled by SWAT are developed considering rotation patterns of three years. The decision support tool is applied to Big Creek sub-watershed in the Cache River watershed, located in Southern Illinois. Big Creek subwatershed has been sighted by the Illinois EPA for excessive sediment and nutrient loadings and has been targeted by the Illinois Pilot Watershed Program. This research is part of an ongoing effort to develop a comprehensive decision support tool that uses multi-criteria evaluation to address social, economic and hydrologic issues for integrative watershed management. Introduction Runoff from rainfall or snowmelt moves over and through the soil, picking up and transporting natural and anthropogenic pollutants. These pollutants are ultimately deposited into fresh water bodies including rivers, lakes, wetlands and underlying groundwater. These types of Non-Point Source (NPS) pollutants are the primary source of water quality impairment in the U.S. As of 1996, agriculture is listed as a source of pollution for 70% of the impaired river miles
surveyed in the nation (USEPA, 2000a). In Illinois, NPS pollution is the largest contributor to waters that fail to meet water quality goals. The major causes of the water quality problem are specifically nutrients and siltation resulting from erosion of agricultural land (ILEPA, 1996). Soil erosion, however, is not only limited to offsite effects such as deteriorating fresh water quality. In the long term, it threatens productive capacity of agricultural lands due to loss of topsoil and nutrients. These impacts on water bodies and associated threats to agricultural production can be minimized by properly managing activities that cause NPS pollution. Numerous government programs are available to assist in the design and payment of watershed management approaches to prevent and control NPS pollution. For example, over 40 percent of Section 319 Clean Water Act (CWA) grants were used to control agricultural NPS pollution. Also, several U.S. Department of Agriculture and state-funded programs provide costshare, technical assistance, and economic incentives such as the Conservation Reserve Program (CRP) to implement NPS pollution management practices (USEPA, 2000b). As mandated by CWA, the United States Environmental Protection Agency (USEPA) required states to submit proposed Total Maximum Daily Load (TMDL) regulations after identifying the water bodies and pollutants to which TMDLs would apply. Accordingly, the Illinois Environmental protection Agency (ILEPA) has completed a draft of its 303(d) list documenting those water bodies in Illinois in need of TMDL implementation plans. NPS pollution of water bodies included on the list should be reduced to a level less than TMDL, perhaps by changing land use patterns. This has a direct impact on the farmers/land owners whose objectives vary widely and are often conflicting. This problem calls for an integrative solution approach that accounts for basin-wide hydrologic, economic and social dynamics that affect a water body and requires willingness and active involvement of farmers and other landowners in the watershed. It becomes important, therefore, to provide decision makers with tools and a methodology that will allow them to combine hydrologic and socio-economic processes. The effectiveness of decisions aimed towards preventing negative impacts of NPS, particularly from soil erosion on a complex landscape, is very sensitive to capability of the hydrologic model used in predicting erosion and sedimentation for proposed land-use alternatives. Fortunately, advances in GIS technology have stimulated the replacement of traditional lumped, empirical models by process-based, distributed models such as SHE (Abbott, et al., 1986), AGNPS (Young, et al., 1987), ANSWERS-2000 (Bouraoui and Dillaha, 1996) and SWAT (Arnold et al., 1998). These models can capture the spatial and temporal heterogeneity of environmental factors such as soil, land use, topography and climate variables, thus making their resulting estimates more accurate. A comprehensive decision-making framework, however, requires not only a comprehensive hydrologic simulation model that evaluates what if scenarios, but also an operations research technique that is capable of solving complex control problems. An interface between simulation models and an optimization algorithm, defined as a discrete time optimal control methodology, allows the direct determination of optimal landscapes that minimize pollution from NPS. There have been few applications of this technique to comprehensive watershed management. Sengupta et al, (2000), developed a spatial decision support system that evaluates the effect of proposed watershed conservation policies by linking Agricultural Non-Point Source Pollution (AGNPS) and a linear programming model known as GEOLP. GEOLP was an enhanced version of an economic farm model developed by Kraft and Toolhill (1984). In this paper, we present an optimal control methodology that directly locates the land use pattern that minimizes sediment yield from a watershed. The methodology is
developed by integrating a physically-based, distributed hydrologic model known as Soil and Water Assessment Tool (SWAT) and an evolutionary optimization technique known as genetic algorithms (GAs). Its application is demonstrated using the Big Creek watershed, a watershed placed on 303(d) list by ILEPA because of its excessive sediment yield. Genetic Algorithms GAs, developed by Holland (1975), are a stochastic search technique that uses the mechanism of natural selection to search a wide portion of a solution space. The objective function magnitude, instead of derivative information, is used directly in the search, thus allowing GAs to be applied to non-convex, highly non-linear, and complex problems (Goldberg, 1989). GAs have been shown to be valuable tools in a broad spectrum of fields, including the field of water resources. For example, there have been successful applications of GAS in the management of groundwater (Nishikawa 1998; Hilton and Culver 2000), water supply (Savic and Walters 1997; Ries et al, 1997) and highway drainage (Hellman and Nicklow, 2000). GAs consist of three basic operations: (1) selection, (2) crossover, or mating, and (3) mutation. In application of GAs, several sets of decision alternatives, also called chromosomes, are formed. Each alternative is made up of a series of particular decision parameters, called genes. The alternatives are evaluated and ranked according to their performance, or fitness, with respect to an objective function. The alternatives then compete in a selection game, where alternatives with high fitness values enter the mating population and those with low fitness values are killed off and replaced by new alternatives generated from the surviving alternatives. The surviving alternatives are randomly assigned a mating partner from within the mating population. A random crossover location(s) within the genes of two partnering alternatives is selected and genetic information is exchanged between the two parent strings to form two new alternatives, or children. There are different mechanisms of choosing mates and selecting crossover locations. Additional detail can be found in Haupt et al. (1998). GAs are an aggressive search technique and might quickly converge to a local optimum if the only operations included were selection and crossover. This is because GAs rapidly eliminate alternatives with poor fitness values until all the alternatives of the population are identical and in doing so may lose some important genetic information. Therefore, in order to maintain some diversity in the solution population, some of the alternatives’ genes are randomly mutated with a probability of Pmut, to keep a population from converging too quickly. The processes of ranking according to fitness values, crossover and mutation are repeated for many generations in hopes of improving the performance of the population. The general concept behind this process is that alternatives with high fitness values contain specific genes that are important to optimizing the objective function. By exchanging important genes between two parent alternatives, it is hoped that the GAs produce children that contain even more superior characteristics than their parent alternatives. In this way, GAs make use of Darwin’s “survival of the fittest” theory to search a decision space for an optimal solution. Description of SWAT An increasing demand for mathematical models which can predict the hydrologic effects of natural and man-made changes to land use and climate, together with the evolution of
Geographical Information System (GIS) technology and the development of increasingly powerful computers, has in recent years stimulated development of physically-based, distributed watershed models. Such models are thought to have advantage over black box and lumped routing models through their use of spatially distributed parameters, which have a physical-based significance. SWAT, a U.S. Department of Agriculture model, is a process based, distributed, continuous time model developed to assist water resource managers in assessing water supplies and NPS pollution on watersheds and large river basins (ASCE, 1999). A detailed description of SWAT model is given in Arnold et al. (1998). SWAT operates on daily time step and allows a watershed to be subdivided into natural subwatersheds or grid cells. The subwatersheds can be further subdivided in to Hydrologic Response Units (HRU), defined by a unique combination of land use and soil type heterogeneity. All factors such as soil, land use and climate are considered homogeneous on a scale of HRU. The model simulates major hydrologic components and their interactions as simply and yet realistically as possible (Arnold and Allen, 1996). The model uses inputs that are readily available over large areas so that the model can be used in routine planning and decision-making. The model input components can be divided into the following categories: hydrology, weather, sedimentation, soil temperature, crop growth, nutrients, pesticides and agricultural management. Hydrologic processes that are simulated include surface runoff, estimated using the SCS curve number or Green Ampt infiltration equation; percolation, modeled with a layered storage routing technique combined with a crack flow model; lateral subsurface flow; groundwater flow to streams from shallow aquifers; potential evapotranspiration by the Hargreaves, PriestleyTaylor and Penman-Monteith methods; snow melt; and, transmission losses from ponds. Weather variables that drive the hydrologic model include daily preciptation, maximum and minimum air temperature, solar radiation, wind speed and relative humidity. For watersheds lacking measured weather data, a stochastic weather generator can be used for all or several variables based on monthly climate statistics that are calculated from long-term measured data from of a weather station that is geographically located near the watershed. Different weather data can be associated with specific subbasins depending on data availability. Sediment yield is computed for each HRU with the Modified Universal Soil Loss Equation (MUSLE). While the Universal Soil Loss Equation (USLE) uses rainfall as an indicator of erosive energy, MUSLE uses the amount of runoff to simulate erosion and sediment yield. The substitution results in a number of benefits: the prediction accuracy of the model is increased; the need for a delivery ratio is eliminated; and, single storm estimates of sediment yields can be calculated. Crop growth is simulated with a daily time step and crop management factor values in the MUSLE are calculated for all days when runoff occurs, thus accounting for stage of crop growth and adding to accuracy of model results. Using crop-specific input parameters that are included in the model as a database, one can simulate different annual and perennial crops. Agricultural management practices include tillage effects, planting and harvesting dates of crops, fertilizer and pesticide types, application dates and dosages and cropping sequences. The model can also predict crop yield and account for yield reduction that may arise due to stresses such as the lack of sufficient precipitation and/or fertilizer. Finally, SWAT is interfaced with Arcview GIS to assist the user in the generation of model input parameters, the execution of simulations, and the viewing of graphical and tabular outputs. These capabilities make SWAT a comprehensive tool for assessing both environmental and economic effects of alternative land management practices.
Solution Methodology As previously described, SWAT computes sediment yield from each HRU using the MUSLE, which is given as (Arnold et al, 1999): Y = 11.8V (q p ) 0.56 KCP(LS)
(1)
where Y is the sediment yield from the HRU in tons, V is the surface runoff column for the HRU in m3, qp is the peak flow rate for the HRU in m3s-1, K is the soil erodibility factor, C is the crop management factor, P is the erosion control factor, and LS is the slope length and steepness factor. The crop management factor C accounts for crop rotations, tillage methods, crop residue treatments and other cultural practice variables (Yang, 1996). A quick observation of the MUSLE reveals a range of possibilities one may adapt to reduce erosion and sedimentation from watersheds. These include: minimizing erosive potential of rainfall using various ground covers, using a tillage practice that causes less soil disturbance, cutting long steep land slopes by constructing terraces and check dams, and proper choice of land use and management practices. Land use and tillage practices play a very significant role in reducing erosive power of rainfall, binding the soil and reducing soil erodibility, and retarding transport of eroded soil by increasing roughness coefficients. A discrete time optimal control methodology, that interfaces SWAT and a GA, can be used to solve this problem and determine land use sequences and tillage practices that minimize sediment yield. The current objective function can be formulated as: Minimize:
Sediment yield from each farm field in a watershed
Subject To:
(i) Hydraulic and hydrologic relationships that govern erosion and … and sedimentation processes (ii) Crop management constraints (e.g. crop season and sequence)
Although the current objective function focuses only on sediment yield, this work is a part of an ongoing project that attempts to develop a multi-objective decision support system, considering both hydrologic and socio-economic aspects. The methodology assumes that each HRU is farm field that is commonly owned by a single farmer or landowner. Under this assumption, a particular landowner’s decision concerning land use sequencing and tillage types will have no influence on neighboring landowners and their farm fields. Expressed differently, the methodology allows every landowner within the watershed to make his/her own decision, but contributes towards the overall goal of minimizing sediment yield to the receiving water body from the watershed. This approach supports ILEPA’s recognition that watershed planning and management should be the responsibility of farmers and other landowners who have ownership rights within the watershed. Their land use choices directly affect their personal income and affect their shared responsibility to maintain environmental quality. Effective decision making in such cases should recognize these different stakeholder perspectives.
Farm management decisions are not just based on single-year profit of a farmer, but also multi-year criteria such as crop rotation. Here, it was assumed that a farm management policy dictates the seasonal sequence of crops to be grown on an individual farm field for a three-year horizon. In the decision process, only field crops are considered and a maximum of two crops per year are allowed to grow. The second crop of the year is planted only after the preceding crop is harvested. Planting and harvesting dates of crops are assumed to be within the dates recommended for the crop in the watershed of study, and a crop year is assumed to commence in January. Within the three-year rotation, a maximum of five crops can be grown. The first crop planted in the three-year period is a warm season crop and is harvested in late September. Then a winter crop is planted in early October and is harvested in June. Next, using a double cropping system, warm season crops, such as soybean, that can grow following harvest of winter crops are planted. The fourth crop is a warm season crop that is planted in March or April, and finally the fifth and the last crop of the sequence is a winter crop. Once planted, perennial crops such as hay and pasture are allowed to remain on the field until the end of the three-year plan. Within the solution methodology, a gene represents a land cover and tillage practice combination. The GA is coded such that a single alternative consists of five genes, which are the sequence of land covers to be grown in the three-year period, along with the tillage types to be used for each land use in the sequence. As shown in Table 1, each land use and tillage type combination is given a code that is an integer value Table 1. Typical Crop Types and Tillage
Practice Combinations and Corresponding Integer Codes
Integer Crop type Tillage Type Acronym Code Soybean No tillage SYNT 1 Corn No tillage CRNT 4 Sunflower Conventional tillage SFCT 10 Wheat Fall tillage WWFT 17 Wheat No tillage WWNT 15 Silage Spring tillage SLST 14 Alfalfa Conventional tillage AFCT 28 Ray Conventional tillage RYCT 25 The GA begins with hundreds of randomly chosen alternatives, or chromosomes, each with five genes (see Table 2). Each chromosome is sent to SWAT for evaluation of sediment yield that results from implementation of the alternative for an HRU. The resulting sediment yield represents a three-year average from the farm field. The GA then uses the results from SWAT in application of the three genetic operators: ranking and selection according to fitness value, crossover, and mutation. The cyclic process of chromosome generation, evaluation, and genetic operations is repeated for a number of user-specified generations. In this research, tournament selection and uniform crossover is used for mate selection and crossover, respectively. A flow chart that describes the logical flow of the methodology is presented in Figure 1.
Chromosomes
1 2
Table 2. Typical Alternatives Crop 4 Crop 3 Crop 2 Crop 1 Warm or Warm or Winter Warm Perennial Perennial Crop Season Season Crop 14 15 28 28 (SLST) (WWNT) (AFCT) (AFCT) 10 17 1 4 (SFCT) (WWFT) (SYNT) (CRNT)
Crop 5 Winter or Perennial Season 28 (AFCT) 25 (RYCT)
Randomly choose sets of land management alternatives
Send alternatives to SWAT for evaluation of sediment yield
Evaluate fitness values for each management alternative
Choose mates among alternatives with higher fitness values and crossover to create children
Repeat for a number of generations
Randomly choose genes and mutate alternatives according to user-defined frequency; Call SWAT to evaluate sediment yield for the children and mutated alternatives
If the convergence criterion is satisfied, report the best alternative
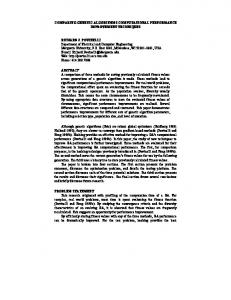
Figure 1. Logical Flow of the Optimal Control Methodology Application to Big Creek Watershed Big creek watershed is located in Southern Illinois and is a part of the Cache River basin. Big Creek has been sighted by the ILEPA for excessive sediment and nutrient loading and is targeted for extensive study. The same watershed has also been designated as an Illinois pilot
watershed through cooperation among the Illinois Department of Natural Resources (IDNR), the Illinois Department of Agriculture, ILEPA, and the U.S. Natural Resources Conservation Service (IDNR, 1998). A 30-meter resolution United States Geological Survey (USGS) digital Elevation Model (DEM), IDNR land use map, and soils map have been obtained for the region being studied. The 130 km2 Big Creek watershed was delineated from the DEM using the SWAT-Arcview simulation model, and then was subdivided in to 129 subbasins that varied in size between 0.29 km2 and 4 km2. The land use map and soils map were superimposed over the subdivided watershed to obtain HRUs. Dominant soils types and land uses were used in establishing HRUs, which implies an assumption that each farm field consists of a single soil type and land cover during any one season. Daily precipitation, daily maximum temperature and daily minimum temperature data from 1950-1999 were obtained from the National Weather Service for Anna, a station located near the watershed. A database on scheduled management practices was prepared for crops grown in the watersheds. This database contains information on planting dates, harvesting date, dates to apply tillage, fertilizer and pesticide type, application dates and dosages, and heat units required for a plant to reach maturity. The optimal control model was applied using inputs collected for Big Creek watershed and executed for initial population of alternatives equal to 500, 50 generations and a mutation rate of 15 percent. Search results for one particular 67.18-ha HRU are presented in the convergence plot shown in Figure 2. For this HRU, the minimum sediment yield found from the 500 alternatives is 123.68 metric tons/year (1.84 metric tons/ha/year) at the first generation, but is significantly reduced to 88.03 metric tons/year (1.31 metric tons/ha/year) at the 50th generation.
Minimum Sediment Yield (metric tons/yr)
130 120 110 100 90 80 0
10
20
30
40
Generation Number
Figure 2. Minimum Generation-Based Sediment Yield
50
Soils in the Cache river basin have soil tolerance (T) values varying from 6.7 to 11.2 metric tons/ha/year, and average sediment yield from the lower Cache River basin after application of CRP, which reduced erosion from the basin by 49% between 1987 and 1995, was 8.92 metric tons/ha/year (USDA, 1995). T values indicate a maximum average annual erosion rate consistent with sustaining the soils long-term productivity. Yield from the field associated with Figure 2 is well below the minimum T set for soils in the watershed, and when compared to the 1995 average yield, there is 85% reduction. The maximum allowable sediment yield from each field, however, should satisfy not only T values but also TMDL criteria for sustainability of the receiving water bodies. Conclusion A preliminary application of the optimal control methodology to Big Creek watershed has showed promising results in its capability of minimizing NPS that results from erosion and sedimentation. The methodology attempts to integrate perspectives of stakeholders and policy makers in developing a watershed management and planning decision. This enhances the validity and trust of the results by farmers and landowners in the watershed of interest. Future work will integrate socio-economic issues into the methodology in order to create a decision support tool that may potentially play a significant role in the TMDL process. References Cited Abbott, M.B, Bathurst, J.C., Cunge, J.A., O’Connell, P.E. and Rasmussen, J. (1986). “An introduction to the European Hydrological System-System Hydrologique Europeen, “SHE”,2: Structure of a physically-based, distributed modeling system.” J. of Hydrology, 87: 61-77. Arnold ,J.G., Srinivasan, R., Muttah, R.S., Williams, J.R. (1998). “Large area hydrologic modeling and assessment part I: Model development.” J. American Water Resour. Assoc., 34(1):73-89. Arnold ,J.G., Williams, J.R., Srinivasan, R., King, K.W. (1999). SWAT: Soil and Water Assessment Tool. USDA, Agricultural Research Service, Temple, TX. Arnold, J.G and Allen, P.M. (1996). “Estimating hydrologic budgets for three Illinois watersheds.” J. of Hydrology, 176:55-77. ASCE (1999). GIS Modules and Distributed Models of Watersheds. American Society of Civil Engineers, Reston, VA. Bouraoui F. and Dillaha, T.A. (1996). “ANSWERS-2000: Runoff and sediment transport model.” J. of Environ. Engineering, 122(6), 493-502. Goldberg, D.E. (1989). Genetic Algorithms in Search, optimization and Machine Learning. Addison-Wesley Publishing Co., Inc., Reading, MA. Haupt R.L. and Haupt S.E. Practical Genetic Algorithms. (1998). John Wiley & Sons, Inc., New York.
Hellman, A. P. and Nicklow, J.W. (2000). “Optimizing hydraulic design of highway drainage systems.” Proceedings of the 2000 Joint Conference on Water Resources Engineering and Water Resources Planning and Management (ASCE). Minneapolis, MN, July 30-August 2. Hilton, A.B. and Culver, T.B. (2000). “Constraint handling for genetic algorithms in optimal remediation design.” J. Water Resour. Plng. and Mgmt, ASCE, 126(3): 128-137. Holland, J.H. (1975). Adaptation in Natural and Artificial Systems. University of Michigan Press, Ann Bohr, MI. IDNR (1998). The Pilot Watershed Program: Watershed Management, Monitoring and Assessment. Illinois Department of Natural Resources, Springfield, IL. ILEPA (1996). The Condition of Illinois Water Resources, 1972-1996. Illinois Environmental Protection Agency. Available Online: Kraft, S.E. and Toolhill, T. (1984). “Soil degradation and land use changes: Agro-ecological data acquired through representative farm and linear programming analysis.” J. of Soil and Water Conservation, 40: 65-67. Nishikawa, T. (1998). “Water resources optimization model for Santa Barbara, California.” J. Water Resour. Plng. and Mgmt, ASCE, 124(5): 252-263. Ries, L.F.R., Porto, R.M. and Chaudhry, F.H. (1997). “Optimal location of control valves in pipe networks by genetic algorithm.” J. Water Resour. Plng. and Mgmt, ASCE, 123(6): 317-326. Savic, D.A. and Walters, G.A. (1997). “Genetic algorithms for least-cost design of water distribution networks.” J. Water Resour. Plng. and Mgmt, ASCE, 123(2): 67-77. Sengupta, R., Bennett, D.A., Beaulieu, J. and Kraft, S.E. (2000). “Evaluating the impact of policy-induced land use management practices on non-point source pollution using a spatial decision support system.” Water International, 25(3):437-445. USDA (1995). Cache River Basin Erosion and Sedimentation Report. U.S. Department of Agriculture and U.S. Natural Resources Conservation Service. USEPA (2000a). Managing Non-point Source Pollution from Agriculture. U.S. Environmental Protection Agency. Available Online: USEPA (2000b). National Management Measures to Control Non-Point Source Pollution from Agriculture. U.S. Environmental Protection Agency, Raleigh, NC. Yang, C.T. (1996). Sediment Transport Theory and Practice. McGraw-Hill, New York. Young, R.A., Onstad, C.A., Bosch, D.D. and Anderson, W.P. (1987). “AGNPS: A non-point source pollution model for evaluating agricultural watersheds.” J. of Soil and water Conservation, 44(2): 168-173. Acknowledgements The authors wish to thank the Illinois Council for Food and Agricultural Research (CFAR), which has provided support for this ongoing research effort.