Optimization in an Educational Web-based System. Behrouz Minaei-Bidgoli1 ... 2340 Engineering Building. East Lansing, MI 48824 ..... We used the simple genetic algorithm (SGA), which is described by Goldberg in. [9]. The SGA uses ...
Using Genetic Algorithms for Data Mining Optimization in an Educational Web-based System Behrouz Minaei-Bidgoli1, William F. Punch III 1 1
Genetic Algorithms Research and Applications Group (GARAGe) Department of Computer Science & Engineering Michigan State University 2340 Engineering Building East Lansing, MI 48824 {minaeibi, punch}@cse.msu.edu http://garage.cse.msu.edu
Abstract. This paper presents an approach for classifying students in order to predict their final grade based on features extracted from logged data in an education web-based system. A combination of multiple classifiers leads to a significant improvement in classification performance. Through weighting the feature vectors using a Genetic Algorithm we can optimize the prediction accuracy and get a marked improvement over raw classification. It further shows that when the number of features is few; feature weighting is works better than just feature selection.
1 Statement of problem Many leading educational institutions are working to establish an online teaching and learning presence. Several systems with different capabilities and approaches have been developed to deliver online education in an academic setting. In particular, Michigan State University (MSU) has pioneered some of these systems to provide an infrastructure for online instruction. The research presented here was performed on a part of the latest online educational system developed at MSU, the Learning Online Network with Computer-Assisted Personalized Approach (LON-CAPA). In LON-CAPA1, we are involved with two kinds of large data sets: 1) educational resources such as web pages, demonstrations, simulations, and individualized problems designed for use on homework assignments, quizzes, and examinations; and 2) information about users who create, modify, assess, or use these resources. In other words, we have two ever-growing pools of data. We have been studying data mining methods for extracting useful knowledge from these large databases of students using online educational resources and their re1
See http://www.lon-capa.org
corded paths through the web of educational resources. In this study, we aim to answer the following two research questions: 1) Can we find classes of students? In other words, do there exist groups of students who use these online resources in a similar way? If so, can we identify that class for any individual student? With this information, can we help a student use the resources better, based on the usage of the resource by other students in their groups? 2) Can we classify the problems that have been used by students? If so, can we show how different types of problems impact students’ achievements? Can we help instructors to develop the homework more effectively and efficiently? We hope to find similar patterns of use in the data gathered from LON-CAPA, and eventually be able to make predictions as to the most-beneficial course of studies for each learner based on their present usage. The system could then make suggestions to the learner as to how to best proceed.
2 Map the problem to Genetic Algorithm Genetic Algorithms have been shown to be an effective tool to use in data mining and pattern recognition. [7], [10], [6], [16], [15], [13], [4]. An important aspect of GAs in a learning context is their use in pattern recognition. There are two different approaches to applying GA in pattern recognition: 1. Apply a GA directly as a classifier. Bandyopadhyay and Murthy in [3] applied GA to find the decision boundary in N dimensional feature space. 2. Use a GA as an optimization tool for resetting the parameters in other classifiers. Most applications of GAs in pattern recognition optimize some parameters in the classification process. Many researchers have used GAs in feature selection [2], [9], [21], [12], [18]. GAs has been applied to find an optimal set of feature weights that improve classification accuracy. First, a traditional feature extraction method such as Principal Component Analysis (PCA) is applied, and then a classifier such as k-NN is used to calculate the fitness function for GA [17], [19]. Combination of classifiers is another area that GAs have been used to optimize. Kuncheva and Jain in [11] used a GA for selecting the features as well as selecting the types of individual classifiers in their design of a Classifier Fusion System. GA is also used in selecting the prototypes in the case-based classification [20]. In this paper we will focus on the second approach and use a GA to optimize a combination of classifiers. Our objective is to predict the students’ final grades based on their web-use features, which are extracted from the homework data. We design, implement, and evaluate a series of pattern classifiers with various parameters in order to compare their performance on a dataset from LON-CAPA. Error rates for the individual classifiers, their combination and the GA optimized combination are presented.
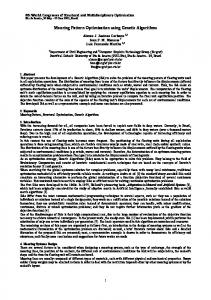
2.1 Dataset and Class Labels As test data we selected the student and course data of a LON-CAPA course, PHY183 (Physics for Scientists and Engineers I), which was held at MSU in spring semester 2002. This course integrated 12 homework sets including 184 problems, all of which are online. About 261 students used LON-CAPA for this course. Some of students dropped the course after doing a couple of homework sets, so they do not have any final grades. After removing those students, there remained 227 valid samples. The grade distribution of the students is shown in Fig 1. Fig. 1. Graph of distribution of grades in course PHY183 SS02 Grade Distribution 4.0 3.5
Grade
3.0 2.5 2.0 1.5 1.0 0.0 0
10
20
30
40
50
60
# of students
We can group the students regarding their final grades in several ways, 3 of which are: 1. Let the 9 possible class labels be the same as students’ grades, as shown in table 1 2. We can label the students in relation to their grades and group them into three classes, “high” representing grades from 3.5 to 4.0, “middle” representing grades from 2.5 to 3, and “low” representing grades less than 2.5. 3. We can also categorize the students with one of two class labels: “Passed” for grades higher than 2.0, and ”Failed” for grades less than or equal to 2.0, as shown in table 3. Table 1. Selecting 9 class labels regarding to students’ grades in course PHY183 SS02 1 2 3 4 5 6 7 8 9
Grade = 0.0 Grade = 0.5 Grade = 1.0 Grade = 1.5 Grade = 2.0 Grade = 2.5 Grade = 3.0 Grade = 3.5 Grade = 4.0
2 0 10 28 23 43 52 41 28
0.9% 0.0% 4.4% 12.4% 10.1% 18.9% 22.9% 18.0% 12.4%
Table 2. Selecting 3 class labels regarding to students’ grades in course PHY183 SS02 High Middle Low
Grade >= 3.5 2.0 < Grade < 3.5 Grade 2.0 Grade