The International Archives of the Photogrammetry, Remote Sensing and Spatial Information Sciences, Volume XLI-B2, 2016 XXIII ISPRS Congress, 12–19 July 2016, Prague, Czech Republic
Using geo-targeted social media data to detect outdoor air pollution
W. Jianga, Y. Wanga*, M.H. Tsoub, X. Fua a
State Key Laboratory of Information Engineer in Surveying, Mapping and Remote Sensing, Wuhan University, Wuhan, Hubei, China –
[email protected] (WJ);
[email protected] (YW);
[email protected] (XF) b Department of Geography, San Diego State University, San Diego, California, United States of America –
[email protected] (MHT); Theme Sessions, ThS 12 Corresponding author: Y. Wang
KEY WORDS: Social media, Outdoor air pollution, Spatiotemporal relationship, Machine learning
Outdoor air pollution has become a more and more serious issue over recent years (He, 2014). Urban air quality is measured at air monitoring stations. Building air monitoring stations requires land, incurs costs and entails skilled technicians to maintain a station. Many countries do not have any monitoring stations and even lack any means to monitor air quality. Recent years, the social media could be used to monitor air quality dynamically (Wang, 2015; Mei, 2014). However, no studies have investigated the inter-correlations between realspace and cyberspace by examining variation in micro-blogging behaviors relative to changes in daily air quality. Thus, existing methods of monitoring AQI using micro-blogging data shows a high degree of error between real AQI and air quality as inferred from social media messages. In this paper, we introduce a new geo-targeted social media analytic method to (1) investigate the dynamic relationship between air pollution-related posts on Sina Weibo and daily AQI values; (2) apply Gradient Tree Boosting, a machine learning method, to monitor the dynamics of AQI using filtered social media messages. Our results expose the spatiotemporal relationships between social media messages and real-world environmental changes as well suggesting new ways to monitor air pollution using social media. 1. DATA Two types of data were used in this study. One type was the air quality index (AQI) data obtained from China’s Ministry of Environmental Protection. The other type of data was the Sina Weibo messages about “outdoor air pollution” posted by Beijing users. A total of 179,316 messages posted between January 1, 2012 and December 31, 2013 were obtained by using Sina Weibo API. 2. MICROBLOGS CATEGORIZATION To extract data content about the dynamics of air quality in the real world, we categorized the microblogs into three types: (1) Retweet Messages The term, retweet messages, refers to those microblogs reposting the contents of other microblogs (Suh, 2010). (2) Mobile App Messages
Mobile app messages are microblogs posted by app users. Many people install air pollution apps on their mobile phones. These apps broadcast air pollution updates containing the AQI every few hours and allow users to post these updates on Sina Weibo directly. (3) Original Individual Messages. Original individual messages are created by social media users expressing their own personal opinions. Individual users mentioned air pollution keywords in their individual messages in relation to air quality around their own immediate surroundings. 3. ANALYSIS OF DIFFERENT KINDS OF MICROBLOGS In this section, we investigated how the dynamics of air quality in the year 2012 was revealed in cyberspace, as measured by different types of microblogs. 3.1 Comparing original individual messages to AQI We explored the relationship between the temporal trends in individual messages and the dynamic changes of the daily AQI by using the Pearson correlation coefficient. The Pearson correlation coefficients between the AQI and individual messages and the negative individual messages were denoted as ri and rni. The ri and rni for each month are shown in Table 1. The ri in seven months was higher than 0.6 and significant at p < 0.01. In most months with high values of ri, the individual messages can be strongly correlated to the AQI and reflect the dynamic of AQI. In order to reflect the dynamics of the air quality using the individual messages for the months with low values of ri, we explored how to improve the consistency between AQI and individual messages trends. By analyzing the sentiments expressed in individual messages, we found that many microblogs with positive content about air quality were posted in tandem with the drop in the AQI values. The microblogs were manually sorted into two nominal categories: positive and negative. The rni for each month was higher than ri and all the values of rni were significant at p < 0.01. Therefore, the negative individual messages were more strongly correlated to the AQI and reflect the AQI dynamics better than the individual
This contribution has been peer-reviewed. doi:10.5194/isprsarchives-XLI-B2-553-2016
553
The International Archives of the Photogrammetry, Remote Sensing and Spatial Information Sciences, Volume XLI-B2, 2016 XXIII ISPRS Congress, 12–19 July 2016, Prague, Czech Republic
messages. For example, the rni (0.61) for July was much higher than ri (0.08). Table 1. Correlation coefficient between AQI and individual messages. ri rni 0.75** 0.76** January 0.65** 0.68** February 0.73** 0.74** March 0.83** 0.91** April 0.41* 0.69** May 0.44* 0.72** June 0.08 0.61** July 0.61** 0.66** August 0.26 0.69** September 0.64** 0.63** October 0.67** 0.69** November 0.44* 0.47** December *Pearson correlation coefficient is significant at p < 0.05
*Pearson correlation coefficient is significant at p < 0.05 **Pearson correlation coefficient is significant at p < 0.01
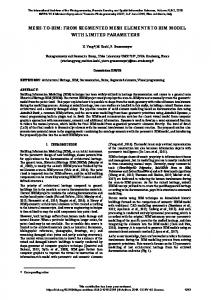
4. USING INDIVIDUAL MESSAGES TO MONITOR AQI Based on the correlation analysis, the Gradient Tree Boosting (GTB) was applied to monitor AQI in 2013 by using individual messages. We inputted daily frequencies of negative individual messages and positive individual messages into GTB as two explanatory variables. The data in 2012 and 2013 was treated as training set and test set, separately. The inferred AQI deviate no more than 30.0 (on average). The inferred AQI and observed AQI in January are shown in Fig. 1. The trends were consistent and most values of inferred AQI were close to the observed AQI. This indicates that the social media messages can be used as a new way to monitor the dynamics of AQI. 500
**Pearson correlation coefficient is significant at p < 0.01
Observed AQI Inferred AQI
3.2 Comparing mobile app messages and retweets to AQI Analyzing the trends of app messages and retweets can be useful for understanding the dynamics of AQI. The Pearson correlation coefficients between the AQI and app messages and retweets were denoted as ra and rw, as shown in Table 2. Compared to the rni, most values of ra and rw were lower. Among the 12 months, the values of ra in eight months were lower than 0.6. The rw for each month was relatively low and most values were not significant. Therefore, app messages and retweets were not strongly correlated to the AQI and cannot reflect the dynamics of AQI in real world.
Air Quality Index Value
400
300
200
100
0 1/1
1/6
1/11
1/16
Date
1/21
1/26
Figure 1. The inferred AQI and the observed AQI in January in 2013. Table 2. Correlation coefficient between AQI and app messages and retweets. ra rw
January
0.79**
0.16
February
0.14
0.18
March
0.48**
0.17
April
0.32
0.03
May
0.11
0.57**
June
0.35
0.07
July
0.04
-0.04
August
0.63**
0.14
September
-0.30
0.27
October
0.63**
0.47**
November
0.63**
0.46**
December
0.51**
0.13
REFERENCES He, CF., Huang, ZJ., Ye, XY., 2014. Spatial heterogeneity of economic development and industrial pollution in urban China. Stochastic Environmental Research and Risk Assessment, 28, pp. 767-781. Wang, S., Paul, MJ., Dredze, M., 2015. Social Media as a Sensor of Air Quality and Public Response in China. Journal of Medical Internet Research, 17,pp. e22. Mei, S., Li, H., Fan, J., Zhu, X., Dyer, CR., 2014. Inferring air pollution by sniffing social media. In: Proceedings of the 2014 IEEE International Conference on Advances in Scoail Network Anlysis and Mining, Beijing, China. pp. 534-539. Suh, B., Hong, L., Pirolli, P., Chi, EH., 2010. Want to be retweeted? large scale analytics on factors impacting retweet in twitter network. In: Proceedings of the 2010 IEEE International Conference on Social Computing, Minneapolis, USA. pp. 177-184.
This contribution has been peer-reviewed. doi:10.5194/isprsarchives-XLI-B2-553-2016
554
1/31