Using Graphical Representations to Support the Calculation of Infusion Parameters Sandy J.J. Gould, Anna L. Cox, and Duncan P. Brumby UCL Interaction Centre, University College London, Gower Street, London WC1E 6BT {s.gould,brumby}@cs.ucl.ac.uk,
[email protected]
Abstract. A variety of medical procedures require arithmetic calculations to be performed. These calculations can be complex and induce errors that can have serious consequences on the ward. In this paper, we consider whether a graphical representation might make these calculations easier. The results of a laboratory experiment are reported in which participants were asked to solve a number of infusion parameter problems that were represented either graphically or textually. Results show that participants were faster but no more accurate in solving graphical problems than they were textual problems. We discuss the need for situated work to be conducted that builds on these initial findings to determine whether the advantages of graphical representations transfer to actual workplace settings. Keywords: Graphical reasoning, infusion pumps, re-representation, calculation.
1
Introduction
Many tasks on hospital wards require nurses to perform calculations involving rates, volumes and times (e.g., setting up syringe drivers and infusion pumps). Unfortunately, there is a large body of evidence showing that nurses and trainee-nurses have poor arithmetic skills [1–3]; as a result, calculation errors are occasionally made [4]. This has implications for the quality of care patients receive. A number of approaches have been taken to improving calculation ability. These have ranged from traditional pedagogic efforts [5] – more teaching – to the development of interactive learning environments [6]. Although educational programmes do much to address arithmetical shortcomings, they provide little insight into whether the traditional textual layout of information used during calculations is best suited to the task that nurses face. An alternative approach that we explore here is to radically change the presentation of the calculation information from textual to graphical. It has been argued that graphs might make the calculation of infusion parameters easier, thus reducing the likelihood of error [7]. However, there has been little work to date that has evaluated whether people are better at solving these kinds of problems when presented with graphical representations than they are with textual representations. P. Kotzé et al. (Eds.): INTERACT 2013, Part IV, LNCS 8120, pp. 721–728, 2013. © IFIP International Federation for Information Processing 2013
722
S.J.J. Gould, A.L. Cox, and D.P. Brumby
The aim of this paper is to determine whether a graphical representation makes it easier for people to make calculations about infusion parameters. We report the results of a lab-based experiment in which participants were given a set of calculation problems, represented either graphically or textually, along with some questions to answer. We wanted to know whether the graphical representations would allow participants to achieve the same or better levels of accuracy in less time than was possible with textual representations. 1.1
Related Work
Performing calculations is a major component of many nurses’ routines. For example, infusion pumps, which are used to deliver medication intravenously to patients, need to be programmed with parameter values, usually infusion duration, volume and rate. Sometimes all of these values are given on a prescription or medication bag so they can be easily programmed into the device. However, sometimes there are missing values that must be calculated before they can be programmed [8]. Even when all of the values are provided, infusions can occasionally be disrupted midway through (e.g. because of a battery failure [8]). Such failures require new values to be calculated and then programmed into the pump so that the infusion can be resumed. Reports show that many nurses find these calculations difficult and more worryingly often overestimate their ability to perform them [9]. Hence there is an opportunity to see whether modifications to environmental artefacts might facilitate accurate calculations. Previous work [10] has experimented with nomograms – one dimensional slide rule-like representations – to make such calculations easier. Empirical results indicate that these representations can significantly reduce the number of errors made in calculation tasks. Although nomograms ease calculations, they do not provide a representation of the complete time course of the infusion, or its current state, which may cause difficulties when restarting disrupted infusions (e.g., because of a battery failure). It has been proposed [7] that representing infusions on two dimensional charts might make it easier for nurses to reason about the setup of infusions, but this proposal has not been tested empirically. The advantages conferred by re-representing information have been of interest to the areas of cognitive science and human-computer interaction for some time. Larkin and Simon [11] describe the properties of informational and computational equivalence of representations: representations are informationally equivalent if they are constructed from the same underlying data; they are computationally equivalent if inferences can be drawn with equal speed and ease. Zhang and Norman [12] extend these definitions from a distributed cognition perspective, finding that multiple representations of the same task can afford different degrees of external representation, which in turn affects problem-solving efficacy. External representations are not necessarily diagrammatic and there is a subset of research concerned specifically with reasoning about representations that use Cartesian co-ordinates (i.e. a chart or graph). Peebles and Cheng [14] provide an empirical
Using Graphical Representations to Support the Calculation of Infusion Parameters
723
validation of the equivalencies described previously by Larkin and Simon [11] in the context of chart-based reasoning. In their study, they compared informationally equivalent graphs and showed that constructing graphs according to particular psychovisual properties can result in reasoning efficiencies that can mitigate participant unfamiliarity with a particular representation. However, this does not seem to apply universally: in some cases where participants were required to reason about equivalent representations, familiarity both with the topic and with graphs is a significant factor in interpretation performance [15]. To reduce the effect of familiarity on reasoning performance, this study uses simple two-point graphs, and participants are not required to perform interpretation; instead, they only need to retrieve calculation parameters from the graph. Despite the extensive work in the area of graphical representations, we are unaware of any comparative experimental studies of the performance characteristics of graphical and textual representations of the same information. We describe an experiment that investigates whether people are able to perform better in resolving arithmetical problems similar to those that nurses perform for infusions when given graphical representations compared to traditional textual representations. The representations used are informationally equivalent: each problem is represented twice, once in graphical form and once in textual form. However, we hypothesise that the representations are not computationally equivalent: using them requires different degrees of effort. Building on the suggestion that graphical representations might make infusion problems easier to deal with [7], we predict that graphical representations will be less computationally intensive (i.e. easier to use) than textual representations. If graphical representations are indeed less computationally intensive, participants should be able to complete the problems more quickly and more accurately than they can with textual representations.
2
Method
2.1
Participants
Twenty-one participants (11 female) with a mean age of 24 years (SD=4 years) took part in the study. Participants were recruited from the psychology subject pool at University College London and were paid £10 for approximately one and a half hours of their time. 2.2
Materials and Design
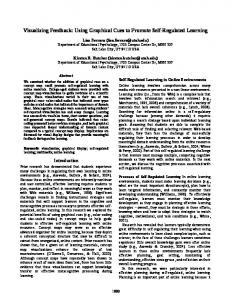
The experiment was made up of 22 infusion problems. These problems specified the total volume to be infused (i.e. the starting volume), the total duration of the infusion, the time elapsed so far and the total volume remaining. Each of these problems was presented twice during the course of the experiment, once textually and once graphically (see Fig. 1). Participants were not informed that the same problems could appear more than once in different forms.
724
S.J.J. Gould, A.L. Cox, and D.P. Brumby
Rat e: VTBI:
1000m l/h 1000m l
Volum e: 700m l Tim e:
0h 18m 0s
Fig. 1. Examples of the textual (left) and graphical representations used in the experiment
The textual representations (shown on the left of Fig. 1) give the rate of infusion, the total volume (VTBI), the volume remaining and the time elapsed. This representation is typical of the interface of many infusion pumps that are currently manufactured. The graphical representations use the same information, only plotted on a chart. Although the information differs in representation, the total information content is identical. All graphical representations were displayed on the same scale from 01000ml/h and 0-120 minutes. In order to encourage calculation, the graphs were not drawn accurately enough to compute answers directly from the graphs by reading values from the axes. Underneath the representation of the problem, participants were given either one or three questions on the problem, depending on the phase of the experiment. These problems required participants to retrieve information from the representations and then perform a calculation. For example, for the problem shown in Fig. 1, participants might be asked “How many minutes remain in this infusion?” To come to the correct answer – 42 – participants would need to subtract the time elapsed from the total infusion duration. More complex questions might ask, “If the rate of infusion was halved at this moment, how much longer would the infusion take?” Participants answered the questions associated with the problem and then clicked a button to proceed to the next problem. Participants were not given any feedback on their answers. In addition to the calculation task, participants were also required to complete a cognitively demanding secondary interrupting task. This was a modification of the nback task [16]. Participants were shown a two-by-two grid. Every three seconds, one of the cells was filled in either blue or red. This was a two-back task so participants had to decide whether the current arrangement matched the arrangement of colour and position they were shown two arrangements prior. The interruptions lasted for 30 seconds after which participants were returned to the primary task. Finally, an eight item post-experiment questionnaire was also devised. This asked participants about the extent to which they found different aspects of the experiment difficult. Participants indicated their agreement with a statement on a five-point Likert scale.
Using Graphical Representations to Support the Calculation of Infusion Parameters
725
This study used a counterbalanced within-subjects design with a single independent variable, type of representation, which had two levels, graphical and textual. The dependent variables were answer accuracy; time to complete each problem; and time to answer the first question in a problem after it was presented on the screen. 2.3
Procedure
After reading an information sheet, watching an introductory video and giving consent, participants started working through the training phase. Participants were presented with eight training problems, four each for the graphical and textual representations. Each problem came with three questions, the majority of which required participants to find the appropriate information in the representation and transcribe it into a text field. For example, for the problem in Fig. 1, participants might be asked what volume remained to be infused or how much time was left. Participants completed all of the problems with the assistance of the experimenter. If participants demonstrated satisfactory competence in answering these questions they continued to the experimental trials, which consisted of two phases. The first experimental phase presented participants with a single question per problem. Participants were given the same problem twice, once with the graphical representation and once with the textual representation. There were a total of nine problems in this first phase, giving a total of 18 trials, two for each problem. The order of presentation was counter-balanced. The second experimental phase used a different set of nine problems. In order to accommodate interruptions, problems in this phase comprised three questions. Interruptions occurred after the participant had started working on the problem. More specifically, interruptions could occur in one of two places: either before the second question or before the third question. There were a total of 18 trials in this phase, nine of each type of representation. Participants alternated between the two types of representation (i.e. a graphical problem followed by a textual problem) and this order was counterbalanced across participants. Participants were given access to a pen, paper and calculator for the duration of the study and told that they were free to do as they wished with them.
3
Results
Four participants were unable to complete all questions in the time available, so their data were excluded from the analysis. Participants answered a total of 1224 questions, 306 in the first phase and 918 in the second. Of the 1224 questions, 745 were answered correctly giving an answer accuracy rate of 61%. Of the correct answers, 388 came from graphical problems (per participant, M=23, SD=8) and 357 came from textual problems (M=21, SD=8). Representation type did not have a significant main effect on the number of correct answers t(16)=2.06, p=0.06. As well as accuracy, we were also interested in the speed at which participants were able to complete the problems. Problems from the first phase were used for this
726
S.J.J. Gould, A.L. Cox, and D.P. Brumby
purpose because there was only one question associated with each problem. This allowed us to eliminate any effects of guessing, by examining the time spent on a problem for correct answers only. On average, participants took longer to complete a problem using the textual representation (M=69s, SD=33s) than with the graphical representation (M=48s, SD=20s). This difference was significant1, t(15)=2.24, p