Using Hidden Markov Models to Evaluate the Risks of Intrusions System Architecture and Model Validation Andr´e ˚ Arnes1 , Fredrik Valeur2 , Giovanni Vigna2 , and Richard A. Kemmerer2 1
Centre for Quantifiable Quality of Service in Communication Systems Norwegian University of Science and Technology O.S. Bragstads plass 2E, N-7491 Trondheim, Norway
[email protected], http://www.q2s.ntnu.no/ 2 Department of Computer Science, University of California Santa Barbara, Santa Barbara, CA 93106-5110, USA {fredrik|vigna|kemm}@cs.ucsb.edu, http://www.cs.ucsb.edu/∼rsg/
Abstract. Security-oriented risk assessment tools are used to determine the impact of certain events on the security status of a network. Most existing approaches are generally limited to manual risk evaluations that are not suitable for real-time use. In this paper, we introduce an approach to network risk assessment that is novel in a number of ways. First of all, the risk level of a network is determined as the composition of the risks of individual hosts, providing a more precise, fine-grained model. Second, we use Hidden Markov models to represent the likelihood of transitions between security states. Third, we tightly integrate our risk assessment tool with an existing framework for distributed, large-scale intrusion detection, and we apply the results of the risk assessment to prioritize the alerts produced by the intrusion detection sensors. We also evaluate our approach on both simulated and real-world data. Keywords: Risk assessment, Intrusion detection, Hidden Markov modeling.
1
Introduction
The complexity of today’s networks and distributed systems makes the process of risk management, network monitoring, and intrusion detection increasingly difficult. The amount of data produced by a distributed intrusion detection system can be overwhelming, and prioritization and selection of appropriate responses is generally difficult. On the other hand, risk assessment methodologies are being used to model and evaluate network and system risk. These approaches are generally limited to manual processes, and are not suitable for real-time use. The approach presented in this paper provides both a high-level overview of network risk based on individual risk evaluations for each host and a quantitative metric for performing alert prioritization. Alerts are prioritized according to the
risk associated with the hosts referenced in the alert. Preliminary work on the risk-assessment method used in this paper was presented in [1], but it was not tested as part of an intrusion detection system. The implementation presented in this paper processes the alerts produced by a set of sensors monitoring a number of hosts. We use training data from Lincoln Laboratory [11] and real network traffic from the Technical University of Vienna [8] to test the performance of the model. The main contribution of this paper is a novel approach to network risk assessment. The approach considers the risk level of a network as the composition of the risks of individual hosts. It is probabilistic and uses Hidden Markov models (HMMs) to represent the likelihood of transitions between security states. We tightly integrate the risk assessment tool with an existing framework for distributed, large-scale intrusion detection, and we apply the results of the risk analysis to prioritize the alerts generated by the intrusion detection sensors. Finally, the approach is evaluated using both simulated and real-world data. The remainder of this paper is structured as follows. In Section 2 we present the theoretical model and the necessary terminology for the paper. In Section 3 we present the system architecture, and in Section 4 we discuss how the method can be used for real-time risk assessment for two example data sets. We provide a discussion of the method in Section 5 and an overview of related work in Section 6. Conclusions and some open research issues are discussed in Section 7.
2
Model and Terminology
This section presents our risk-assessment model and discusses some aspects of parameter estimation and learning. 2.1
Security State Estimation
The use of Hidden-Markov Models (HMMs) as a method for estimating the risk of a network was proposed in [1]. An HMM enables the estimation of a hidden state based on observations that are not necessarily accurate. An important feature of this model is that it is able to model the probability of false positives and false negatives associated with the observations. The method is based on Rabiner’s work on HMMs [13]. Assume that each host h can be modeled by N different states, i.e., S = {s1 , . . . , sN }. The security state of a host changes over time, and the sequence of states visited by a host is denoted X = x1 , . . . , xT , where xt ∈ S. Each host is monitored by a number of sensors k ∈ K1h , . . . , KLh , where L is the number of sensors for host h. A sensor generates observation messages from the observation k symbol set V k = {v1k , . . . , vM }, where M is the number of messages for sensor k. The sequence of observed messages is denoted Y = y1 , . . . , yT , where yt ∈ V is the observation message received at time t. The HMM for each host consists of a state transition probability matrix P, an observation probability matrix Q, and an initial state distribution π. The HMM is denoted λ = (P, Q, π).
The hosts modeled in this paper are assumed to have four possible security states S = {G, P, A, C}, which are defined as follows: – Good (G): The host is not subject to any attacks. – Probed (P): The host is subject to probing or mapping activity. This state can lead to a reduction in availability, and it increases the probability of an attack. – Attacked (A): The host is being attacked by one or more parties. This state can lead to a reduction in availability, and it increases the probability of a compromise. – Compromised (C): The host has been compromised. This state may result in loss of confidentiality, integrity, and availability. Figure 1 shows the Markov model for the security states of the hosts. The edge from one node to another represents the fact that when a host is in the state indicated by the source node it can transition to the state indicated by the destination node. Note that the graph is fully connected, which indicates that it is possible to transition from any security state to any other security state. The state transition probability matrix P describes the probabilities of transitions between the states of the model. Each entry, pij , describes the probability that the model will transfer to state sj at time t + 1 given that it is in state si at time t, i.e., pij = P (xt+1 = sj |xt = si ), 1 ≤ i, j ≤ N . The observation probability matrix Q describes the probabilities of receiving different observations given that the host is in a certain state. Each entry, qn (m), k at time t, given represents the probability of receiving the observation symbol vm k k that the host is in state sn at time t, i.e., qn (m) = P (yt = vm |xt = sn ), 1 ≤ n ≤ N, 1 ≤ k ≤ K, 1 ≤ m ≤ M .
G
P
A
C
Fig. 1. Markov model for hosts. Consider examples of a university network and a military network to see how values are assigned to the model parameters. Example 1. In a university network, we can assume that there are high volumes of probing and a fair amount of attack attempts. The security level for hosts is also varying, and a system compromise is a likely scenario for some hosts. Consequently, the transitions to state P , A, and C are relatively likely. In addition, because the traffic in university networks is heterogeneous and changing over
time, we assume that it is hard to configure and maintain accurate IDS sensors. Therefore, we have to assume that there is a high number of false positives and negatives. This is modeled by increasing the probabilities of receiving an observation that indicates a false positive or a false negative and decreasing the probability of receiving an accurate observation in the matrix Q. For example, qG (4), which represents the probability of receiving an observation indicating a compromised alert when the system is actually in the good state, has to be increased to represent the false positive probability. P and Q can for example be set as follows: 1 1 0 0.95 0.02 0.02 0.01 pGG pGP pGA pGC BpP G pP P pP A pP C C B0.02 0.95 0.02 0.01C C C B P=B @pAG pAP pAA pAC A = @0.02 0.02 0.94 0.02A , 0.01 0.01 0.01 0.97 pCG pCP pCA pCC 0 1 0 1 qG (1) qG (2) qG (3) qG (4) 0.7 0.1 0.1 0.1 BqP (1) qP (2) qP (3) qP (4)C B0.1 0.7 0.1 0.1C C B C Q=B @qA (1) qA (2) qA (3) qA (4)A = @0.1 0.1 0.7 0.1A . qC (1) qC (2) qC (3) qC (4) 0.1 0.1 0.1 0.7 0
In this simple example, the values in the bottom left corner of the Q matrix represent false negatives, whereas the values in the top right represent false positives. The diagonal represents the probability of accurate detections. Also, in such a network, the initial state distribution π has to take into consideration the probability that a system is already under attack or even compromised: π = {0.65, 0.2, 0.1, 0.05}. Example 2. In a military grade system, we can assume that the security level is very high, and the probability of attacks is low, as the system is not known to the public. This implies that the probability of transition to P and A should be low, but P should still take into account the possibility of random scanning. Due to the high level of security, the probabilities of transition to state C should be extremely low. The observation probabilities should represent the fact that the traffic is regulated, and that the IDSs and logging systems are configured to be highly accurate. The initial state can be assumed to be π = {1, 0, 0, 0}. The following are example transition and observation probability matrices: 0.995 0.002 0.002 0.001
0.97 0.01 0.01 0.01
0.02 0.959 0.02 0.001 0.01 0.97 0.01 0.01 P= ,Q = . 0.02 0.02 0.958 0.002 0.01 0.01 0.97 0.01 0.01 0.01 0.01 0.97
2.2
0.01 0.01 0.01 0.97
Risk Assessment
Each of the states for a host is associated with a cost vector C, indicating the potential consequences of the state in question. The total risk Rh,t for host h at time t is N X Rh,t = γt (i)C(i) (1) i=1
where γt (i) is the probability that the host is in security state si at time t, N is the number of security states, and C(i) is the cost value associated with state si . Example 3. A university network usually consists of a large number of hosts, including student laptops, workstations, web servers, student record databases, and staff file servers. For the purpose of network management, the servers are the most valuable assets, and a compromise of staff data or student records could have very negative consequences. Example cost vectors could be: Claptop = {0, 1, 2, 5}, Cworkstation = {0, 2, 5, 10}, Cwebserver = {0, 2, 5, 20}, CstudentDB = {0, 5, 20, 50}, and Cf ileserver = {0, 5, 10, 25}. If the current security state distribution for the student record database is {0.8, 0.15, 0.05, 0}, then the risk for that asset at time t is RstudentDB,t = 0.8 ∗ 0 + 0.15 ∗ 5 + 0.05 ∗ 20 = 1.75. The same security state distribution for a student laptop would result in the risk Rlaptop,t = 0.25. The total risk for an entire network at time t can be expressed as Rnw,t =
H X
Rh,t
(2)
h=1
where H is the number of hosts in the network. By using the sum of the risk of all hosts, it is possible to see aggregate peaks of risk activity where the risk of several hosts are simultaneously increased. A property of this definition of network risk is that security incidents that only involve a few hosts may not impact the total risk of a large network to a noticeable degree. Also, the risk can only be interpreted by using knowledge of the normal risk level of the system, as well as the maximum risk of the system. A limitation of this definition of network risk is that it does not consider dependencies between hosts. This is not covered in this paper, but left for further work. The average risk for a network can be expressed as Rnw,t =
Rnw,t . H
(3)
As opposed to (2), the average risk for a network is a normalized value for a given network. If a high percentage of the hosts in a network are subject to security incidents, the average risk for the network can be expected to vary significantly over time. Note that Rnw,t is system-dependent, as the HMMs and cost vectors of different hosts vary. In a traditional risk assessment context, one would expect risk to stay at the most critical security state once that state has been reached. This paper focuses on real-time risk assessment, and the model proposed in this paper is intended to be used as a real-time tool for risk management. That is, we are interested in representing the level of risk activity; therefore, the HMMs used in the examples allow the risk to gradually decrease, even if the host in question has been assessed to be in state C. The arrival of new alerts indicating a less critical state also decreases the risk of a host. This is done in order to avoid a situation where an increasing number of hosts are assessed to have the maximum risk possible. Another possible approach is outlined in Section 5.
2.3
Alert Prioritization
Each processed alert is assigned a priority according to the risk of the involved hosts. If a host is assessed to have a high risk, all alerts involving that host will receive a high priority, whereas a low risk host will receive a low priority. The alert receives a prioritization number according to the host with the highest risk number. The priority Pa for an alert a at time t can be determined as follows Pa = max(Rh1,t , Rh2,t ),
(4)
where h1 is the source IP address and h2 is the destination IP address of the alert a. Example 4. In a network with both high and low value hosts, the priority of an alert is decided by the current risk of the affected host, which is in turn a function of the cost vector and the estimated security state. An alert a1 at time t for the student database in Example 3 would receive a priority Pa1 = 1.75, whereas an alert a2 for the student laptop would receive priority Pa2 = 0.25. If both the source and destination address of an alert are monitored by the risk assessment system, the priority is assigned to be the higher of the two risk values. 2.4
Parameter Estimation and Learning
The estimation of the appropriate values for the model parameters P, Q, π, and for the cost vector C can be determined using either training algorithms or expert knowledge, supported by an appropriate methodology. Notably, a uniform initial distribution of the P and π parameters is adequate as a basis for training the parameters, according to [13]. The initial parameters can alternatively be determined using a risk assessment methodology, such as [2]. These methodologies provide a framework for identifying threats and vulnerabilities and for determining probabilities and consequences of risks. Based on an HMM with initial parameters, there are several algorithms available for re-estimating the parameters (i.e., training the models). There is, however, no analytical solution to the re-estimation problem, and there is no optimal way of estimating the model parameters based on an observation sequence as training data [13]. A standard approach for learning HMM parameters is the Baum-Welch method, which uses iteration to select HMM parameters to maximize the probability of an observation sequence.
3
System Architecture and Implementation
This section discusses the architecture of the real-time risk assessment system and how it is integrated into the STAT framework. Some implementation details are also presented.
3.1
System Architecture
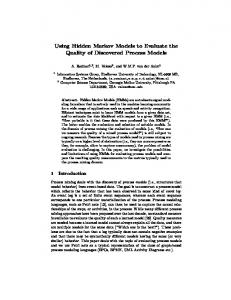
The risk-assessment system receives input events from multiple intrusion detection sensors throughout the protected network. Both host-based and networkbased sensors are supported. The alerts generated by the sensors are either in the IDMEF format [3] or in a format native to the sensor. Native alert formats are converted into IDMEF alerts before further processing. Intrusion detection alerts from the sensors are collected by the MetaSTAT collector [17, 18] through network connections. MetaSTAT then merges the different alert streams and the aggregate stream is fed to the risk-assessment system. The output of the system is a stream of prioritized alerts. The main advantage of this system is that the security administrator can easily identify the most important alerts by sorting them by the prioritization value. By handling the important alerts first, the administrator can make more efficient use of his time. The system is implemented as a set of modules in the STAT framework [17, 18]. Figure 2 is an overview of the architecture. The system consists of three different modules: Alert Classification, Spoof Detection, and Risk Analysis. The operation of each of the modules is explained in detail below.
Fig. 2. Overview of the System Architecture The classification module augments the incoming alerts with a classification attribute. The classification assigned to a given alert is dependent on the impact that the attack referenced in the alert has on the network. The system utilizes the following classes of attacks: successful recon limited, successful user, and successful admin. The IDMEF standard specifies an optional classification attribute, and the classification module uses this attribute if it is set by the intrusion detection sensor. Unfortunately, most sensors do not provide a value for the classification attribute. When the classification module encounters alerts with no classification, the missing attribute is looked up in a database. The database contains a mapping from sensor-type/alert-name tuples to the corresponding class. The mapping database can be created manually by looking at the rules of the deployed intrusion detection sensors and classifying each rule as either referring to a successful recon limited, successful user, or successful admin attack. The database can also be created automatically if the rules of the intrusion detection
sensors contain a CVE id, which is often the case. The CVE database can be queried for the description of the attack and the classification can be filled in from the description. A problem that may occur is that some alerts do not contain the real IP of the host that caused the IDS alert to be generated. This happens when the attacker host spoofs the source IP of the packets that are part of the attack. A network IDS monitoring the attack traffic sees the attack coming from the spoofed IP and reports the spoofed IP as the attacker. The spoof detection module detects spoofed alerts and attempts to infer the real IP of the attacker. Spoof detection can be performed by keeping track of what IP addresses each host is utilizing. An anti-spoofing tool, such as arpwatch, can be utilized to create a database of what IPs are associated with each Ethernet address. When the spoof detection module of the risk assessment system receives an alert, the database is consulted to check if the attacker IP contained in the alert matches the Ethernet address in the alert. Some of the problems with this approach are that most intrusion detection alerts do not contain Ethernet addresses and that packets with spoofed Ethernet addresses would not be detected. Another way of performing spoof detection is to check whether the IPs referenced in the alert are part of the protected network. If neither the attacker nor the victim is part of the protected network, the attack must either be spoofed or an outside attacker is attacking another outsider using the protected network. Since most networks do not allow traffic from third parties to transit their network, the second case is highly unlikely, and one can conclude that spoofing has taken place. Note that this spoof detection mechanism is unable to catch instances of spoofing where the victim of the spoofing is within the protected network. When a spoofed alert is detected, the real IP of the attacker can be fetched from the IP mapping database if Ethernet addresses are present in the alerts. In the case of alerts without Ethernet addresses the real attacker cannot easily be identified. In this case, any of the hosts in the protected network could be the attacker. The spoof detection module handles this by forwarding the alert to every host in the subnet where the attack was detected. After spoof detection is performed, the alerts are processed by the risk analysis module. The module keeps one HMM model for each of the protected hosts. When an alert is received, the models for the hosts referenced in the alert are looked up. For each of these hosts, the HMM model is updated with the latest observation. Finally, the risk value for each of the affected hosts is calculated and the alert is augmented with the maximum of these risk values before the alert is sent to the administrator. 3.2
Implementation
The real-time risk assessment implementation is based on the algorithms in [1]. Only one observation probability matrix Q is defined for each host. For hosts with multiple sensors (such as Mill and Pascal in Section 4.1), all sensors have been incorporated into one Q.
The implementation is integrated into the STAT framework, as described above. It consists of the following C++ classes: RiskObject (representing a host), RiskSensor (representing an IDS sensor), and RiskObservation (representing a sensor observation). The implementation receives IDMEF messages from the framework, and processes these based on the source and destination IP addresses, sensor identities, alert timestamps, and the alert impact values. As the Hidden Markov Models are discrete time models, the risk is updated for every second for each host, based on the available alerts relevant to each host. A relevant alert either has the IP address of the host in question as its source or destination IP address, or it originates from a host-based IDS on the host. If no alert is available for a host, the system uses the default observation “no alert” as input to the HMM computation. If more than one alert is received for a host during the 1 sec. interval, the first alert is processed and the remaining alerts are queued for the next intervals. For the sake of responsiveness, the maximum queue size is set to 60 seconds for the purpose of this paper. All new alerts will be discarded when the maximum queue size has been reached. This approach is chosen in order to be able to handle alert bursts, such as the outbound DDoS described in Section 4.1. Note that the problem of alert queues can be mitigated by choosing a sufficiently short time interval for the hidden Markov models.
4
Experiments
The purpose of this section is to validate the proposed method and to demonstrate how the system outlined in Section 3 can be used on real-life data. For the experiments two different data sets were used: the Lincoln Laboratory 2000 data set and traffic data from TU Vienna. The first data set contains experimental data, whereas the second contains data from a real network. The advantage of using the Lincoln Labs data is that it contains a truth file [11]. Therefore, the results can be checked against these values. The TU Vienna data set validates the feasibility of using the approach on real data. The basic experimental approach was to determine the HMM parameters Q, P, π, and C for the Lincoln Laboratory data and to verify that the results produced by our method correspond to the information gleaned from the truth file. The same parameters were then used on the real traffic data from TU Vienna in order to validate the model’s parameters in a realistic setting. By using the same HMM parameters for both data sets, where applicable, it is possible to compare the results obtained from the two cases. The outcome of the experiments are highly dependent on the HMM parameters and the alert classification, in addition to the alert and traffic data used. The HMM parameters used in these examples were determined manually based on the authors’ experience with the models. The following general guidelines were used in determining the appropriate values for the parameters: – The risk level for a host should be close to zero when there are no alerts. This implies that the probability of being in state G should be close to 1 when there are no alerts.
– When state C occurs, the model should stay in this state longer than it would for states P and A. – In order to make the results comparable, the cost vector for all hosts are identical. In a real setting, the cost vectors for different assets would vary depending on their value. Section 4.1 presents the details of the parameters used and the results of applying the method to the Lincoln Laboratory 2000 data set. Section 4.2 presents the same for the TU Vienna data. 4.1
Lincoln Laboratory Scenario (DDoS) 1.0
The Lincoln Laboratory 2000 data set [11] is based on experimental network traffic for a network of four class C subnets. The data set contains a network dump, as well as Solaris BSM [16] system logs. This data has been processed with the Snort network-based IDS and the USTAT host-based IDS in order to generate IDMEF alerts. The resulting data set contains more than three hours of intrusion detection data for subnets 172.16.112.0/24, 172.16.113.0/24, 172.16.114.0/24, and 172.16.115.0/24. The hosts Mill (172.16.115.20), Pascal (172.16.112.50), and Locke (172.16.112.10) are attacked and compromised, and they are then used to launch a DDoS attack against an external host using spoofed IP addresses. There are two Snort network IDS sensors (an outside sensor and a DMZ sensor), and the hosts Mill and Pascal are equipped with instances of the USTAT host-based IDS. Attack Phases The data set contains an attack in five phases (see [11]). The phases are outlined below with excerpts from the original description. IP sweep approximate time 09:45 to 09:52: “The adversary performs a scripted IPsweep of multiple class C subnets on the Air Force Base. (...) The attacker sends ICMP echo-requests in this sweep and listens for ICMP echo-replies to determine which hosts are up.” sadmind ping approximate time 10:08 to 10:18: “The hosts discovered in the previous phase are probed to determine which hosts are running the sadmind remote administration tool. (...) Each host is probed, by the script, using the ping option of the sadmind exploit program.” Break in to Mill, Pascal, and Locke approximate time 10:33 to 10:34: “The attacker then tries to break into the hosts found to be running the sadmind service in the previous phase. The attack script attempts the sadmind Remoteto-Root exploit several times against each host (...) there are 6 exploit attempts on each potential victim host. To test whether or not a break-in was successful, the attack script attempts to login.”
Installation of DDoS tools on Mill, Pascal, and Locke approximate time 10:50: “Entering this phase, the attack script has built a list of those hosts on which it has successfully installed the hacker2 user. These are Mill, Pascal, and Locke. For each host on this list, the script performs a telnet login, makes a directory (...) and uses rcp to copy the server-sol binary into the new directory. This is the mstream server software. The attacker also installs a .rhosts file for themselves.”
Outbound DDoS with spoofed source IP addresses approximate time 11:27: “In the final phase, the attacker manually launches the DDoS. This is performed via a telnet login to the victim on which the master is running, and then, from the victim, a telnet to port 6723 of the localhost. (...) The command mstream 131.84.1.31 5 causes a DDoS attack, of 5 seconds duration (...) to be launched by all three servers simultaneously.”
Observation Messages Based on the available alert data and the output from the alert classification preprocessor, we use the following observations in the implementation: 1. 2. 3. 4.
Suspicious Snort alert: All alerts that are not explicitly classified. Compromise Snort alert: All alerts that are classified as “successful admin”. Scan Snort alert: All alerts that are classified as “successful recon limited”. Host-based alert (only available for hosts Mill and Pascal): The data set only contains the alert types “unauth delete” and “restricted dir write”. 5. Outbound Snort alert: All Snort alerts originating from an internal host. 6. No alert: This observation is assumed whenever there are no other alerts to be processed for a host. The classification could be made more fine-grained, but it is kept simple in this paper for demonstration purposes. In particular, the output of the host-based USTAT IDS in a real setting would generate a wide range of different alert types. In this example, however, we have made the simplification of modeling the USTAT sensor as producing one observation type only. Similarly, we have made the assumption that outbound Snort alerts reduce the probability of being in the “good” state.
Model Parameters The monitored network consists of 1016 IP addresses, each modeled by an HMM. The transition probability matrices P, observation probability matrices Q, initial state distribution vectors π, and the cost vectors C are the same for each host, with the exception of the hosts Mill and Pascal, which incorporate the possibility of receiving USTAT alerts. As an example, the host Mill is modeled as follows:
0
PM ill
QM ill
1 pGG pGP pGA pGC BpP G pP P pP A pP C C C =B @pAG pAP pAA pAC A pCG pCP pCA pCC 1 0 0.992995 0.004 0.003 0.000005 B 0.004 0.991995 0.004 0.000005 C C, =B @ 0.003 0.004 0.992995 0.000005 A 1 × 10⁻³⁴ 1 × 10⁻³⁴ 1 × 10⁻³⁴ 1 − 3 × 10⁻³⁴ 1 0 qG (1) qG (2) qG (3) qG (4) qG (5) qG (6) BqP (1) qP (2) qP (3) qP (4) qP (5) qP (6)C C =B @qA (1) qA (2) qA (3) qA (4) qA (5) qA (6)A qC (1) qC (2) qC (3) qC (4) qC (5) qC (6) 0 1 0.05 0.0001 0.02 0.01 0.02 0.8999 B0.05 0.0001 0.25 0.01 0.02 0.6699C C =B @ 0.1 0.005 0.1 0.03 0.03 0.735 A , 0.02 0.05 0.04 0.04 0.05 0.8
πM ill = (πG , πP , πA , πC ) = (1, 0, 0, 0), CM ill = (cG , cP , cA , cC ) = (0, 25, 50, 100).
From PM ill , we can see that the probability of entering the state C is relatively low, but that once entered, the probability of leaving this state is very low. From QM ill , we can see that the scan observation is relatively likely to occur in the P state, that the suspicious and scan observations are relatively likely to occur in the A state, and that the USTAT and outbound observations have a relatively high probability in the C state. Note that once entered, the C state is likely to last for a long time. From πM ill and CM ill , we can see that the initial state of the host is G with corresponding cost 0. The maximum cost for the host is 100. Most of the hosts do not have a host-based IDS and are modeled with the following observation probability matrix (host Locke is given as an example): 0
QLocke
0.05 B0.05 =B @ 0.1 0.02
0.0001 0.0001 0.005 0.05
0.02 0.25 0.1 0.04
0 0 0 0
0.02 0.02 0.03 0.05
1 0.9099 0.6799C C 0.765 A 0.84
For the purpose of this example all hosts, except the hosts with USTAT, have the exact same model parameters. This is done for demonstration purposes and in order to provide comparable results between the hosts. In a real setting, the model parameters of the hosts would vary according to their security configurations, the observation probability parameters vary according to the sensors used, and the cost vector is determined by the value of the assets and the consequence of the different security states. Results The above models were implemented and used to perform real-time risk assessment on the Lincoln Laboratory data set. The entire data set has a
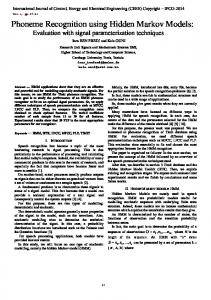
duration of 11836 sec., and a total of 36635 alerts, 84 of which are USTAT alerts. The remaining are Snort alerts. As outlined above, the data set consists of an attack in five phases. By inspecting the data set, we can see that the phases correspond to the approximate time periods 1500 - 1920 sec. (the IP sweep), 2880 - 3480 sec. (the sadmind ping), 4380 - 4420 sec. (the break in to Mill, Pascal, and Locke), 5400 sec. (the installation of DDoS tools), and 7620 sec. (the outbound DDoS). Figure 3 shows the total assessed risk for the Lincoln Laboratory data for the full duration of the data set. The figure shows a sum of the risk for all hosts in the four subnets (in total 1016 hosts). The break-ins performed against Mill, Pascal, and Locke are clearly visible as peaks of risk activity. The sadmind ping also introduces a peak in the data, but the IP sweep and the installation of DDoS tools are hardly distinguishable from the remaining activity. Note that the system seems to have a minimum risk of approximately 1200 in the long run. This is caused by a stable security state with risk level 1.09 for the individual hosts, given a sufficiently long interval of only “no alert” observations. The stable security state risk for the entire network is consequently 1107. The difference can be explained by the fact that the host 172.16.114.1 has a high amount (more than 2000) of outbound ICMP related alerts. As a router, this host should probably have different HMM parameters then the other hosts.
2000 1800 1600
Risk Activity
1400 1200 1000 800 600 400 200 0
0
2000
4000
6000
8000
10000
Time (s)
Fig. 3. Total assessed risk for Lincoln Labs data set. Figure 4 (a), (b), and (c) show the assessed risk for the hosts Mill, Pascal, and Locke, respectively. The hosts Mill and Pascal have host-based IDSs (USTAT) that provide several alerts during the experiment. This can be seen in Fig. 4 (a), (b), and (c), as the host Locke has far less activity than the other two. Phase 3 and 5 of the attack are clearly marked with the maximum risk activity value (100) for all three hosts. Phase 2 and 4 are also visible as peaks, whereas phase 1 is hardly discernible from the other activity in Fig. 4 (a) and (b), and not visible at all in (c). Note that Pascal (Fig. 4 (b)) shows more peaks than Mill (Fig. 4
(a)). This is caused by the fact that Pascal produces 70 USTAT alerts, while Mill only produces 14.
100
Risk Activity
80 60 40 20 0
0
2000
4000
6000 Time (s)
8000
10000
100
100
80
80 Risk Activity
Risk Activity
(a) Assessed risk for host Mill.
60 40 20 0
60 40 20
0
2000
4000
6000 Time (s)
8000
10000
(b) Assessed risk for host Pascal.
0
0
2000
4000
6000 Time (s)
8000
10000
(c) Assessed risk for host Locke.
Fig. 4. Real-time risk assessment for Lincoln Labs data set. Figure 5 (a) and (b) show the assessed total network risk and the assessed risk for Mill at the approximate time of the compromise (4000s to 6000s). The graphs correspond to Fig. 3 and 4 (a), but zoom in on the time period. Fig. 5 (b) shows the two peaks corresponding to phase 3 and 4 of the attack. By counting the priority of the alerts for the entire data set, we can evaluate the performance of the alert prioritization mechanism. However, for the purpose of the prioritization results, we do not consider the outbound DDoS attack with spoofed IP addresses and the outbound alerts from the router with IP address 172.16.114.1. The outbound DDoS attack alerts represents 93% of the total alerts, and are all marked with the highest priority. The IP address 172.16.114.1 is discussed above. It has a high number of alerts (6% of the total amount), and they would also all be marked as maximum priority alerts. Having filtered out these alerts, 52.49% of the alerts are with priority below 20, 28.87% with priority between 20 and 40, 6.49% with priority between 40 and 60, 2.35% with priority between 60 and 80, and 9.81% with priority between 80 and 100. It is clear that the alert prioritization is successful in that only a small percentage of the alerts are assigned high priority values. The majority of the alerts are marked as low priority.
1900 100
1800
80 Risk Activity
Risk Activity
1700 1600 1500
60 40
1400 20
1300 1200 4000
4500
5000
5500
6000
Time (s)
(a) Assessed network risk showing system compromise.
0 4000
4500
5000 Time (s)
5500
6000
(b) Assessed risk showing host Mill compromise.
Fig. 5. Lincoln Labs data set showing period of time of compromise. We see that the risk assessment method with the current configuration and alert classification parameters is able to assess the risk and detect several of the security relevant incidents outlined above. In particular, we see that the model is capable of assigning the appropriate maximum risk values to the two most critical incidents, the compromise and the outbound DDoS attack with spoofed IP addresses. 4.2
Real Traffic Data from the Technical University of Vienna
The second data set is based on real network traffic from the Technical University of Vienna [8]. The data set contains a trace of nine days for a class B network. However, in this experiment we have only included three days worth of data from one class C network. There were no known security incidents during this period. The IDS used in this setup is Snort with the same signature set as in the previous example. The model parameters are also the same as in the previous example, with the exception that there are no host-based IDSs in this setup. Results Figure 6 shows the assessed risk for the entire network for the full three day period. The two periods of increased risk activity are caused by an increasing amount of outbound alerts, as seen in Fig. 7 (c). We see that the risk seems to have a lower bound at a level about 280. This lower bound is the total risk associated with the stable security state of the individual host HMMs. As in 4.1, the individual stable state risk for a host is 1.09, and the total stable state risk for the network is consequently 276.86. Figure 7 (a), (b), (c), and (d) show the assessed risk for a duration of 3.5 hours, corresponding to the second period of increased activity in Fig. 6. Fig. 7 (a) shows the risk activity for the full network, indicating three peaks of increased risk and some periodic fluctuations. Fig. 7 (b) shows the risk activity for a host with no alert activity. Fig. 7 (c) shows the risk activity for a host with outbound alerts that lead to several peaks of maximum risk for the host. Based on the underlying traffic data, it has been determined that these alerts are in fact false alerts from Snort caused by a specific user pattern. Finally, Fig. 7 (d) shows the
risk activity for a web server with periodic peaks of risk values between 20 and 40. This is caused by probing activity directed at the web server. This activity is present during the entire period, and is a contributing factor to the fluctuations in Fig. 6.
500
Risk Activity
400
300
200
100
0
100000
150000
200000 Time (s)
250000
Fig. 6. Total assessed risk for class C subnet (3 days). For this data set, 46.35% of the alerts are assigned priority below 20, 49.78% with priority between 20 and 40, 1.29% with priority between 40 and 60, 0.08% with priority between 60 and 80, and 2.49% with priority between 80 and 100. As for the previous example, it is clear that the alert prioritization is successful in that only a small percentage of the alerts are assigned high priority values. We see that the approach is applicable to data from real network traffic. However, this example demonstrates that the proposed model is dependent on the accuracy of the underlying IDSs, and false positives and negatives affect the results of the risk assessment. In this experiment, we have reused the HMM parameters from the Lincoln Laboratory example. This allows us to compare the performance of the model under similar circumstances. However, this is not an optimal approach for this data set, as the parameters should be estimated specifically for the monitored network.
5
Discussion
The network risk assessment approach presented in this paper provides a quantification of the risk level of hosts in a network. An alternative, naive approach to this problem could involve counting alerts and assigning a value according to the assumed impact of the alerts. A decay function could be used to facilitate a gradual decrease in risk to avoid a non-decreasing risk situation. The method proposed in this paper provides several advantages over the naive approach. The primary advantage is that HMMs provide an established framework for state
1200 100 1000 80 Risk Activity
Risk Activity
800 600 400
40 20
200 0 170000
60
172000
174000
176000
178000
180000
0 170000
182000
172000
174000
Time (s)
100
100
80
80
60 40 20 0 170000
178000
180000
182000
(b) Assessed risk for a host with no alert activity (3.5 hours).
Risk Activity
Risk Activity
(a) Assessed risk for class C subnet (3.5 hours).
176000 Time (s)
60 40 20
172000
174000
176000 Time (s)
178000
180000
182000
(c) Assessed risk for a host with outbound alerts (3.5 hours).
0 170000
172000
174000
176000 Time (s)
178000
180000
182000
(d) Assessed risk for a web server (3.5 hours).
Fig. 7. Real-time risk assessment for a real Class C subnet (3.5 hours). estimation, modeling both the probabilities of entering certain states, as well as the probabilities of receiving different observations in each state, effectively providing a framework for representing the false-positive and false-negative effects of IDSs. The state modeling and transition probabilities can also be related to traditional risk assessment methodologies. Finally, the use of learning algorithms and parameter re-estimation can be employed to tune the system automatically. Note that we model the security state of a system; we do not attempt to model individual attacks or attackers. One limitation of the approach is that an attacker with knowledge of the HMMs used could attempt to camouflage a successful compromise by subsequently causing a number of less serious alerts. Depending on the HMMs used, this could lead to a misrepresentation of the risk level of the system. The HMMs used in this paper are fully connected, in that every state of the model can be reached in a single step from every other state of the model [13]. It is possible to use other types of HMMs, such as the left-right models. These models can, for example, be used if one wants to model the compromised state as consuming; i.e., that the probability of being in state C never decreases. Fig. 8 shows an example of a left-right HMM, which only allows transitions from left to right; i.e., to more security critical states. If there is a steady input of alerts, the risk of a system modeled with this HMM will tend to approach the maximum risk for the system.
G
P
A
C
Fig. 8. A left-right HMM. Although the experiments in this paper were run in an off-line mode, we believe that the method is capable of handling alerts in real-time. The 3.5 hour Lincoln Laboratory data set was processed in 2 minutes 44 seconds, while the 3 day TU Vienna data set was processed in 20 minutes 54 seconds. Even with significantly smaller time intervals, the model would still be able to process alerts on a single host in real-time for multiple class C networks.
6
Related Work
Research in risk assessment and risk management has traditionally focused on the development of methods, tools, and standards for risk assessment. Two commonly recommended references for risk management are [14] and [15]. Methodologies, such as Coras [2] and Morda [5], have been developed to support the risk assessment process. This paper complements these approaches by performing risk assessment in real-time based on an initial estimation of model parameters representing the probabilities of different security states. A real-time risk assessment method has previously been proposed by [6]. However, that approach is limited to risk assessment for individual hosts. A number of different approaches that perform alert prioritization have been proposed. In [12] Porras et al. present a model that takes into account the impact of alerts on the overall mission that a network infrastructure supports. This approach relies on a knowledge base that describes the security-relevant characteristics of the protected network in order to prioritize the alerts. Other alert prioritization systems [4, 7, 9] perform alert verification. These systems assign a higher priority to alerts that are verified as true attacks, while alerts that are determined to be false positives are given a low priority. Alert verification systems operate either offline or online. Offline systems perform periodic vulnerability scans of the protected network and store the result in a database. Alerts are verified by checking if the vulnerabilities that the alerts refer to are present on the attacked hosts. Online alert verification systems operate in a similar way, but no database is kept. Instead, vulnerability scanning is performed on-demand when alerts are received by the system [10].
7
Conclusions and Future Work
We have presented an approach to real-time network risk assessment that determines the risk level of a network as the composition of the risks of individual
hosts, providing a precise and fine-grained model for risk assessment. The model is probabilistic and uses Hidden Markov Models to represent the likelihood of transitions between security states. We have tightly integrated the risk assessment approach with the STAT framework and have used results of the risk assessment to prioritize the IDS alerts. Finally, we have evaluated the approach using both simulated and real-world data. An important limitation of this approach is the need for model parameter estimation. The parameters for our experiments were estimated manually. This is a time-consuming task with inherent uncertainties. We plan to investigate the use of training algorithms to estimate the model parameters For the experiments in this paper we did not take into consideration dependencies between hosts. Doing this would give a more accurate overview of network risk and better model the consequences of security incidents relating to assets inside a network. For example, if a host on the inside of a network is compromised, this should increase the risk level of other hosts within the network as well. We plan to include inter-host dependencies in our future experiments. A general framework for handling multiple sensors can be implemented by representing each of the sensors monitoring a host with an HMM. In this way, each sensor can be assigned a separate observation probability matrix Q. The state estimation can be performed on behalf of each of the sensors, while the risk for a host is computed as a function of the state estimates of all the relevant sensors. This will be implemented in the next version of the system. We have performed experiments using real-traffic data in an off-line mode, but we have not yet tested the system on-line with live traffic. This will be done as part of the future work.
Acknowledgments This research was supported by the US Army Research Office, under agreement DAAD19-01-1-0484, and by the National Science Foundation, under grants CCR0238492 and CCR-0524853. The “Centre for Quantifiable Quality of Service in Communication Systems, Centre of Excellence” is appointed by The Research Council of Norway, and funded by the Research Council, NTNU and UNINETT.
References 1. Andr´e ˚ Arnes, Karin Sallhammar, Kjetil Haslum, Tønnes Brekne, Marie Elisabeth Gaup Moe, and Svein Johan Knapskog. Real-time risk assessment with network sensors and intrusion detection systems. In International Conference on Computational Intelligence and Security (CIS 2005), 2005. 2. CORAS IST-2000-25031 Web Site, 2003. http://www.nr.no/coras. 3. Herv´e Debar, David A. Curry, and Benjamin S. Feinstein. Intrusion detection message exchange format (IDMEF) – internet-draft, 2005. 4. Neil Desai. IDS correlation of VA data and IDS alerts. http://www. securityfocus.com/infocus/1708, June 2003.
5. Shelby Evans, David Heinbuch, Elizabeth Kyule, John Piorkowski, and James Wallner. Risk-based systems security engineering: Stopping attacks with intention. IEEE Security and Privacy, 02(6):59 – 62, 2004. 6. Ashish Gehani and Gershon Kedem. Rheostat: Real-time risk management. In Recent Advances in Intrusion Detection: 7th International Symposium, (RAID 2004), Sophia Antipolis, France, September 15-17, 2004. Proceedings, pages 296– 314. Springer, 2004. 7. Ron Gula. Correlating ids alerts with vulnerability information. Technical report, Tenable Network Security, December 2002. 8. Cristopher Kruegel, Engin Kirda, Darren Mutz, William Robertson, and Giovanni Vigna. Polymorphic worm detection using structural information of executables. In Proceedings of the International Symposium on Recent Advances in Intrusion Detection (RAID 2005), volume 3858 of LNCS, pages 207–226, Seattle, WA, September 2005. Springer-Verlag. 9. Cristopher Kruegel and William Robertson. Alert verification: Determining the success of intrusion attempts. In Proceedings of the 1st Workshop on the Detection of Intrusions and Malware and Vulnerability Assessment (DIMVA 2004), Dortmund, Germany, July 2004. 10. Cristopher Kruegel, William Robertson, and Giovanni Vigna. Using alert verification to identify successful intrusion attempts. Practice in Information Processing and Communication (PIK 2004), 27(4):219 – 227, October – December 2004. 11. Lincoln Laboratory. Lincoln laboratory scenario (DDoS) 1.0, 2000. http://www. ll.mit.edu/SST/ideval/data/2000/LLS_DDOS_1.0.html. 12. Phillip A. Porras, Martin W. Fong, and Alfonso Valdes. A mission-impact-based approach to infosec alarm correlation. In Proceedings of the International Symposium on the Recent Advances in Intrusion Detection (RAID 2002), pages 95–114, Zurich, Switzerland, October 2002. 13. Lawrence R. Rabiner. A tutorial on hidden markov models and selected applications in speech recognition. Readings in speech recognition, pages 267–296, 1990. 14. Standards Australia and Standards New Zealand. AS/NZS 4360: 2004 risk management, 2004. 15. Gary Stonebumer, Alice Goguen, and Alexis Feringa. Risk management guide for information technology systems, special publication 800-30, 2002. http://csrc. nist.gov/publications/nistpubs/800-30/sp800-30.pdf. 16. Sun Microsystems, Inc. Installing, Administering, and Using the Basic Security Module. 2550 Garcia Ave., Mountain View, CA 94043, December 1991. 17. Giovanni Vigna, Richard A. Kemmerer, and Per Blix. Designing a web of highlyconfigurable intrusion detection sensors. In W. Lee, L. M`e, and A. Wespi, editors, Proceedings of the 4th International Symposium on Recent Advances in Intrusion Detection (RAID 2001), volume 2212 of LNCS, pages 69–84, Davis, CA, October 2001. Springer-Verlag. 18. Giovanni Vigna, Fredrik Valeur, and Richard Kemmerer. Designing and implementing a family of intrusion detection systems. In Proceedings of European Software Engineering Conference and ACM SIGSOFT Symposium on the Foundations of Software Engineering (ESEC/FSE 2003), Helsinki, Finland, September 2003.