USING HYDRAULIC TESTING TO EVALUATE LNAPL RECOVERY IN FINE GRAINED SYSTEMS Evangelos I. Gatsios1,2, Colin D. Johnston1, John L. Rayner1, Robert G. McLaughlan2 1CSIRO Land and Water, 147 Underwood Avenue, Floreat, WA 6014, AUSTRALIA 2Faculty of Engineering and Information Technology, University of Technology Sydney, 15 Broadway, Ultimo, NSW 2007, AUSTRALIA
CSIRO LAND AND WATER
Introduction Petroleum fuels are the most common and widespread contaminants requiring management in urban and industrial environments. These contaminants are commonly referred to as light non-aqueous phase liquids (LNAPL). LNAPL transmissivity (L2/T) represents the ability of a formation to transmit LNAPLs. LNAPL transmissivity is directly proportional to LNAPL recoverability. In the present study, the recovery of LNAPLs from a gasoline contaminated fine grained site in Western Australia is measured. The research took place at two different locations with different initial transmissivity values and geological profiles. The aim of this research is to evaluate the LNAPL recovery of the site via short term (1-2 hours) baildown tests versus long term (1-2 weeks) recovery trials.
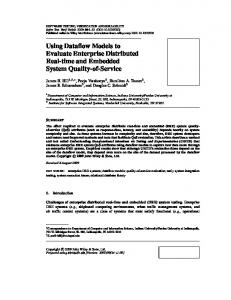
Figure 5: Site layout showing the recovery wells (PB29 and PB27) and the observation wells (MP34, PB33, MP36, PB35 and PB09). The inset figure is the specific gravity skimmer pump.
12
900 800
LNAPL Removal Rate (L/hr)
Cessation of Skimming
8
6
Cessation of Skimming
600
LNAPL Removal Rate
500
Cumulative LNAPL Volume
400
4
300 200
2 100
The description of the geology is presented according to the standards of ASTM (ASTM D2488-09α).
0 19-Jul-15
0 02-Aug-15 04-Aug-15 06-Aug-15
8 Corrected Water Table Elevation LNAPL Removal Rate
4.74
4.76
4.78
6
4
2
4.80 0 19-Jul-15 21-Jul-15 23-Jul-15 25-Jul-15 27-Jul-15 29-Jul-15 31-Jul-15 02-Aug-15 04-Aug-15 06-Aug-15
Figure 8: Time series of corrected water table elevation and LNAPL removal rate during skimming at PB27.
3
Cessation of Skimming
Cessation of skimming
2.5 2 1.5
4
1 2
0.5
21-Jul-15
23-Jul-15
25-Jul-15
27-Jul-15
29-Jul-15
31-Jul-15
LNAPL Transmissivity (m2/day)
LNAPL Removal Rate (L/hr)
4.72
3.5
LNAPL Transmissivity (Baildown Test)
8
0 19-Jul-15
10
4
LNAPL Transmissivity (Recovery Method)
6
4.70
Date (dd:mm)
LNAPL Removal Rate
0 02-Aug-15 04-Aug-15 06-Aug-15
Date (dd:mm)
Figure 7: Time series of LNAPL transmissivity values and removal rates during skimming at PB27.
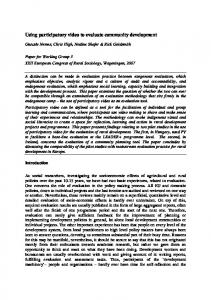
Figure 9: Cores from PB35 well. PB35 is the monitoring well of PB27. The distance between them is 4 meters. Depth intervals shown are m b.g.l.
Discussion
2000 1750 1500
8
1250 6
1000 750
4
500 LNAPL Removal Rate
250
Cum. LNAPL Volume 13-Jul-15
15-Jul-15
17-Jul-15
19-Jul-15
21-Jul-15
0 23-Jul-15
14
4.86
12
4.87 10
4.88 4.89
8
4.9 6
4.91 4.92
Corrected Water Table Elevation
4.93
LNAPL Removal Rate
4 2
4.94 4.95 07-Jul-15
09-Jul-15
11-Jul-15
13-Jul-15
15-Jul-15
17-Jul-15
19-Jul-15
21-Jul-15
0 23-Jul-15
Date (dd:mm)
Date (dd:mm)
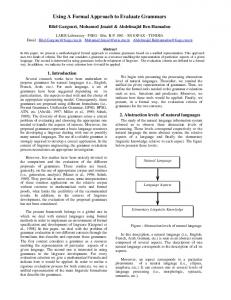
Figure 3: Time series of corrected water table elevation and LNAPL removal rate during skimming at PB29.
Figure 1: Time series of LNAPL removal rate and cumulative volume during skimming at PB29.
LNAPL Removal Rate (L/hr)
Cessation of Skimming
10
Corrected Water Table Elevation (m b.t.o.c)
2250
Cessation of Skimming
2
4.85
Cumulative LNAPL Volume (L)
LNAPL Removal Rate (L/hr)
31-Jul-15
10
(ASTM E2856-13)
2500
11-Jul-15
29-Jul-15
12
• Relatively high recovery rates occurred during early time of the skimmer trials (before steady state conditions).
14
09-Jul-15
27-Jul-15
12
Results
0 07-Jul-15
25-Jul-15
Figure 6: Time series of LNAPL removal rate and cumulative volume during skimming at PB27.
A specific gravity skimmer pump was used for the recovery of the free product. The recovery data was analyzed according to the: Standard guide for estimation of LNAPL transmissivity (ASTM E2856-13). The weighted mean of LNAPL recovery rate (Qn) and the geometric mean of drawdown (Sn) were used in the following equation for the calculation of transmissivity during skimming.
12
23-Jul-15
Date (dd:mm)
The baildown tests took place via bailers. The baildown test data was analyzed by the: User guide for API LNAPL transmissivity workbook and spreadsheet: A tool for baildown test analysis (API, 2012).
Roi Qn ln rw Tn 2 sn
21-Jul-15
Cumulative LNAPL Volume (L)
700
4.68
• Water table fluctuations (Fig.3 and 8) and stratigraphic differences between locations (PB27 contains some silt) appear to have affected the recovery performance during these trials.
Conclusions • Transmissivity values calculated during baildown and recovery testing are in the same order of magnitude with similar trends. • The recovery performance and transmissivity values showed similar trend.
14
LNAPL Removal Rate (L/hr)
8
Cessation of Skimming
Cessation of Skimming
7
10 6 8
5
LNAPL Removal Rate
4
4
LNAPL Transmissivity (Recovery Method) LNAPL Transmissivity (Baildown test)
3 2
2 0 07-Jul-15
LNAPL Transmissivity (m2/day)
12
6
• In conclusion, Tn is a useful metric for evaluating the performance of the recovery system and periodic baildown testing should be performed for the confirmation of recovery-based Tn trends.
9
Future Research
1
09-Jul-15
11-Jul-15
13-Jul-15
15-Jul-15
17-Jul-15
19-Jul-15
21-Jul-15
0 23-Jul-15
Date (dd:mm)
Figure 2: Time series of LNAPL transmissivity values and removal rates during skimming at PB29.
FOR FURTHER INFORMATION
NOTATION
Evangelos Gatsios e
[email protected] w www.csiro.au
Tn Qn Roi rw sn b.t.o.c b.g.l
Figure 4: Cores from PB33 used as the monitoring well of PB29 . The distance between them is 4 meters. Depth intervals shown are m b.g.l.
LNAPL transmissivity (L2/t) Measured LNAPL recovery rate (L3/t) Radius of influence (L) Well radius (L) LNAPL drawdown (L) Below top of casing Below ground level
CL CH ML SP SW SM SC GP
Lean clay Fat clay Silt Poorly graded sand Well graded sand Silty sand Clayey sand Poorly graded gravel
Future hydraulic testing will focus on long term recovery tests of different recovery technologies including total fluids removal, multiphase extraction and vacuum enhanced extraction and the relationship with different water table fluctuations so as to elucidate the role of Tn as a metric for recoverability.
ACKNOWLEDGEMENTS This research is financially supported jointly by CRC CARE and CSIRO Land and Water. The efforts of staff from CSIRO in the field program are appreciated. The support and assistance of the site owners is also greatly appreciated.
LNAPL Removal Rate (L/hr)
The two well location areas are PB29 and PB27. PB29 has higher initial transmissivity value than PB27. Monitoring wells at 2 and 4 meters distance from each well were used for the monitoring of the skimming process (equilibrium fluid levels and radius of capture).
10
Corrected Water Table Elevation (m b.t.o.c)
Methods