cept space map is a directed acyclic graph[13], a generalization of a tree structure .... The HyperGraph API provides a mechanism to modify hyperbolic graphs.
Using Hyperbolic Geometry for Visualisation of Concept Spaces for Adaptive eLearning. Kathryn Cassidy, John Walsh, Brian Coghlan, Declan Dagger Computer Architecture Group and Knowledge and Data Engineering Group, Department of Computer Science, Trinity College, Dublin, Ireland {Kathryn.Cassidy, John.Walsh, coghlan, Declan.Dagger}@cs.tcd.ie
Abstract. The Concept Space is an important part of an adaptive eLearning course. Understanding its structure from a traditional concept map is not, however, always straightforward. Hyperbolic trees are one alternative representation which can aid comprehension.
1
Concept Space Visualisation and Large Concept Spaces
A fundamental part of an Adaptive eLearning course is the Concept Space[2]. This provides an ontology of the subject matter including the concepts and their relationships to one another. Concept Spaces are traditionally visualised using a concept map diagram, a downward-branching, hierarchical tree structure. In mathematical terms, a concept space map is a directed acyclic graph[13], a generalization of a tree structure where certain subtrees can be shared by different parts of the tree. In practice, however, cycles are possible in a concept map when multiple relationship types are represented. Generally concept space visualisation tools are mathematically forgiving, tolerating loops or cycles rather than enforcing mathematical rules on the graph-representation. Very large collections of interrelated information, for example, large software systems, can only be described by large concept spaces, and traditional concept maps can be unweildy tools for their visualisation. It is often not possible to view the entire concept space on-screen without zooming out so far that the concept and relationship labels are no longer readable. Similarly, the large number of relationships makes it difficult to understand the structure of the concept space[7]. The difficulty in interpreting a concept space from a concept map diagram are compounded where the course creators are not the same people as the domain experts who created the concept space mapping. 1.1
Case Study: The R-GMA course
An adaptive course on R-GMA is currently being developed at Trinity College. This is part of an ongoing project to provide Adapitve eLearning on Grid technologies to scientists and other Grid users.
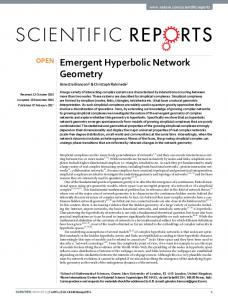
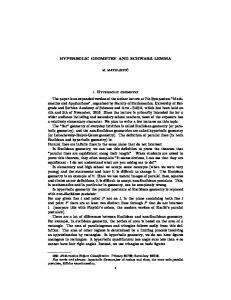
R-GMA[6] is a relational implementation of the Grid Monitoring Architecture (GMA)[15] of the Global Grid Forum (GGF), which is an information and monitoring architecture for Grid Computing Systems. R-GMA was originally developed as part of the European DataGrid (EDG) and is currently being further developed as part of the EU EGEE[5] project. R-GMA comprises a number of services which work together to produce the effect of a distributed virtual database. Producers publish information about grid services to the grid (via SQL INSERT) and Consumers query (via SQL SELECT) and use this information. The R-GMA concept space shown in Figure 1 contains 99 concepts and 267 relationships. A concept space of this scale is not easily handled by traditional concept space visualisation methods.
Fig. 1. The R-GMA Concept Space in ACCT
1.2
Requirements
Many of the more innovative tree visualisation techniques are not well suited to concept maps, for example Shneiderman’s Treemaps[14] and Kleiberg’s Botanical trees[10] cannot easily differentiate between relationship types. Node clustering[7] reduces the complexity of large concept space maps by artificially reducing the number of nodes. However this also removes information.
To better represent the R-GMA concept space it was necessary to find alternate ways to display concept spaces that: (a) make detail visible without repeated zoom-in and zoom-out, (b) fit the whole concept space on-screen while still being able to discern the finer details, (c) are intuitive and simple to use.
2
Hyperbolic geometry: an alternative representation
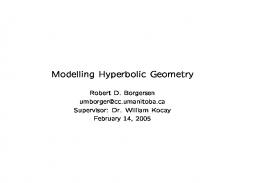
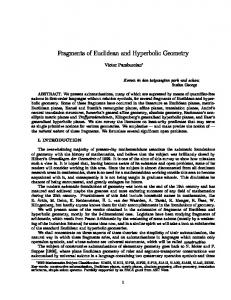
Hyperbolic geometry differs from normal Euclidian geometry in that hyperbolic planes are curved and parallel lines in hyperbolic space are not equidistant[1]. It is possible to represent a hyperbolic plane with constant negative curvature as a Poincar´e Disc where area increases exponentially the further one gets from the centre. Points further away from the centre are compressed to fit the expanding area into this disc. The classic example is one of Escher’s Circle Limit prints illustrated in Figure 2. The figures in these prints are reduced in size when they are further from the center, with an apparently infinite number represented towards the disc’s edge. In any tree structure the number of nodes tends to increase exponentially with depth, and thus trees might usefully be visualised in the form of a Poincar´e Disc. This has previously been attempted for various graphing applications across several domains[11], but not to visualise eLearning Concept Spaces. The remainder of this paper is concerned with the tools used to create a concept space and to visualise it as a hyperbolic tree structure.
Fig. 2. Escher’s Circle Limit III
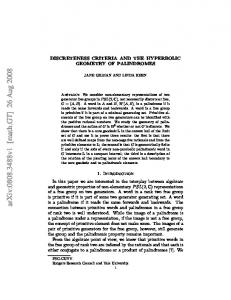
Fig. 3. A concept space represented in HyperGraph
3 3.1
Implementation ACCT
For the case study involving R-GMA, concept spaces were created using the ACCT Adaptive Course Construction Toolkit[3]. This tool provides a GUI interface for creating concept spaces in the form of concept maps. These concept spaces are encoded in a XML format which stores information on concept nodes and relationships. Whilst this tool is in general very easy to use, it is not ideal for large concept spaces. 3.2
HyperGraph
The HyperGraph applet[9] is an open source Java applet and API for visualisation of hyperbolic geometry, in particular hyperbolic trees. The hypergraph interface allows you to rotate the “pseudosphere” represented on the disc, bringing different areas to the centre of the hyperbolic disc. This allows one to effectively zoom in on a particular area while the rest of the graph is visible radiating out towards infinity from that point on the disc. As the area increases exponentially with the radius, conversely, points on the graph shrink exponentially as they move further away from the centre. This means that many more points can be displayed on a hyperbolic graph. Nodes are effectively compressed as they recede from the viewer, rather than simply scrolling off-screen. The real advantage of this is that the overall view (the “bigpicture”) of the graph is still visible while a smaller part of the graph can be brought into focus, thus enlarging it. Of course the extremities are in a compressed form, and may not always be entirely readable. With a standard concept map, however, when one focusses on one area, areas outside the field of view are simply not represented on-screen. HyperGraph files are stored in an XML format. 3.3
acct2hypergraph.pl
The conversion script was written in Perl using the XML Document Object Model (DOM) to parse and create the XML documents[8]. The Perl module XML::DOM was used for this. The script converts between the ACCT XML subject matter concept space (SMCS) file format and the HyperGraph XML graph format. Each concept in the ACCT SMCS file is mapped to a single node in the HyperGraph file, while different relationship types are mapped to different colour edges. See Figure 3 for the R-GMA concept space represented as a hyperbolic tree.
4
Results
We set out to find a simple user-friendly way to visualise concept spaces for adaptive courses. Using hyperbolic trees via the HyperGraph applet meets our requirements as indicated in Table 1.
Table 1. Requirements and Benefits of Solution Requirement
Solution
Visibility of detail with- Clicking on any node will bring it to the centre of the window, out repeated zooming. zooming in. This rearranges the other nodes curving away from the center on the Poincar´e disc. This makes viewing the detail of any section of the graph very simple. Visibility of whole con- With a hyperbolic tree the concept space is compressed as it recept without obscuring cedes from the centre of the window, rather than scrolling offdetail. screen. This means that it is always possible to get an overall view of the concept space. The compression can make it harder to see some of the outer details, but the overall impression of the full concept space is retained. Easy to use interface.
The user interface for the HyperGraph applet appears to be very intuitive. Nodes can be repositioned by single-clicking (to bring the node to the centre) or by dragging and dropping to any position.
However, there are some weaknesses. For example, tools for visualisation of hyperbolic geometry tend to be mathematically strict. As mentioned above, traditional concept space creation tools tend to be mathematically forgiving, rather than enforcing a strict acyclic directed graph. A concept map is often more loosely defined, with some loops tolerated and often more than one distinct graph or tree actually being used to represent the concept space for a single course (i.e. where there are two or more ‘root’ nodes). This mathematical looseness means that some concept spaces might not translate well into hyperbolic trees, or that changes might be required in the concept space before it can be represented as a hyperbolic tree.
5
Future Work
The conversion script works and is stable and additionally supports different colour edges to indicate different relationship types. Node colouring will also soon be implemented to indicate concept position in the tree hierarchy. The HyperGraph applet allows links to be incorporated that will load an URL when a node is clicked. This will allow links to learning resources or concept descriptions to be added to a hyperbolic concept-space browser. The HyperGraph API provides a mechanism to modify hyperbolic graphs. Using this, hyperbolic trees could be used to build concept spaces rather than simply to visualise a concept space that has been created using another tool. These concept spaces could then be exported in formats suitable for Adaptive Course Creation Tools such as ACCT. Another possiblility is 3D hyperbolic visualisation. This could give an even better view of a concept space with the ability to exit the hyperbolic plane and view it from outside as well as viewing it from within[12].
Further user evaluation of this technique is required to determine its effectiveness over a range of information domains. Also, the current implementation is not very generic and changes would be required to add support for other tools.
6
Conclusions
This work was motivated by the difficulty of understanding and manipulating large concept spaces using existing concept mapping tools. A hyperbolic representation was chosen as one possible solution to this problem. Hyperbolic trees make available both the detail and the “big picture”, or overall structure, of the concept space. Our work suggests that they may be an effective method for reducing complexity in representing large concept spaces, in particular where the jobs of creating the concept space and the course materials or pedagogy are shared among a group of people. Hyperbolic tree visualisation may also prove useful for creating new concept spaces in future.
References 1. Anderson, J.W. (2005) Hyperbolic Geometry. 2nd Edition. Springer-Verlag, London. 2. Dagger, D., Conlan, O., Wade, V. (2005) Fundamental Requirements of Personalised eLearning Development Environments E-Learn 2005, World Conference on E-Learning in Corporate, Government, Healthcare & Higher Education, Vancouver. 3. Dagger, D., Wade, V., Conlan, O. (2005) Personalisation for All: Making Adaptive Course Composition Easy In Special issue of the Educational Technology and Society journal, IEEE IFETS. 4. EDG: European Datagrid Project. http://eu-datagrid.web.cern.ch/eu-datagrid/ 5. EGEE: Enabling Grids for E-SciencE http://egee-intranet.web.cern.ch/ 6. Fisher, S. (2001) Relational model for information and monitoring. Technical Report GWD-Perf-7-1, GGF, 2001. 7. Freire, M. and Rodriguez, P. (2005) Comparing Graphs and Trees for Adaptive Hypermedia Authoring. In Proc. 3rd Int. Workshop on Authoring of Adaptive and Adaptable Educational Hypermedia. A3EH 2005, Amsterdam. pp. 6-14. 8. Harold, E.R. and Means, W. S. (2002) XML in a Nutshell O’Reilly and Associates, Sebastopol, Ca. 9. Kenschik, J. Hypergraph http://hypergraph.sourceforge.net/ 10. Kleiberg, E. et al. (2004) Botanical Visualisation of Huge Hierarchies Proc. IEEE Symposium on Information Visualisation, 2004, Austin, TX. pp. 87-94. 11. Lamping, J. and Ramana R. (1996) Visualizing Large Trees Using the Hyperbolic Browser. In Proc. ACM CHI. 1996, Vancouver. pp. 388-389. 12. Munzner, T. and Burchard, P. (1995). Visualizing the structure of the world wide web in 3D hyperbolic space. In Proc. VRML ’95 Symposium. 1995, CA. pp. 33-38. 13. Piff, M. (1991) Discrete mathematics : an introduction for software engineers Cambridge University Press, Cambridge. 14. Shneiderman, B. (1992) Tree Visualisation with tree-maps: 2-d space-filling approach ACM Transactions on Graphics volume 11,1. 1992, pp. 92-99. 15. Tierney, B. et al. (2000, Revised 2002) A Grid monitoring architecture, Global Grid Forum Performance Working Group. 16. Wall, L., Christiansen, T. and Orwant, J. (2000) Programming Perl. 3rd Edition. O’Reilly and Associates, Sebastopol, Ca.