Shanghai Key Laboratory of Digital Media Processing and Transmissions. {liumin merry ... reference (RR), image signature, discrete cosine transform. (DCT) ...
USING IMAGE SIGNATURE FOR EFFECTIVE AND EFFICIENT REDUCED-REFERENCE IMAGE QUALITY ASSESSMENT Min Liu, Guangtao Zhai, Zhili Zhang, Shen Tan, Ke Gu, and Xiaokang Yang Insti. of Image Commu. & Infor. Proce., Shanghai Jiao Tong Univ., Shanghai, China, 200240 Shanghai Key Laboratory of Digital Media Processing and Transmissions {liumin merry, zhaiguangtao, 345492947, tanshen, gukesjtuee, xkyang}@sjtu.edu.cn ABSTRACT Reduced-reference (RR) image quality assessment (IQA) with only partial information of the reference image available, has aroused increasing research interests nowadays. Many efforts have been devoted to this area for years, and have introduced various kinds of effective models. However, those arithmetics are usually extremely complicated. Therefore, we in this paper propose a new RR Image-Signature (RRIS) induced IQA metric by estimating the similarity between the transformed images that are induced by the image signature. The main design principle of the proposed method is that the image signature can capture the main information of an image with very few features and computational cost. The proposed algorithm is tested and verified on four large-size image quality databases (TID2008, CSIQ, LIVE and CID2013). Experimental results demonstrate the effectiveness and efficiency of our algorithm over those competing full- and reduced-reference IQA methods. Index Terms— Image quality assessment (IQA), reducedreference (RR), image signature, discrete cosine transform (DCT), similarity measure 1. INTRODUCTION An enormous number of images and videos are needed by human consumers. However, during the transmitting procedure, images/videos are usually deteriorated by different kinds of distortions, for instance, JPEG/JPEG2000 (JP2K) compression, gaussian noise, fast fading, which will induce the loss of visual quality for images and videos [1]. So accurate and easy-to-use image quality assessment (IQA) is quite necessary and important. Among which, the benchmark method is the subjective IQA, which is the most reliable and accurate method. Nevertheless, it accompanies with drawbacks of being time-consuming, expensive and cumbersome. As a consequence, objective quality assessment has been vigorously developed promoting largely the IQA research and functioning widely in the optimization of image processing systems such as compression and restoration.
So far, many objective IQA methods have been proposed. These approaches can be classified into three types according to the accessibility of the reference image. The first type is full-reference (FR) IQA [2]-[10], which assume that the whole information of perfect-quality reference image is available. The second type of objective methods is no-reference (NR) IQA [11]-[14], which does not require access to the reference image. In this paper, we focus on the third type of reduced-reference (RR) IQA. Different from aforementioned two types, RR IQA can be considered as a tradeoff between FR and NR IQA metrics. It only requires partial information of the original image when assessing the image quality. Very recently, several popular RR IQA methods have been developed in [15]-[19]. However, most of those above IQA metrics are complicated and cost much. To this end, we in this paper introduce a new effective and efficient RRIS paradigm, inspired by the recently proposed image signature. In general, RR IQA algorithms need the help of some amount of original information which is sent to the receiver side through an ancillary channel. A great RR IQA method resorts to a good tradeoff between accuracy and rate. For the sake of reducing the computational complexity, we adopt a simple feature named image signature in this paper. It is a binary and holistic image descriptor of natural scenes [20]. Furthermore, each pixel is represented only by one bit, and this can significantly reduce the amount of RR information required for transmission. At the receiver side, the reconstructed images can be obtained by inversely transforming them back into the spatial domain. We suppose that the quality of distorted images can be represented by the variation between the reconstructed images from the reference and distorted versions. Then, a structural similarity measurement is employed to estimate the distance of the structural information between those reconstructed images. The rest of this paper is arranged as follows. In Section 2, we take a brief review of the image signature before presenting the proposed RRIS algorithm in detail. Experimental results on four large-size image quality databases are illustrated to prove the effectiveness of our metric in Section 3. In the last section, we conclude the whole paper.
(a)
(b)
(c)
(d)
(e)
(f)
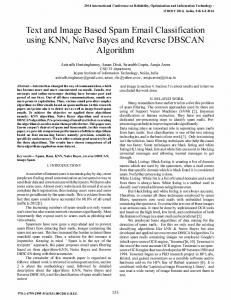
Fig. 1: The reference image from TID2008 database, and its five derived images, deteriorated by (b) spatially correlated noise, (c) quantization noise, (d) image denoising, (e) JPEG2000 compression, (f) local block-wise distortion respectively, along with their corresponding reconstructed images.
2. PROPOSED RRIS METHOD
At the receiver side, we inversely transform it back into the spatial domain to get the reconstructed image
2.1. Image Signature and Perceptual Quality H. Zhou proposed in [21] that human brain can separate images into foreground and background instantaneously, and the foreground can be extracted from the background by one simple descriptor named image signature [20]. It is a highlighting algorithm, which is obtained by taking the sign of the input signal in the Discrete Cosine Transform (DCT) domain. Assuming the reference image in the sender side is x, and its related signature is defined as IS(x) = sign(DCT(x)).
(1)
It needs to emphasize that we downsample the original image to 1/256 in this paper before calculating the signature. Furthermore, the image signature is composed of 1, 0 and 1, which significantly reduces the amount of information for transmitting.
x� = IDCT(IS(x)).
(2)
For distorted image y, we get the reconstructed image y� which is y� = IDCT(sign(DCT(y))).
(3)
Five distorted images contaminated by spatially correlated noise, quantization noise, image denoising, JPEG2000 compression, and block-wise distortion from TID2008 data base are utilized in this paper. And we display the image signature deduced reconstructed images in Fig. 1. Clearly, noticeable variation can be detected from different reconstructed images and we mask the difference between them with boxes. We assume that this variation is related to image quality, which can be used as a norm in image quality assessment.
Fig. 2: The framework of the proposed RRIS method. 2.2. Similarity Measurement After obtaining the reconstructed images of the original and distorted images, the perceptual distance between them should be measured. L1 distance and L2 distance are often chosen for their simplicity and nice mathematical properties, but they do not consistent with human perception very well. Besides, the Structural Similarity (SSIM) index is another metric providing better assessments of visual distortions between two images. SSIM is a combination of three terms, luminance similarity (the similarity of their mean values), structural similarity (the similarity between their contrasts) and contrast similarity (their correlation). According to its derivation MS-SSIM and IW-SSIM, we figure out that the structural similarity plays the most important role in quality evaluation, higher than luminance similarity and contrast similarity. In addition, HVS is proved to be highly adapted for extracting structural information. Therefore, in this paper, we use structure comparison function, which is demonstrated to represent the structural information of images σx’y’ + C (4) σx’ σy’ + C where C is an positive constants to avoid instability when σx� σy� is very close to zero. x� and y� are reconstructed images from the last subsection. Among the above function, the unbiased estimate, and covariance of the discrete reconstructed images from original and distorted signals x� and y� are estimated as S(x� , y� ) =
σ x� = (
N �
1
wi (x�i − μx� )2 ) 2
μ x� = N �
where M is the number of local windows of the image, x�j and y�j are the image contents at the jth local window. Fig. 2 depicts the idea of how the RRIS metric works. 3. EXPERIMENTAL RESULTS
N �
wi x�i
(6)
i=1
σ x� y� =
The overall image quality measure of the entire image is defined as M 1 � Q(x, y) = S(x�j , y�j ) (8) M j=1
(5)
i=1
where
Fig. 3: The structural similarity map generated from the reconstructed images of the reference and distorted images.
wi (x�i − μx� )(y�i − μy� ).
(7)
i=1
We use the gaussian weighting function w = {wi |i = 1, 2, ..., N } which is similar to SSIM metric. The structural similarity map is showed in Fig. 3.
Representative IQA methods are applied in this paper for a comparison with the proposed RRIS. Those algorithms include: 1) FR peak signal-to-noise ratio (PSNR), structural similarity index (SSIM) [2], noise quality measure (NQM) [3], visual signal-to-noise ratio (VSNR) [5]; 2) RR RRIQA [15], RR entropic-difference indexes (RRED) [16], free energy based distortion metric (FEDM) [18] and structural degradation model (SDM) [19].
(a)
(b)
(c)
(d) (e) (f) Fig. 4: The scatter plots of DMOS vs. RRIS on LIVE database: (a) the whole database; (b) JP2K dataset; (c) JPEG dataset; (d) Gblur dataset; (e) white noise dataset; (f) fast fading dataset. Four large-size image quality databases (TID2008 [22], CSIQ [23], LIVE [24], and CID2013 [25]) are used as benchmarks to validate our algorithm. The CID2013 introduced in our recent work is composed of various kinds of contrastchanged images and associated subjective ratings. Mappings of the scores of the image quality metrics to subjective scores are achieved through using nonlinear regression with a fourparameter logistic function as suggested by VQEG [26]: q(z) =
λ 1 − λ2 + λ2 3 1 + exp(− z−λ λ4 )
(9)
with z and q(z) being the input score and the mapped score, respectively. The free parameters λ1 to λ4 are to be determined during the curve fitting process. Four commonly used measures are employed to quantify the performance of those metrics above: 1) Pearson linear correlation coefficient (PLCC), meaning the prediction accuracy; 2) Spearman rank-order correlation coefficient (SROCC), computing the monotonicity by ignoring the relative distance between the data; 3) Kendall’s rank-order correlation coefficient (KROCC), another method to Measure the monotonicity (similar to SROCC); 4) root-mean-squared error (RMSE), quantifying the difference between ρ and Q(ρ). Higher PLCC, SROCC and KROCC, as well as lower RMSE represent better performance.
Table 1: SROCC values (after nonlinear regression) of FR metrics PSNR, NQM, SSIM, VSNR, RR metrics RRIQA, SDM, FEDM and our proposed RRIS metric on LIVE and its five distortion datasets. Metrics
JP2K
JPEG
WN
Gblur
FF
PSNR NQM SSIM VSNR
0.8954 0.9405 0.9355 0.6289
0.8809 0.9688 0.9449 0.3097
0.9854 0.9858 0.9629 0.9631
0.7823 0.8393 0.8944 0.4414
0.8907 0.8156 0.9413 0.6431
RRIQA SDM FEDM RRIS
0.9330 0.9439 0.1568 0.9489
0.9204 0.9447 0.0815 0.9721
0.8701 0.9729 0.1304 0.9732
0.9145 0.9342 0.1518 0.9399
0.9227 0.9384 0.1714 0.8506
First, we give the prediction performance of each IQA metric on five different distortion datasets in Table. 1. It can be seen that RRIS outperforms all the competing IQA methods on JP2K, JPEG and blur distortions. Even on the white noise distortion, our algorithm is only a slightly inferior to the best one. Overall, the proposed RRIS achieves the best results on average. Besides, the scatter plots of DMOS vs. RRIS on the whole LIVE database and five distortion datasets are also displayed in Fig. 4, which illustrates the well monotonicity and convergence of our metric.
Table 2: PLCC, SROCC, KROCC, RMSE values (after nonlinear regression) of FR metrics PSNR, NQM, SSIM, VSNR, RR metrics RRIQA, SDM, FEDM and our proposed RRIS metric on TID2008, CSIQ, LIVE, and CID2013 databases. Database (Image number)
Performance Measure PLCC SROCC KROCC RMSE
PSNR FR 0.5232 0.5530 0.4027 1.1435
NQM FR 0.6127 0.6291 0.4640 1.0605
SSIM FR 0.6413 0.6272 0.4562 1.0297
VSNR FR 0.6820 0.7046 0.5340 0.9815
RRIQA RR 0.5298 0.4881 0.3433 1.1381
SDM RR 0.6396 0.5877 0.4230 1.0316
FEDM RR 0.4953 0.1987 0.1295 1.1657
RRIS RR 0.7346 0.7393 0.5500 0.9105
CSIQ (866 images)
PLCC SROCC KROCC RMSE
0.7512 0.8058 0.6083 0.1732
0.7435 0.7438 0.5653 0.1756
0.8154 0.8378 0.6343 0.1520
0.7355 0.8109 0.6248 0.1779
0.6709 0.6855 0.5057 0.1947
0.7973 0.8122 0.6124 0.1584
0.6404 0.3664 0.2557 0.2016
0.8729 0.8034 0.6354 0.1281
LIVE (779 images)
PLCC SROCC KROCC RMSE
0.8721 0.8755 0.6863 13.368
0.9130 0.9093 0.7431 11.149
0.9150 0.9180 0.7446 11.026
0.9229 0.9271 0.7610 10.520
0.7363 0.7472 0.5576 18.488
0.8801 0.8799 0.6943 12.972
0.5009 0.3808 0.2855 23.648
0.9100 0.9294 0.7777 11.325
CID2013 (400 images)
PLCC SROCC KROCC RMSE
0.5957 0.6649 0.4847 0.5005
0.7166 0.7174 0.5386 0.4346
0.8119 0.8132 0.6140 0.3638
0.4624 0.4304 0.2980 0.5525
0.7676 0.7451 0.5651 0.3994
0.7158 0.6145 0.4363 0.4352
0.4777 0.4686 0.3333 0.5475
0.8648 0.8580 0.6668 0.3129
Average (3745 images)
PLCC SROCC KROCC RMSE
0.6855 0.7248 0.5455 3.7963
0.7465 0.7499 0.5777 3.2049
0.7959 0.7991 0.6123 3.1429
0.7007 0.7182 0.5545 3.0580
0.6762 0.6665 0.4929 5.0550
0.7582 0.7236 0.5415 3.6493
0.5286 0.3536 0.2510 6.3907
0.8456 0.8325 0.6575 3.1691
TID2008 (1700 images)
Second, performance evaluations and comparisons of all testing algorithms were conducted on TID2008, CSIQ, LIVE and CID2013 databases, and the corresponding results of PLCC, SROCC, KROCC and RMSE on each database and their average results are listed in Table. 2. From this table, it can be found that our RRIS method performs better than most testing FR IQA methods except just a little worse than VSNR on LIVE, and is superior to all testing RR IQA algorithms on four image quality databases. Finally, we tabulates in Table. 3 the running time of several mainstream FR IQA metrics (NQM, SSIM, VSNR) and RR IQA algorithms (RRIQA, SDM, FEDM, RRIS) on a pair of 384×512 color images from TID2008 database. Experiments were performed on a Dell PC with 3.4GHz CPU and 4GB RAM. And the software platform was Matlab R2010b. It is easy to find that RRIS ranks the best, even faster than the benchmark SSIM. 4. CONCLUSIONS In this paper, we propose a new effective and efficient RR IQA arithmetic (RRIS), based on the measure of the similarity between the transformed images that are induced by the image signature. Image signature is a very simple descriptor, which can briefly characterize the main information
Table 3: Time cost of testing FR and RR IQA methods and our proposed RRIS metric on TID2008 database. Metrics NQM SSIM VSNR RRIQA SDM FEDM RRIS
Time (milliseconds per image) 219.1887 86.00 494.8 2603.3 411.5 30827.434 47.214
of images. Therefore, we hypothesize that the image quality should be highly related to the similarity measure of the transformed images which are derived from the reference and distorted versions based on the image signature, and accordingly introduce the proposed RRIS. Besides the high accuracy on the frequently used distortion type (e.g. noise and blur), this method also has acquired high correlation performance on contrast-changed images, which clearly outperforms those image quality metrics tested in this paper. Furthermore, the proposed RRIS has very low computational cost, making it effective and efficient to use in IQA-related real-time image processing systems.
Acknowledgment This work was supported in part by NSFC (61025005, 61371146, 61221001), 973 Program (2010CB731401) and FANEDD (201339). 5. REFERENCES [1] A. C. Bovik, “Automatic prediction of perceptual image and video quality,” Proceedings of the IEEE, vol. 101, no. 9, pp. 2008-2024, September 2013. [2] Z. Wang, A. C. Bovik, H. R. Sheikh, and E. P. Simoncelli, “Image quality assessment: From error visibility to structural similarity,” IEEE Trans. Image Process., vol. 13, no. 4, pp. 600-612, April 2004. [3] N. Damera-Venkata, T. Kite, W. Geisler, B. Evans, and A. C. Bovik, “Image Quality Assessment Based on a Degradation Model,” IEEE Trans. Image Process., vol. 9, no. 4, April 2000.
[13] A. Mittal, A. K. Moorthy, and A. C. Bovik, “No-reference image quality assessment in the spatial domain,” IEEE Trans. Image Process., pp. 4695-4708, vol. 21, no. 12, December 2012. [14] K. Gu, G. Zhai, X. Yang, W. Zhang, and L. Liang, “Noreference image quality assessment metric by combining free energy theory and structural degradation model,” Proc. IEEE Int. Conf. Multimedia and Expo, pp. 1-6, July 2013. [15] Z. Wang and E. P. Simoncelli, “Reduced-reference image quality assessment using a wavelet-domain natural image statistic model,” Human Vision and Electronic Imaging., vol. 5666, January 2005. [16] R. Soundararajan and A. C. Bovik, “RRED indices: Reducedreference entropic differencing for image quality assessment,” IEEE Trans. Image Process., vol. 21, no. 2, pp. 517-526, February 2012. [17] Abdul Rehman, and Zhou Wang, “Reduced-reference image quality assessment by structural similarity estimation,” IEEE Trans. Image Process., vol. 21, no. 8, August 2012.
[4] G. Zhai, W. Zhang, X. Yang, S. Yao, and Y. Xu, “GES: a new image quality assessment metric based on energy features in Gabor transform domain,” Proc. IEEE Int. Symposium on Circuits and Systems, pp. 1715-1718, 2006.
[18] G. Zhai, X. Wu, X. Yang, W. Lin, and W. Zhang, “A psychovisual quality metric in free-energy principle,” IEEE Trans. Image Process., vol. 21, no. 1, pp. 41-52, January 2012.
[5] D. M. Chandler and S. S. Hemami, “VSNR: A wavelet-based visual signal-to-noise ratio for natural images,” IEEE Trans. Image Process., vol. 16, no. 9, September 2007.
[19] K. Gu, G. Zhai, X. Yang, and W. Zhang, “A new reducedreference image quality assessment using structural degradation model,” Proc. IEEE Int. Symp. Circuits and Syst., pp. 10951098, May 2013.
[6] G. Zhai, W. Zhang, Y. Xu, and W. Lin, “LGPS: Phase based image quality assessment metric,” IEEE Workshop on Signal Processing Systems, pp. 605-609, 2007. [7] K. Gu, G. Zhai, X. Yang, and W. Zhang, “Self-adaptive scale transform for IQA metric,” Proc. IEEE Int. Symp. Circuits and Syst., pp. 2365-2368, May 2013. [8] K. Gu, G. Zhai, X. Yang, and W. Zhang, “A new psychovisual paradigm for image quality assessment: from differentiating distortion types to discriminating quality conditions,” Journal of Signal, Image and Video Processing, vol. 7, no. 3, pp. 423-436, May 2013.
[20] X. Hou, J. Harel, and C. Koch, “Image signature: highlighting sparse salient regions,” IEEE Trans. Pattern Analysis and Machine Intelligence, vol. 34, no. 1, pp. 194-201, Jan. 2012. [21] H. Zhou, H. Friedman, and R. von der Heydt, “Coding of Border Ownership in Monkey Visual Cortex,” J. Neuroscience, vol. 20, no. 17, pp. 6594-6611, 2000. [22] N. Ponomarenko, V. Lukin, A. Zelensky, K. Egiazarian, M. Carli, and F. Battisti, “TID2008-A database for evaluation of full-reference visual quality assessment metrics,” Advances of Modern Radioelectronics, vol. 10, pp. 30-45, 2009.
[9] M. Liu, G. Zhai, K. Gu, Q. Xu, X. Yang, X. Sun, W. Chen, and Y. Zuo, “A new image quality metric based on MIx-Scale transform,” Proc. IEEE Workshop on Signal Processing Systems, pp. 266-271, October 2013.
[23] E. C. Larson and D. M. Chandler, “Categorical image quality (CSIQ) database,” [Online]. Available: http://vision.okstate.edu/csiq
[10] K. Gu, G. Zhai, M. Liu, Q. Xu, X. Yang, and W. Zhang, “Adaptive high-frequency clipping for improved image quality assessment,” Proc. IEEE Int. Conf. Visual Communications and Image Processing, November 2013.
[24] H. R. Sheikh, Z. Wang, L. Cormack, and A. C. Bovik, “LIVE image quality assessment Database Release 2,” [Online]. Available: http://live.ece.utexas.edu/research/quality
[11] A. K. Moorthy and A. C. Bovik, “Blind image quality assessment: From scene statistics to perceptual quality,” IEEE Trans. Image Process., pp. 3350-3364, vol. 20, no. 12, December 2011. [12] M. A. Saad, A. C. Bovik, and C. Charrier, “Blind image quality assessment: A natural scene statistics approach in the DCT domain,” IEEE Trans. Image Process., pp. 3339-3352, vol. 21, no. 8, August 2012.
[25] K. Gu, G. Zhai, X. Yang, W. Zhang, and M. Liu, “Subjective and objective quality assessment for images with contrast change,” Proc. IEEE Int. Conf. Image Process., pp. 383-387, September 2013. [26] VQEG, “Final report from the video quality experts group on the validation of objective models of video quality assessment,” March 2000, http://www.vqeg.org/