PUL on benchmark data
1
Using Information Retrieval Methods for a Comparison of Algorithms to find differentially expressed Genes in Microarray Data. Alfred Ultsch DataBionics Research Lab, Department of Computer Science University of Marburg, D-35032 Marburg, Germany
[email protected] Technical Report, Marburg, September 2007 PUL is a novel algorithm for the identification of differentially expressed genes in two group microarray experiments. PUL is compared to other popular algorithms using published implementations. The comparison is based on established measurements in information retrieval (Recall and Precision). Surprisingly a clear ordering in performance of the algorithms was observed. PUL outperformed other algorithms by a factor of two. PUL was applied successfully in different practical applications. For these experiments the importance of the genes proposed by PUL were independently verified.
1
Introduction
There are several different algorithms published for the identification of differentially expressed (DE) genes in DNA microarray experiments. The microarrays in this type of experiment are from two different populations (groups) of specimen. Among the many genes on the microarrays, those genes are sought that are the most relevant for the distinction between the two populations. Usually such algorithms produce ordered lists of genes. The first genes on the list should be the most DE genes. I.e. those genes should be very relevant for the differences in the populations. Typically there are many genes measured on a microarray, but only a small percentage is really DE. In such a setting methods from Information Retrieval (IR) can be used for the comparison of the performance of algorithms. The identification of DE genes can be compared to a query for relevant literature in a library or, for example, questioning Google® for relevant web pages. Aim of a query is, to find as much relevant information as possible. In IR this is measured as Recall. Furthermore one does not want to be overwhelmed by information that is irrelevant to the given query. In IR this is measured as Precision. A retrieval algorithm is perfect if it delivers 100% in Precision and Recall. The advantage of these measurements is that the performance of the algorithms can be compared for all lengths of the gene lists. The difficult problem of deciding when differences among populations are irrelevant, is avoided.
2
Generation of a Benchmark Data Set (NBD)
In order to compare different methods for the identification of significant genes, a data set with known properties is used. The dataset was derived from experimental data from an experiment on neuroblastoma. Details of this data set are published in (Berwanger et al. 2002 and Gebhard et al submitted). Population size is 18 for arrays from patients with tumor stage 1 and 15 for patients with stage 4. There are 4608 genes measured on these spotted cDNA arrays. The genes were u-transformed (see below) and ordered according to difference in means. 3738 genes showed no significant change in expression between the two groups. See the following pixel figure.
University of Marburg, Databionics, Technical Report, October 2007
PUL on benchmark data
2
insignificant gene differences (u-transformed) 10 500
5
1000
1500 0 2000 -5 2500
3000
-10
3500 5
10
15
20
25
-15
30
Among the top 0.1% gene differences in population means (= 46 genes) 16 DE genes were selected. Eight genes with a positive difference between the groups and eight with a negative difference were randomly drawn. This set of definitive DE genes was replicated 5 times. For each replication 10 to 50% of values were replaced by measurements drawn randomly from insignificant DE genes. This gave a set of 6 *16 = 96 genes which are, respectively, over- or underexpressed in the two populations. differentially expressed genes,10-50% not DE added 8 10 6
20 30
4
40 2 50 0
60 70
-2
80 -4 90 -6
100 110 5
10
15
20
25
96 Successively less DE genes.
University of Marburg, Databionics, Technical Report, October 2007
30
-8
PUL on benchmark data
3
3738 not DE genes were randomly drawn from the data such that the gene expression showed no significant differences between stage 1 and stage 4. This was tested using array wise permutations of the data. A set of 645 genes were randomly drawn from a list ordered according the difference in means. For this, only genes with ranks between 200 and 1000 on this list were used. This ensures that the benchmark data also contains genes with borderline DE. Technical details of the construction of the benchmark data set, called NBD are given in (Ultsch 2007). In summary the benchmark data set NBD consists of the following types of gene expression data: 18 arrays in population 1, 15 arrays in population 2. Classes: 3738 unexpressed genes 645 borderline genes 96 differential expressed genes ============================== 4479 genes in total
Of the differential expressed genes 48 are overexpressed in population one and 48 underexpressed in population one. Finally all data is permuted case wise and within case and population. Data is written in the databionics *.lrn format: genes in lines, arrays in rows. Classification in *.cls format (. Since several algorithms can not handle missing values, imputation and z-transformation was performes
3
Other Methods
The simplest approach is to apply a z-transformation to each array and calculate the two-sample t-statistic. This method is called ZT. Details can be found, for example, in (Dudoit et al. 2000).
Significance Analysis of Microarrays (SAM) uses a modified t-like statistic (Tusher et al 2001). The version 1.25 of SAM as R package (samr) was used here. Pattern Analysis of Microarrays (PAM) is described in (Beckers et al., 2005). The PAM developers claim, that the PAM method to identify differential expressed genes gives more consistent results than SAM. The PAM software was obtained in September 2007 from: http://www0.gsf.de/ieg/groups/expresion/natural_variability. html. B-statistic uses the log posterior odds ratio that a gene is DE vs. not DE (Lonnstedt & Speed 2001). The B-statistic is estimated by empirical Bayes methods. The procedures for B-statisctics that are implemented in the limma R package version 2.9.17 using R. Version 2.4.1 for Windows (Smyth 2004) were used here. To account for multiple testing, control the false discovery rate, account for correlation of the variables (genes), and relieve the normality assumption underlying the statistics, a standard procedure of using a step down algorithm was applied. (Westfall and Young, 1993; algorithm 4.1). The data is permuted array wise p times. The t- (or B-) statistics are also calculated for this randomized data. The randomized value is then compared to the value from the non permuted experiment. The adjusted p-value (APV) is the fraction of t values from the populations not exceeding the values from the randomized data. The adjusted p-values model the error probability, that a gene is regarded to be differentially expressed. In the following a threshold for APV of 0.05 is used on p=500 permutations for all algorithms.
University of Marburg, Databionics, Technical Report, October 2007
PUL on benchmark data
4
4
PUL METHOD TO IDENTIFY DE GENES
Here we describe a new method to identify differentially expressed (DE) genes. There are four main ideas in this method: first, unit-transformation; second, mixture modeling using Gaussians and log normals; third, calculation of Bayes posterior probabilities; and finally, scoring for DE genes is based on (averaged) probabilities of belonging, respectively, to under- or overexpressed genes.
4.1
Unit transformation (u-transformation)
In order to compare the measurements of different microarrays (slides) the ranges of the measurements need to be normalized. Often a z-transformation is used for this. The result of a z-transformation is a mean of zero and unit variance for each array. With this transformation it is, however, not guaranteed that the distributions of different arrays are properly aligned.
0.5
PDE
0.4
0.3
0.2
0.1
0 -3
-2
-1
0 Data
1
2
3
Figure 1: Probability distributions of some z-transformed arrays Figure 1 shows the distribution of some arrays’ measurements. The probability density functions of the distributions are shown using the PDE method described in (Ultsch 2003). It can be seen that the arrays are not centered at zero and that the variances are not identical. Therefore a different procedure for the standardization of microarray data is proposed. In most microarray experiments the majority of genes are not influenced by the experimental conditions. In most cases the prominent distribution is caused by unspecific binding effects (USB) to the targets. Genes that are neither over- nor underexpressed (i.e. unexpressed genes) may randomly bind to the microarray spots. If there is no systematic error in the experimental setup, this distribution is a Gaussian N(mUSB,sUSB). We propose a variant of a z-transformation, called unit- or, abbreviated to u-transformation (Ultsch 2005). The u-transformation standardizes the values such that the distribution of the unspecific binding effects (USB) is transformed to a standard normal distribution (N(0,1)). Formula for u-transformation:
u=
x − mUSB sUSB
University of Marburg, Databionics, Technical Report, October 2007
PUL on benchmark data
5
The parameters of the u-transformation (mUSB and sUSB) are estimated by the Expectation Maximum (EM) procedure. For EM see, for example, (Bilmes 1997). Robust estimations for mean and s.d. are used as a starting point for the EM optimization steps. U-transformation has the effect that the Gaussian resulting from unexpressed genes forms a standard normal (N(0,1)) transformation. Figure 2 shows the result of this u-transformation on the same data as in Figure 1. The dashed line in Figure 2 is a standard normal distribution (N(0,1)).
0.45 0.4 0.35 0.3 0.25 0.2 0.15 0.1 0.05 0 -3
-2
-1
0
1
2
3
Figure 2: Unit transformed data for the same data as in Figure 1 Note that EM is a gradient descent algorithm and may converge to a local minimum. The results of the EM algorithms should therefore be checked. The PDE plots as used in fig. 1 and 2 and also QQ-plots are suitable tools for this cross checking (see Figure 4).
4.2
Modeling expressed genes as log normal distributions
Mircroarray dataresults from a mixture of three types of genes: unexpressed genes, underexpressed genes and overexpressed genes. Unexpressed genes form (if no systematic measurement error is present) a Gaussian. If the data is u-transformed this Gaussian is transformed to N(0,1). For PUL the under- and overexpressed genes are modeled by a log-normal distribution. The distributions are fitted to the data using EM. Figure 3 shows an example of the u-transformed data and the Log-Gauss-Log mixture model.
University of Marburg, Databionics, Technical Report, October 2007
PUL on benchmark data
6
0.4 0.35 0.3
PDE
0.25 0.2 0.15 0.1 0.05 0 -6
-4
-2 0 2 Log-Gauss-Log mixture model
4
6
Figure 3 Mixture Model optimized by EM, and compared to the empirical distribution. The quality of the mixture model can be estimated by a quantile/quantile plot (QQ-plot). The percentiles of the empirical distribution are compared to the percentiles of the mixture model. As can be seen in figure 4 the QQ-plot forms a straight line. This indicates that the log-Gauss-log mixture model is appropriate. 4
3
u-transformed data
2
1
0
-1
-2
-3
-4 -4
-3
-2
-1 0 1 Log-Gauss-Log mixture model
2
3
Figure 4: QQ-plot of the data vs. the mixture model
University of Marburg, Databionics, Technical Report, October 2007
4
PUL on benchmark data
4.3
7
Bayes posterior probabilities
With the model of the data described in the last subchapter the probability of a gene g belonging to one of the three distributions (unexpressed, underexpressed and overexpressed) can be calculated using the theorem of Bayes: the PUL value of a gene g is defined using these posterior probabilities: PULvalue(g) = p(g|overexpressed) – p(g|underexpressed) Where p(g|overexpressed) is the posterior probability calculated using Bayes theorem on the model developed in the previous subchapter. Analogously for p(g|underexpressed). The maximum PULvalue is 1, meaning that a measurement is from an overexpressed gene. The minimum PULvalue is -1, meaning that a measurement is from an underexpressed gene. PULvalues of 0 indicate that a measurement is from an unexpressed gene. This is particularly well suited to calculate differences among the different experimental populations. A difference of zero means no differential expression. An absolute difference around one means that genes are over or underexpresed in one population and unexpressed in the other. The maximum absolute difference is 2. This indicates a change from over- to underexpression or vice versa.
4.4
Gene Scoring in PUL
The gene list produced by PUL is sorted according to the PULscore, which is calculated as follows: for a gene g let m1 be a robust estimation of the mean PULvalue and s1 be a robust estimation of the s.d. of the PULvalues in population one. For population two m2, and s2 are obtained analogously. The relative sizes of the populations are w1 and w2.
PULscore ( g ) =
m1( g ) − m 2( g ) ( w1s1( g ) + w2 s 2( g )) + 1
PULscore is comparable to t-statistics. Instead of the differences in mean of the data, the difference in posterior probabilities (PULvalue) is used. As mentioned above, for definitive un- under- or overexpressed genes these PULvalues are 0, -1 and 1. The denominator for the differences in mean is basically the average s.d. in the different populations plus the difference from unexpressed to expressed genes (= 1). If the sum of s.d. in the populations is zero, then the PULscore is the absolute value of the differences in means.
5
INFORMATION
RETRIEVAL
METHOD
FOR
COMPARISON All the procedures described above for the identification of differentially expressed genes (ZT, SAM, B-statistics, PAM, PUL) produce lists of genes sorted according to a score. High values of the score should indicate that a there is a difference in gene expression in the two experimental populations (e.g. tumor stage 1 vs. tumor stage 4 in the BND data set). Low values should indicate that a gene is not differential expressed. Here an information retrieval (IR) approach is followed to measure the quality of the different algorithms (Baeza-Yates & Ribeiro-Neto (1999)). The gene lists produced by the different procedures can be regarded University of Marburg, Databionics, Technical Report, October 2007
PUL on benchmark data
8
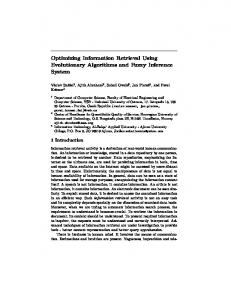
as results of a query for relevant genes in the set of all genes. Definitive relevant are the 96 differentially expressed genes. All other genes are irrelevant. For number s of genes in the list, the information retrieval measurements of recall and precision are calculated. Recall is the fraction of the relevant genes to the number of genes in the list (s). Precision is the fraction of differential expressed genes in the list of length s to the number of differential genes. A recall of 100% is trivial to achieve for a list consisting of all genes. Therefore recall alone is not enough. One needs to also take the number of non-differentially expressed genes into account. A perfect algorithm has both precision and recall of 100 %. The advantage of this IR approach is, that the performance for all lists of length s can be compared with a precision/recall graph (see Figures 5 and 6).
6
RESULTS s=448
100
s=192 PUL 90
s=448 s=448
s=96
80 70
s=448
Recall
60
s=192 SAM s=192
50
s=96
s=192 ZT
s=96 B-statistic s=96
40 30 20
s=448 s=192 PAM
10 0
s=96
0
10
20
30
40
50 Precision
60
70
80
90
100
Figure 5: Recall and Precision as a function of gene list length s for different algorithms to find DE genes Figure 5 shows the precision/recall graph for the methods ZT, B-statistics, SAM, PAM and ULP. Figure 5 shows the precision/recall plot of the algorithms. Note that the best performance is the right upper corner and the worst is the left lower corner. The points with the right number of relevant genes strue(=96), 2*strue(=192) and s = 10% of all the genes (=448) are marked by a circle in figure 5. Interestingly there is a clear hierarchy in performance of the algorithms. Lowest performance is shown by PAM. About 25% more in University of Marburg, Databionics, Technical Report, October 2007
PUL on benchmark data
9
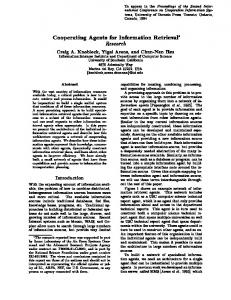
both Precision and Recall is delivered by the simple t-statistics (ZT). Next better is B-statistics with about 10% increase performance in Precision and Recall compared to ZT. About the same increase in performance compared to B-statistics is achieved by SAM. PUL outperforms SAM with a factor of 2 or 40% increase in Precision and Recall. Note that the results reported here are independent of the correct estimation of a cut-off value for differentially expressed genes. If the number of differentially expressed genes is estimated correctly (strue=96), PUL has a recall and precision in the 80-90% range, whereas SAM retrieves about 50% of correct genes and 50% irrelevant genes. If the true number of relevant genes is overestimated by a factor of 2 (s=192), PUL found more than 90% of the differential expressed genes with a precision of about 50%. SAM as the second best algorithm retrieved only 65% of the differential expressed genes with precision as low as 33%. PUL identifies the first 80% of the differential expressed genes right away. The same Recall is obtained by the other algorithms only with a far bigger number of genes (s>300). This implies that a large number of false positives are found. If the number of genes under consideration is rather large, for example 10% of the genes (s=448), PUL found practically all differentially expressed genes. In this case SAM retrieves about 90% of the relevant genes, ZT retrieves less than 70% and PAM less than 30%. In order to control the false discovery rate(FDR), adjusted p-values (APV) can be calculated for all algorithms. In figure 6 adjusted p-values (APV) are shown as result of 500 permutations of the arrays. The cutoff value for FDR is set at 0.05.
Adjusted p values < 5%, 500 permutations
100
s=448
90
s=192 PUL s=96
80 70 s=448
s=192 SAM
Recall
60 s=448
50 40
s=192 ZT
s=96
s=96B-statistics s=96
s=448 s=192
30 20 s=448 PAM
10 0
s=192 s=96 0
10
20
30
40
50 60 Precision
70
80
90
100
Figure 6: Precision/Recall graph with adjusted P-values for False Discovery Rate (FDR) control Practically the same hierarchy in performance as in the previous figure can be observed: PUL >> SAM > B-statistics > ZT >> PAM. ZT outperforms B-statistics, if the right number of relevant genes is overestimated. University of Marburg, Databionics, Technical Report, October 2007
PUL on benchmark data
7
10
DISCUSSION
The benchmark data set NBD was constructed such that all algorithms agree on the primary 16 genes to be DE. The clear distinction between the two populations was successively reduced on the 5 replicates of these genes. Furthermore 645 genes with borderline DE were included in NBD. This has the result that there might be borderline genes in NBD with differential properties that surpass the 96 presumably DE genes. Therefore a Precision and Recall value of 100% may be impossible to reach for any algorithm. On the other hand, NBD is hardly influenced by a particular method to calculate statistics for DE genes. This allows a rather fair comparison of the algorithms. The comparison of data from different experiments is a necessary prerequisite to make population wide measurements like averages or variances. Adjusting the data to overall measures like total means and total variance is a problem for leptokurtic data. The commonly used z-transformation has undesired results (see figure 1). The u-transformation ensures that the distribution from the majority of unexpressed genes (USB) is projected to a standard normal distribution (see figure 2). For u-transformed data it is feasible to find a suitable mixture model. The main part of the mixture, i.e. the unexpressed genes is defined. A log normal model for the over- and underexpressed genes seems to be appropriate as the QQ-plot shows (see figure 4). Gaussian models for these distributions either do not account for the leptocurtic shape of the overall distribution or, if large variances are chosen, such Gaussians allow large unwanted probabilities within the USB distribution. Microarray experiments often suffer from the problem of very few case data in the populations. The distribution of the measurements makes it difficult to properly estimate means and variances for a single gene. The scoring for the gene lists, however, has a critical dependency on good estimates of these parameters. The key problem here is that the absolute measurements for over- or underexpressed data may be arbitrarily large. The transition from data to posterior probabilities projects the data to the interval [-1 1].
The figure above compares the u-transformed measurements to PUL-values. It can be seen that measurements smaller than -4 are translated to -1. Values bigger than 4 are mapped to 1. Between -1 and 1 PUL-values are zero. This nonlinear transformation from measurements to qualitative membership values tremendously reduces the variances. Even extremely large absolute measurements do not dominate means and variances for PUL-values.
University of Marburg, Databionics, Technical Report, October 2007
PUL on benchmark data
11
If there are errors in a measurement these errors have only limited influence for PUL’s scores. For the t-statistics and B-statistics, however, the measurement errors may dominate. Measurements with large absolute values bias the t- and B-statistics towards an overestimation of a gene’s relevance. The calculation of adjusted p-values is also biased by such measurements. The results of the comparison show a performance ranking independent of the number of genes considered to be differentially expressed. For PAM it is claimed by the authors to deliver more appropriate results than SAM (see PAM’s webpage). This claim can be confirmed only for the first 2% of genes in the list. For a gene list length greater or equal to the right number of genes sought, PAM performed considerably worse than the other algorithms. The essential parameters for PUL are the parameters of the mixture model. These parameters are estimated from all the measurements on an array. A quality control of these estimations can be obtained using probability density plots of the model vs. the data (see fig. 3) with the PDE method described in (Ultsch 2003) and/or QQ-plots (see fig. 4). This assures the quality of the parameters. All methods to find differentially expressed genes are based on theoretical assumptions that are usually not fulfilled for experimental data. All methods are therefore just heuristics to point out interesting hypothesis which should be confirmed with independent experiments. In this paper a systematic comparison of the performance of the algorithms was undertaken. A benchmark data set with known properties allows the application of established methods for the assessment of quality. The newly proposed algorithm PUL was shown to outperform other algorithms by a substantial factor. In two practical applications with different types of microarrays (spotted and bead) practical results with external confirmation could be obtained. In the case of the neuroblastoma data, the survival prognosis was successful. In the CLL case PUL pointed out a regulatory pathway which could be confirmed in in-vitro experiments.
8
Summary
A novel algorithm is proposed for the identification of differentially expressed genes in two group microarray experiments. The algorithm, called PUL, is compared to other popular algorithms using published implementations. The comparison is based on measurements used in information retrieval (Recall and Precision). The advantage of this approach is that the gene lists produced by the algorithms can be compared for all list lengths. Surprisingly, a clear ordering in performance of the algorithms was observed: PAM