I n t e r f e r o m e t r y
Using InSAR to detect active deformation associated with faults in Suban field, South Sumatra Basin, Indonesia Richard A. Schultz, Khalid A. Soofi, and Peter H. Hennings, ConocoPhillips Xiaopeng Tong, formerly at Scripps Institution of Oceanography; currently at University of Washington–Seattle David T. Sandwell, Scripps Institution of Oceanography
Abstract Suban field in southern Sumatra, Indonesia, is a fractured carbonate/crystalline wet-gas reservoir in a tectonically active island-arc setting. Reservoir-scale right-oblique reverse faults and folds that have trapped the hydrocarbons have been related previously to deformation in the back-arc setting of Sumatra associated with oblique subduction of the Indo-Australian Plate at the Sunda trench. Increased well productivity in some parts of the field was inferred to correlate with completing wells in the damage zones of critically stressed faults. Satellite interferometry acquired in 2008 through 2011 involving specially stacked and filtered interferograms, following prior applications to heavy-oil fields and Arctic sea ice, reveals active deformation in Suban field. Several areas of localized subsidence potentially exceeding ~5 mm/yr have been identified in the field. Horizontal movements of comparable magnitude were resolved above the major right-oblique, critically stressed fault zone in the southwestern part of the field, corroborating wellbore-based inferences from the reservoir. Block-tectonic models constrained by GPS measurements across the entire Sumatra contractional orogen predict comparable magnitudes and directions for horizontal motions observed locally at Suban. The combination of InSAR and GPS-based platetectonic models provides a robust tool for monitoring the deformation of oil and gas fields in tectonically active areas. Introduction — Structural and tectonic setting of Suban field Suban field is a ConocoPhillips-operated gas-producing asset in the South Sumatra Basin, one of several sedimentary basins in the back-arc domain of Sumatra, Indonesia (Barber and Crow, 2005; Hennings et al., 2012). The field was discovered in 1998 and began to produce in 2003. The major structures at Suban, oblique-slip faults and related folds, strike northwest-southeast, parallel to the principal Neogene tectonic fabric of Sumatra and to the subduction zone ~ 400 km to the southwest (Figure 1). The principal fault uplifting the overall structure is a basement-rooted fault-propagation fold on the northeast flank. Damage zones of several smaller subparallel faults in the uplift provide good fluid-pressure communication within the field. Wells with the highest flow capacity relate to critically stressed faults and related fractures along the southwest bounding anticline, which is interpreted by 3D seismic data and wellbore stress analysis to be the result of strike-slip and reverse offsets along the southwest bounding fault. Comparison of stress states inferred from wellbores, seismically interpreted stratigraphic offsets, and structural architecture (in both map and cross-sectional views) with the 882
The Leading Edge
August 2014
tectonics on Sumatra and the direction of plate subduction (e.g., McCaffrey, 2009) suggested to Hennings et al. (2012) that the faults and deformation that control well productivity in Suban field are currently active and closely related to the subduction-zone tectonics. At the latitude of Suban field, oblique subduction of the Indian and Australian Plates beneath Southeast Asia occurs at a rate of 50–70 mm/yr (DeMets et al., 1994; Prawirodirdjo and Bock, 2004). The oblique convergence is partitioned into a trench-normal component, primarily accommodated along the Sunda subduction-zone megathrust, and right-lateral shear accommodated primarily along the Great Sumatran Fault. A series of large to great earthquakes along the Sunda megathrust has been documented since 1797 (e.g., Subarya et al., 2006; Chlieh et al., 2008; Prawirodirdjo et al., 2010). Rupturing along these slip patches has uplifted, tilted, and deformed Sumatra during these and previous events during at least Quaternary time. At least four large-magnitude (> 7) strike-slip earthquakes have occurred on land along the Sumatran fault (Sieh and Natawidjaja, 2000) since 1900 in the vicinity of Suban field (Sørensen and Atakan, 2008). The deformation that produced Suban field, including its
Figure 1. Locations of InSAR images (blue squares) and Suban field (red dot) shown on shaded relief map of Sumatra. After Hennings et al. (2012), Figure 1. AAPG©2012. Reprinted by permission of the AAPG whose permission is required for further use.
I n t e r f e r o m e t r y
stratigraphic and structural traps as well as its productivity, thus appears to be consistent with contemporary Sumatran tectonics. Conversely, monitoring of deformation at Suban could inform both production and seismic-hazard analysis (Abidin et al., 2010) in southern Sumatra. InSAR and GPS in southern Sumatra Satellite or geodetic data are available for most of Sumatra, including the Sumatran continuous Global Positioning System (GPS) array (SuGAr), which was established and monitored by Caltech’s Tectonics Observatory through 2008. The array is now being operated by the Earth Observatory of Singapore (McLoughlin et al., 2011). Prawirodirdjo et al. (2010) describe observations, mostly from northern Sumatra. Early work reported by Prawirodirdjo et al. (1997) shows that strain accumulation rates in northern Sumatra, 23–24 mm/yr, were comparable to those inferred from slip rates along the Sumatran fault by Sieh and Natawidjaja (2000) but were twice as large as those along the fault in central Sumatra, the southernmost part of the geodetic-survey network. Because slip rates are thought to increase along the Sumatran fault from southeast to northwest (e.g., Huchon and Le Pichon, 1984; Bock et al., 2003), in concert with increasing obliquity of subduction in that direction, the discrepancy between low measured slip rates and higher network shearstrain rates might suggest strain accumulation or slow aseismic creep along the Sumatran fault near the latitude of Suban. Although Meltzner et al. (2006) use data from advanced spaceborne thermal emission and reflection (ASTER), SPOT satellite GPS imagery, IKONOS satellite imagery, QuickBird imagery, and Landsat to investigate uplift and subsidence patterns of the northern part of Sumatra — around the epicenter of the 2004 great earthquake — to our knowledge, satellite interferometry (InSAR) techniques had not been attempted prior to our study to measure current deformation in southern Sumatra. An expanded treatment of the methods used in this study can be found in Schultz et al. (2014). InSAR analysis. Synthetic-aperture radar (SAR) data (L1.0) were obtained from the Advanced Land Observing Satellite (ALOS, aka Daichi) via an L-band (23.6-cm-wavelength) radar, which enabled good temporal coherence of the interferograms (Soofi and Sandwell, 2010). Stancliffe and van der Kooij (2001) and Khakim et al. (2012) demonstrate how L-band radar could be used to monitor production at the forested Cold Lake and Hangingstone heavy-oil fields in Canada, respectively (Gu et al., 2011). Twenty-six raw images (19 ascending and seven descending acquisitions) from mid2007 to the end of 2010 were used to perform interferometry analysis following the method of Tong et al. (2013). We combined the line-of-sight (LOS) motions measured in the two look directions to derive vertical and horizontal deformation maps of Suban field (Hennings et al., 2012) and vicinity. The data were processed with GMTSAR software (Sandwell et al., 2011) on a Linux platform. In the interferometry analysis, the raw binary radar images were preprocessed and focused to form full-resolution SAR images. All the SAR images were then aligned to one single image with 2D
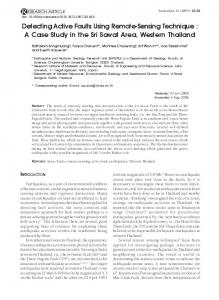
Figure 2. (a) Interferograms for ascending track T442. Eight of 14 long-time interferograms are of acceptable quality and were used in conjunction with 12 short-time interferograms in the stacking analysis. (b) Interferograms for descending track T117. Five of seven interferograms are of acceptable quality.
crosscorrelation techniques. The alignment needed to be accurate within 1 pixel (~ 10 m) to construct the interferograms. The phase caused by topography was removed with the SRTM digital elevation model (Farr et al., 2007). The residual phase was unwrapped with SNAPHU software (Chen and Zebker, 2000). Twenty high-quality interferograms were thereby obtained (Figure 2). These unwrapped phase maps were filtered individually with a high-pass Gaussian filter and then stacked to yield an average LOS velocity map of Suban field. The filtering step reduces the error sources associated with any ground motion at wavelengths greater than 20 km. The standard deviation of the LOS velocity was calculated to evaluate the uncertainties caused by various error sources such as clouds in the troposphere, ionosphere delay, inaccurate orbital ephemeris, or unwrapping errors. The standard deviations of the velocity map range from 0 to 100 mm/yr, with a mean of 12 ± 10 mm/yr. This error reflects the location of Suban field in a highly vegetated tropical area. Areas in the LOS velocity map with large noise (standard deviation > 20 mm/yr) were masked out. The final stacked and masked LOS velocity map ranged from approximately –23 to 33 mm/yr, with a standard deviation of ~ 1 mm/yr. All the results derived from the above analysis were coregistered in ArcGIS. Tectonic model constrained by GPS. The block-tectonic model of Prawirodirdjo et al. (1997) and Prawirodirdjo et al. (2010) was used to investigate the regional tectonic velocity field near Suban. The model represented Sumatra by three interacting elastic plate-tectonic blocks: the stable Sundaland shelf (including Sumatra and adjacent submarine portions), the forearc sliver to the southwest (Diament et al., 1992; McCaffrey, 2009), and the Indo-Australian Plate. August 2014
The Leading Edge
883
I n t e r f e r o m e t r y
Block motions were described as rigid-body rotations about poles of rotation, and block boundaries were defined by 3D fault surfaces with displacement discontinuities associated with the earthquake-rupture distribution along the Sunda subduction zone and the onshore Sumatra strike-slip fault zone. GPS velocities measured at stations throughout Sumatra (e.g., Abidin et al., 2010) were used as boundary conditions. Interseismic (post-2007) displacement vectors in the horizontal plane were calculated by using the Fortran program DEFNODE (McCaffrey, 1995), which uses the solution for dislocations in an elastic half-space. The model was verified by reproducing the results of Prawirodirdjo et al. (2010).
transect (Figure 4c). The similarity of uplift and topography along the transect implies that the current topography across this part of Suban field is related at least in part to reverse offsets along subjacent faults (Figure 4d) and related deformation. This result is consistent with the inference made by Hennings et al. (2012) that the faults in Suban field are currently active and related to the subduction tectonics across Sumatra. We modeled the interseismic displacement and strain field across Sumatra by using the block-tectonic model described above. The model predicts an average velocity of ~ 4 mm/yr to the northeast across Suban field (Figure 5). This northeast-directed displacement is generally consistent with other locations across Sumatra east of the Great Sumatran Fault, although the predicted magnitudes, orientations, and rates vary somewhat depending on location. The displacement direction is also generally consistent with the orientation of maximum horizontal compressive principal stress at various depths in Suban field (Hennings et al., 2012).
Results and implications The InSAR results suggest that uplift, subsidence, and horizontal contractional topographic changes occurred between 2007 and 2011 above Suban field (Figure 3). At least three areas of subsidence can be inferred, implying perhaps as much as 5 mm/yr during that time interval. Although those displacements are unlikely to have been caused by high stiffness of the producing interval, they might be related to the pressure depletion of production. This potential effect has not yet been evaluated in detail. Significant horizontal contraction and uplift, each as much as 5 mm/yr over the same time interval, also can be inferred from the interferograms. These changes occur near the approximate surface projection of what might be interpreted from subsurface seismic data as a contractional stepover (relay) zone at a depth of ~ 3 km along the major right-oblique overburden fault in the southwestern part of the field. Because this fault is at a shallower depth than a reservoir-cutting fault with similar kinematics (Figure 4), the InSAR signal might suggest movement along either or both faults. The pattern of uplift rate in this area is consistent with deformation of the ground surface above blind reverse or thrust faults in other contractional tectonic settings (e.g., King et al., 1988; Ma and Kusznir, 1993; Shamir and Eyal, 1995; CoFigure 3. (a) Vertical and (b) horizontal (easting) velocity maps obtained from the InSAR analysis hen, 1999; Schultz, 2000, 2011; for Suban. Contours are at an interval of 5 mm/yr; the dashed line is an approximate position at Okubo and Schultz, 2004) (Figure which the southwest right-oblique fault might tip out in the near surface. (c) SRTM topography. (d) Structure contours of Suban reservoir top at depth, corresponding approximately to the top 4a). Furthermore, the pattern of up- of the pre-Tertiary units (pre-T in Figure 4), with local highs in warm colors. After Hennings et lift rate across this southwest fault al. (2012), Figure 2. AAPG©2012. Reprinted by permission of the AAPG whose permission is required for further use. Note increased values of vertical velocity change (uplift) and horizontal (Figure 4b) generally correlates with velocity change (shortening) along the southwest oblique-slip fault. The location of a profile (A-B) the contemporary topography, as is shown by a solid line in parts (a) through (c). White dots represent gas wells and the black dot an shown by a southwest-to-northeast oil well. North arrow and scale bar are common to all panels. 884
The Leading Edge
August 2014
I n t e r f e r o m e t r y
As noted by Prawirodirdjo et al. (2010), the displacement-velocity vectors south of 5°S are consistent with a small degree of contemporary coupling on the subduction zone (i.e., the megathrust is slipping aseismically there), whereas vectors between 0.5° and 5°S are rotated counterclockwise from the Indo-Australian plate-convergence direction and
Figure 4. (a) Deformation associated with reverse or thrust faulting calculated by using the COULOMB 3D forward mechanical dislocation program (Toda et al., 1998, 2007). After Schultz (2011), Figure 3a. Reprinted by permission. Arrows are local displacement vectors showing rock displacements associated with the fault slip. (b) Comparison between InSAR vertical velocity change (positive values, uplift; negative, subsidence). (c) Surface elevation from SRTM digital elevation model. (d) Geologic section across part of Suban field. After Hennings et al. (2012), Figure 1. AAPG©2012. Reprinted by permission of the AAPG whose permission is required for further use. Part (d) is part of section line A-A´ shown in Figure 1 of this article. UM: Upper Miocene–Pliocene Kasai Formation; MM: Middle–Upper Miocene Air Benakat and Muara Enim Formations; pre-T: preTertiary crystalline and metamorphic basement. Location of profile A-B is shown in Figures 3a through 3c. 886
The Leading Edge
August 2014
were interpreted to result from a greater degree of contemporary coupling (i.e., locking) of the subduction zone over that latitude range. Prawirodirdjo et al. (2010) compare the interseismic velocity fields from before and after the subduction-zone rupture sequence of 2001 through 2007. The main difference is a modest counterclockwise rotation of the velocity vectors above the subduction zone, south of 5°S latitude, and reduction in their magnitude, both of which are consistent with a small degree of coupling since 2007 in that area. The apparent stability of the velocity-vector orientations east of the Sumatra fault, along with modest reductions in their magnitude, suggests that the deformation pattern on southern Sumatra did not change appreciably as a result of coseismic slip along the subduction zone, implying longer-term stability of local displacement orientations. The available SAR data for Suban field were limited to a three-year observation window. A follow-on L-band SAR satellite, ALOS-2, was launched in May 2014. The quality and resolution of InSAR velocity maps of Suban field and vicinity could be improved by incorporating measurements from this satellite. For example, a shorter repeat time of 14 days provided by ALOS-2 could enable InSAR time-series analysis so that temporal changes of the surface displacement potentially could be related to the details of deformation at the spatial scale of the field and larger. Combining such InSAR measurements with independent observations from GPS sites in Sumatra could provide a more complete description of the deformation field across southern Sumatra.
Figure 5. Horizontal interseismic velocity field for southern Sumatra predicted by the block-tectonic model.
I n t e r f e r o m e t r y
Conclusions Satellite interferometry reveals that Suban field is actively deforming in association with oblique subduction southwest of Sumatra, supporting previous inferences that were based on subsurface 3D seismic, wellbore, and production data from the field. Although InSAR has been used to monitor production activities at heavy-oil fields such as those in Alberta, Canada, this study demonstrates its utility for oil and gas fields in tropical and tectonically active areas as well as its potential for contributing to other applications, including seismic-hazard assessment. References
Abidin, H. Z., C. Subarya, B. Muslim, F. H. Adiyanto, I. Meilano, H. Andreas, and I. Gumilar, 2010, The applications of GPS CORS in Indonesia –– Status, prospect and limitation, in FIG (International Federation of Surveyors) Congress 2010 –– Facing the challenges –– Building the capacity. Barber, A. J., and M. J. Crow, 2005, Structure and structural history, in A. J. Barber, M. J. Crow, and J. S. Milson, eds., Sumatra: Geology, resources and tectonic evolution: Geological Society [London] Memoir 31, 175–233. Bock, Y., L. Prawirodirdjo, J. F. Genrich, C. W. Stevens, R. McCaffrey, C. Subarya, S. S. O. Puntodewo, and E. Calais, 2003, Crustal motions in Indonesia from Global Positioning System measurements: Journal of Geophysical Research: Solid Earth, 108, no. B8, 2367, http://dx.doi.org/10.1029/2001JB000324. Chen, C. W., and H. A. Zebker, 2000, Network approaches to twodimensional phase unwrapping: Intractability and two new algorithms: Journal of the Optical Society of America A, 17, no. 3, 401–414, http://dx.doi.org/10.1364/JOSAA.17.000401. Chlieh, M., J.-P. Avouac, K. Sieh, D. H. Natawidjaja, and J. Galetzka, 2008, Heterogeneous coupling of the Sumatran megathrust constrained by geodetic and paleogeodetic measurements: Journal of Geophysical Research, 113, no. B5, B05305, http://dx.doi. org/10.1029/2007JB004981. Cohen, S. C., 1999, Numerical models of crustal deformation in seismic zones: Advances in Geophysics, 41, 133–231, http://dx.doi. org/10.1016/S0065-2687(08)60027-8. DeMets, C., R. G. Gordon, D. F. Argus, and R. Stein, 1994, Effect of recent revisions to the geomagnetic reversal time-scale on estimates of current plate motions: Geophysical Research Letters, 21, no. 20, 2191–2194, http://dx.doi.org/10.1029/94GL02118. Diament, M., H. Harjono, K. Karta, C. Delplus, D. Dahrin, M. T. Zen Jr., M. Gérard, O. Lassal, A. Martin, and J. Malod, 1992, Mentawai fault zone off Sumatra: A new key to the geodynamics of western Indonesia: Geology, 20, no. 3, 259–262, http://dx.doi. org/10.1130/0091-7613(1992)0202.3.CO;2. Farr, T. G., P. A. Rosen, E. Caro, R. Crippen, R. Duren, S. Hensley, M. Kobrick, M. Paller, E. Rodriguez, L. Roth, D. Seal, S. Schaffer, J. Shimada, J. Umland, M. Werner, M. Oskin, D. Burbank, and D. Alsdorf, 2007, The shuttle radar topography mission: Reviews of Geophysics, 45, no. 2, RG2004, http://dx.doi. org/10.1029/2005RG000183. Gu, F., M. Y. S. Chan, and R. Fryk, 2011, Geomechanical-data acquisition, monitoring, and applications in SAGD: Journal of Canadian Petroleum Technology, 50, no. 6, 9–21, http://dx.doi. org/10.2118/145402-PA. Hennings, P., P. Allwardt, P. Paul, C. Zahm, R. Reid Jr., H. Alley, R. Kirschner, B. Lee, and E. Hough, 2012, Relationship between fractures, fault zones, stress, and reservoir productivity in the
Suban gas field, Sumatra, Indonesia: AAPG Bulletin, 96, no. 4, 753–772, http://dx.doi.org/10.1306/08161109084. Huchon, P., and X. Le Pichon, 1984, Sunda Strait and central Sumatra fault: Geology, 12, no. 11, 668–672, http://dx.doi.org/ 10.1130/0091-7613(1984)122.0.CO;2. Khakim, M. Y. N., T. Tsuji, and T. Matsuoka, 2012, Geomechanical modeling for InSAR-derived surface deformation at steaminjection oil sand fields: Journal of Petroleum Science and Engineering, 96–97, 152–161, http://dx.doi.org/10.1016/j.petrol.2012.08.003. King, G. C. P., R. S. Stein, and J. B. Rundle, 1988, The growth of geological structures by repeated earthquakes: 1: Conceptual framework: Journal of Geophysical Research: Solid Earth, 93, no. B11, 13307–13318, http://dx.doi.org/10.1029/JB093iB11p13307. Ma, X. Q., and N. J. Kusznir, 1993, Modelling of near-field subsurface displacements for generalized faults and fault arrays: Journal of Structural Geology, 15, no. 12, 1471–1484, http://dx.doi. org/10.1016/0191-8141(93)90007-W. McCaffrey, R., 1995, DEFNODE users guide: Rensselaer Polytechnic Institute: http://web.pdx.edu/~mccaf/www/defnode/defnode_ 060828.html, accessed 20 January 2014. McCaffrey, R., 2009, The tectonic framework of the Sumatran subduction zone: Annual Review of Earth and Planetary Sciences, 37, 345– 366, http://dx.doi.org/10.1146/annurev.earth.031208.100212. McLoughlin, I. V., K. J. Wong, and S. L. Tan, 2011, Data collection, communications and processing in the Sumatran GPS array (SuGAr): Proceedings of the World Congress on Engineering, 2. Meltzner, A. J., K. Sieh, M. Abrams, D. C. Agnew, K. W. Hudnut, J.-P. Avouac, and D. H. Natawidjaja, 2006, Uplift and subsidence associated with the great Aceh-Andaman earthquake of 2004: Journal of Geophysical Research: Solid Earth, 111, no. B2, B02407, http:// dx.doi.org/10.1029/2005JB003891. Okubo, C. H., and R. A. Schultz, 2004, Mechanical stratigraphy in the western equatorial region of Mars based on thrust fault-related fold topography and implications for near-surface volatile reservoirs: Geological Society of America Bulletin, 116, no. 5, 594– 605, http://dx.doi.org/10.1130/B25361.1. Prawirodirdjo, L., and Y. Bock, 2004, Instantaneous global plate motion model from 12 years of continuous GPS observations: Journal of Geophysical Research: Solid Earth, 109, no. B8, B08405, http:// dx.doi.org/10.1029/2003JB002944. Prawirodirdjo, L., Y. Bock, R. McCaffrey, J. Genrich, E. Calais, C. Stevens, S. S. O. Puntodewo, C. Subarya, J. Rais, and P. Zwick, and Fauzi, 1997, Geodetic observations of interseismic strain segmentation at the Sumatra subduction zone: Geophysical Research Letters, 24, no. 21, 2601–2604, http://dx.doi. org/10.1029/97GL52691. Prawirodirdjo, L., R. McCaffrey, C. D. Chadwell, Y. Bock, and C. Subarya, 2010, Geodetic observations of an earthquake cycle at the Sumatra subduction zone: Role of interseismic strain segmentation: Journal of Geophysical Research: Solid Earth, 115, no. B3, B03414, http://dx.doi.org/10.1029/2008JB006139. Sandwell, D., R. Mellors, X. Tong, M. Wei, and P. Wessel, 2011, Open radar interferometry software for mapping surface deformation: Eos, Transactions, American Geophysical Union, 92, no. 28, 234, http://dx.doi.org/10.1029/2011EO280002. Schultz, R. A., 2000, Localization of bedding plane slip and backthrust faults above blind thrust faults: Keys to wrinkle ridge structure: Journal of Geophysical Research: Planets, 105, no. E5, 12035–12052, http://dx.doi.org/10.1029/1999JE001212. Schultz, R. A., 2011, Relationship of compaction bands in Utah to Laramide fault-related folding: Earth and Planetary Science August 2014
The Leading Edge
887
I n t e r f e r o m e t r y
Letters, 304, nos. 1–2, 29–35, http://dx.doi.org/10.1016/j. epsl.2011.01.001. Schultz, R. A., X. Tong, K. A. Soofi, D. T. Sandwell, and P. H. Hennings, 2014, Satellite interferometry and the detection of active deformation associated with faults in Suban field, South Sumatra Basin, Indonesia: 38th Annual Convention and Exhibition, Indonesian Petroleum Association, Proceedings. Shamir, G., and Y. Eyal, 1995, Elastic modeling of fault-driven monoclinal fold patterns: Tectonophysics, 245, nos. 1–2, 13–24, http:// dx.doi.org/10.1016/0040-1951(94)00250-D. Sieh, K., and D. Natawidjaja, 2000, Neotectonics of the Sumatra fault, Indonesia: Journal of Geophysical Research: Solid Earth, 105, no. B12, 28295–28326, http://dx.doi.org/10.1029/2000JB900120. Soofi, K. A., and D. Sandwell, 2010, Long time span interferograms and effects of snow cover on interferometric phase at L/C-bands: Poster presented at the Fourth Joint PI Symposium of ALOS Data Nodes for ALOS Science Program. Sørensen, M. B., and K. Atakan, 2008, Continued earthquake hazard in northern Sumatra: Eos, Transactions, American Geophysical Union, 89, no. 14, 133–134, http://dx.doi.org/10.1029/2008EO 140001. Stancliffe, R. P. W., and M. W. A. van der Kooij, 2001, The use of satellite-based radar interferometry to monitor production activity at the Cold Lake heavy oil field, Alberta, Canada: AAPG Bulletin, 85, no. 5, 781–793, http://dx.doi.org/10.1306/8626C9FB-173B11D7-8645000102C1865D. Subarya, C., M. Chlieh, L. Prawirodirdjo, J.-P. Avouac, Y. Bock, K. Sieh, A. J. Meltzner, D. H. Natawidjaja, and R. McCaffrey,
2006, Plate-boundary deformation associated with the great Sumatra-Andaman earthquake: Nature, 440, no. 7080, 46–51, http://dx.doi.org/10.1038/nature04522. Toda, S., R. S. Stein, J. Lin, and V. Sevilgen, 2007, Coulomb 3: Graphic-rich stress change and deformation software for earthquake, tectonic, and volcano research and teaching: Mac/PC/ Linux application, http://www.coulombstress.org/, accessed 20 January 2014. Toda, S., R. S. Stein, P. A. Reasenberg, J. H. Dieterich, and A. Yoshida, 1998, Stress transferred by the 1995 Mw = 6.9 Kobe, Japan, shock: Effect on aftershocks and future earthquake probabilities: Journal of Geophysical Research, 103, B10, 24543–24565, http:// dx.doi.org/10.1029/98JB00765. Tong, X., D. T. Sandwell, and B. Smith-Konter, 2013, High-resolution interseismic velocity data along the San Andreas fault from GPS and InSAR: Journal of Geophysical Research: Solid Earth, 118, no. 1, 369–389, http://dx.doi.org/10.1029/2012JB009442.
Acknowledgments: Lynette Prawirodirdjo, Rob McCaffrey, and Yehuda Bock advised on the block-tectonic model; Scott Keough helped with the figures. Suggestions by technical editor Casey Donohue sharpened the presentation. The ALOS PALSAR L1.0 data were obtained through the Alaska Satellite Facility (ASF). ConocoPhillips, ConocoPhillips Indonesia, and SKK Migas are thanked for granting permission to publish this article. Corresponding author:
[email protected]
2014 CENTRAL & SOUTH AMERICA HONORARY LECTURER
Practical aspects of regularization and interpolation of (5D) seismic data Mauricio D. Sacchi University of Alberta | Edmonton, AB, CANADA
Reconstruction is an important preconditioning module before imaging and amplitude-variation-with-azimuth studies. This talk examines current strategies and algorithms for prestack data reconstruction with particular attention paid to techniques used to reconstruct 5D volumes. To see Mauricio Sacchi’s full itinerary or to view previous DL and HL presentations, visit: www.seg.org/hl
Schedule 12 August | General Roca, Argentina Universidad Nacional de Rio Negro 14 August | Buenos Aires, Argentina Asoc Argentina de Geol y Geof Petroleros (AAGGP) 15 August | La Plata, Argentina Sociedad Geofisica de la Universidad Nacional de La Plata 18 August | Rio de Janeiro, Brazil Univ. of Fed. Do Rio de Janeiro Geophysical Society 18 August | Niteroi, Brazil Univ. Federal Fluminense Geophysical Society 19 August | Rio de Janeiro, Brazil Observatorio Nacional 20 August | Campinas, Brazil University of Campinas Geophysical Society 21 August | Salvador, Brazil Univ. Federal Da Bahia Geophysical Society 25 August | Natal, Brazil Federal University of Rio Grande do Norte
Sponsored by Shell
27 August | Bélem, Brazil Federal Univ. of Para Geophysical Society 22 September | Bucaramanga, Colombia Univ. Industrial de Santander Geophysical Society 23 September | Medellin, Colombia National Univ of Colombia, Medellin branch
888
The Leading Edge
August 2014