Using Intermediate Models and Knowledge Learning to Improve Stress Prediction Alban Maxhuni1 , Pablo Hernandez-Leal2 , Eduardo F. Morales2 L. Enrique Sucar2 , Venet Osmani3 , Angelica Muńoz-Meléndez2 , and Oscar Mayora3 1
2
DISI, University of Trento, Via Sommarive 9, Povo - 38123 Trento, Italy,
[email protected], INAOE - Instituto Nacional de Astrofísica, Óptica y Electrónica, Sta. María Tonantzintla Puebla, Me´ xico pablohl,esucar,munoz,
[email protected] 3 CREATE-NET, Via alla Cascata 56/D Povo - 38123 Trento - Italy vosmani,
[email protected]
Summary. Motor activity in physical and psychological stress exposure has been studied almost exclusively with self-assessment questionnaires and from reports that derive from human observer, such as verbal rating and simple descriptive scales. However, these methods are limited in objectively quantifying typical behaviour of stress. We propose to use accelerometer data from smartphones to objectively quantify stress levels. Used data was collected in real-world setting, from 29 employees in two different organisations over 5 weeks. To improve classification performance we propose to use intermediate models. These intermediate models represent the mood state of a person which is used to build the final stress prediction model. In particular, we obtained an accuracy of 78.2% to classify stress levels. Key words: Motor activity, stress prediction, smartphones
1 Introduction ver the last decades there has been rising concern worldwide about the growth and negative impact of work-related stress. The prevalence of stressrelated illnesses such as burnout has increased dramatically in the European Union (EU) [1, 2]. Recent studies show that stress is ranked as a second most common work-related health problem across the members of the EU. In the Fourth European Working Conditions Survey conducted in 2015, 22% of workers from the EU have reported the impact of work-related stress [2]. Furthermore, a high prevalence of stress has also been reported in USA, where 55% of employees have reported increased workload having a significant impact on physical and mental health [3]. Recent studies show that individuals with high-stress were accompanied by physical and psycho-social complaints and decreased work-control [4].
O
2
Maxhuni et al.
To date, current approaches for measuring stress rely mostly on self-reported questionnaires [1]. This presents an issue for effective measurements, due to subjectivity factors. For example, employees might be more predisposed to report information in their favour or in the favour of their organisation, rather than reporting their true health state. To overcome these issues, smartphones are becoming suitable means to carry out these kinds of studies, due to their availability, rich set of embedded sensors and their capacity to be unobtrusive for the subjects [5, 6, 7, 8]. Motor activity-related behaviour (i.e. body hyperactivity, trembling, uncontrollable movement, hand movement) has shown association with perceived stress[9]. In the context of our study, the following research questions are put forth: – Is there a relationship between motor activity features that can be automatically extracted from a accelerometer sensor embedded on smart phones and the self-reported stress levels? – Is it possible to improve stress detection by incorporating intermediate, hidden, variables related to the subjects’ mood, before building the final model for predicting stress? The present work tries to answer both these research questions by comparing standard stress measurement questionnaires and motor activity behaviour during phone conversations. We performed an experimental analysis using real world data. While, we have previously reported on the use of accelerometer data to estimate stress levels [5], this study differs from that work in two important aspects: – The use semi-supervised learning to complete the models for subjects with missing data. – The induction of intermediate models to predict mood variables, which are incorporated in the final model in order to improve the accuracy of the predictions. Our results show that using standard supervised models we achieved an accuracy of ≈ 65%. This measure is increased to ≈ 69% when using the semisupervised methods and to ≈ 71% when using intermediate models. Finally, combining semi-supervised learning and intermediate models we achieve an accuracy of ≈78.2%; a notable improvement over the initial score. The rest of this paper is organized as follows. Section 2 reviews related work on stress detection based on current technology. The study methodology, data acquisition, and feature extraction are presented in Section 3. The proposed approach of intermediate models is presented in Section 4 and experiments are presented in Section 5. Finally, the conclusions of the study are presented in Section 6.
Using Intermediate Models to Improve Stress Prediction
3
2 Related Work Several methods have tried to infer stress based on physiological signals, such as heart-rate variability, blood pressure, body temperatures and respiration [10],[11]. However, the use of physiological sensors has some limitations: – sensors may have a large size to cover many signal types [10], – sensors (e.g., skin conductance sensor) limit the movement of the subjects [11] – sensors increase the discomfort [12] since they need to be carried all the time. The miniaturization of wearable sensors has made it possible to include them in smartphones. Recently, there is interest in inferring stress using those sensors, since they are a personal and common accessory among people. A summary of the works aiming at stress detection are described in Table 1. The work in [13] proposed a method for detecting stress based on speech analysis and the variation of speech articulation using smartphones. The authors have reported a predictive accuracy of stress of 81% and 76% for indoor and outdoor environments, respectively, using the vocal production of 14 subjects. However, in real-life activities this approach may lead to misinterpretation of speech and therefore of emotion. In order to infer relationship dynamics of people and behaviour changes in daily activities, smartphones have been suggested as a promising candidate to obtain user’s context. Research work using smartphones for long-term stress monitoring has collected many types of contextual data (e.g., physical activities, social activities and locations) that could help in inferring stress from behaviour changes. In this line, “MoodScope”[14] is a self tracking system to help users manage their mood. The system detects user’s mood from smartphones usage data, such as email messages, calls and SMS logs, application usage, web browsing histories and location changes. The authors reported an initial 66% accuracy of subjects’ daily mood, improving to 93% after two months of training. In another relevant work, Bauer and Lukowicz [15] aimed at recognizing stress from 7 students before and after an exam period. The assumption is that students are likely to be under stress during the exam sessions. They acquired data from smartphones (location, social proximity through Bluetooth, phone calls and SMS logs) reporting an average accuracy of 53% during the exam session. In [16] the authors monitored 18 subjects for a period of 5 days. In addition to smartphone features they included a wrist sensor. In order to recognize stress levels, the authors applied correlation analysis and reached a 75% accuracy using machine learning techniques to classify stress moments. Similarly, Muaremi et al. [17] measured smartphone mobility data (phonecalls, SMS, location and physical activity) and wearable Heart Rate Variability (HRV) sensor data to classify perceived stress. The authors emphasize the importance of recording human voice as a potential source for non-intrusive stress detection. The authors at [16] propose to infer work-relevant stress events using an external hardware (i.e., HRV) and sensor measurements obtained from smartphones. Furthermore, in [18] the authors used context information from
4
Maxhuni et al.
the environment, such as weather condition, social proximity obtained by Bluetooth scanning, call logs, SMS logs, and self-reported surveys about personality traits to predict stress events. Table 1: Main related works in Stress Detection showing the features and details. Study
Items measured
Controlled/ Uncontrolled Setting Kim et al.[19] Heart Rate Variability (HRV) controlled Lu et al.[13] Smartphone (Speech analysis) Both Bauer et al.[15] Smartphone (Location, bluetooth, Uncontrolled phone-call and SMS) Likamwa et al.[14] Smartphone (E-mails, Call and SMS Unknown logs, application usage, web browsing histories and location changes) Sano et al.[16] Wrist sensors and Smartphone Uncontrolled (Phone usage duration, phone calls and SMS logs) Muaremi et al.[17] HRV and Smartphone (Phone- and Uncontrolled SMS logs, Location, Audio Stress Response) Bogomolov et al.[18] Smartphone (Call logs, SMS, blue- Uncontrolled tooth and weather)
Obtrusiveness Level High High Medium High
Medium
High
Medium
As presented in Table 1, recent studies have explored the potential of physiological signals for measuring stress related signs from sensor data (e.g., Galvanic Skin Response (GSR), Electro-Cardiogram (ECG)) and smartphone sensors (e.g., location, audio recording). However, there are several concerns about using physiological sensors, basically due to their obtrusiveness. In contrast, we explore the potential of using a single sensor with the aim of detecting perceived stress levels. We choose to use accelerometer sensor due to their advantages (non-visual and non-auditory) and thus mitigate privacy concerns [20, 21]. 2.1 Motor Activity Monitoring Currently, the clinicians assess motor activity in laboratory settings. Studies measuring level of motor activity in psychological stress have typically used traditional monitoring with paper and pencil diaries, and questionnaires [22]. Monitoring motor activity during sleep may be measured by actigraphs [23] (using piezoelectric accelerometer). However, little is known if data captured from an actigraph could provide motor activity characteristics in perceived stress level in working environments. Smartphones are a good candidate for monitoring motor activity behaviour patterns in daily activities. Information from smart phones enables easier monitoring and tracking of people than traditional methods, as most people already carry a smartphone so no additional sensors are required. Another benefit of using this technology is that other information (such as phone calls, location, use of social networks) can be obtained and included. In this paper, we collect data from accelerometers during phone calls to infer motor activity changes in working employees.
Using Intermediate Models to Improve Stress Prediction
5
3 Data preparation This section presents how the data was collected and the feature extraction process. 3.1 Data Collection In this research work, we focus on analysing accelerometer raw data during phone conversation, where we are sure that the subjects are holding their smartphones. This type of measurement has the advantage of their availability and unobtrusiveness. We believe that analysing data collected from accelerometer readings during the phone conversations provide adequate information for classifying the perceived stress that can be also used to show the trajectory of perceived stress (e.g., low-to-high, high-to-low) in working environments. The second type of data includes subjective information related to subjects’ perceived stress, job-demands and mood states. We developed a questionnaire in a smart phone application to assess psychological variables related to work stress. The questionnaire is clinically validated to capture users perceived stress and mood states of the employees at work. Three times a day the questionnaires appeared automatically (9am -at the beginning of the work, 2pm -around noon, and 5pm -before leaving workplace). The questionnaire was derived from the POMS (Profile of Mood State) scale [24] which has two dimensions related to affect of mood states, including, “Positive Affect” (PA) (e.g., Cheerful, Energetic, Friendly) and “Negative Affect” (NA) (e.g., Tensed, Anxious, Sad, Angry) and the rest measures disengagement from work, where questions were presented in mixed order. Each question has five response alternatives, ranging from 1 (absolutely agree) to 5 (absolutely disagree). The answers were stored on the mobile device and constituted part of the analysis. For the purpose of our analyses, the score distribution has been segmented into three regions, which in our case correspond to three ordinal classes: (“low” or “poor”), when score < 3; (“moderate” or “fair” ), when score = 3; and (“high” or “sufficient”), when score > 3. For this study, we analysed the information from 29 subjects1 in their work environments, with data collected during their phone conversation and selfreported stress. In total, we obtained 7189 phone calls, however, we have only 5767 labeled instances or 80.22% useful data of the total phonecalls. Table 2 shows the number of times that are associated with each stress level (“high”, “moderate”, and “low”). Results show that half of the time the user perceived some level of stress and that during stress-less days the subjects have a higher amount of phone calls. 3.2 Feature Extraction From the raw accelerometer data a total of 30 features (10×3 - for all Minimum, Maximum and Mean) from the frequency domain were extracted (as shown 1
One of the subjects had very few phone calls recorded during the trial and was removed from the study.
6
Maxhuni et al.
Table 2: Number of Phone-Calls by Perceived Stress Level (SL). Incoming: Outgoing: Missing: Total instances: %
Nr.Phone Calls High SL Moderate SL Low SL 1696 (100%) 355 (20.9%) 511 (30.1%) 830 (48.9%) 2912 (100%) 547 (18.7%) 839 (28.8%) 1526 (52.4%) 1159 (100%) 220 (18.9%) 405 (34.9%) 534 (46.1%) 5767 1122 1755 2890 100% 19.46% 30.43% 50.11%
Table 3: Frequency domain features used in the study, where the lower row means that we extracted the minimum, maximum and mean values for all the frequency domain features. Frequency Domain FFT Sum Energy FFT Mean Energy FFT Std.Dev. Energy Peak Power Peak with DFT Bin Peak Magnitude Entropy DFT Energy Frequency Domain Entropy Frequency Domain with DFT For all: Min, Max, Mean
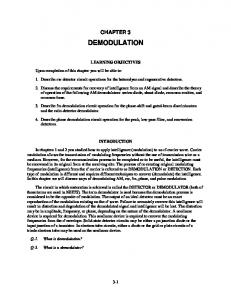
in Table 3). Feature extraction was performed on non-overlapping fixed length windows of 128 samples (25.6 seconds each). We used Fast Fourier Transform (FFT) and discrete Fourier Transform (DFT) to investigate the strength of motor activity signals during phone conversations2 . Since we aim at understanding motor activity behaviour around the phone conversation, we keep the following accelerometer segments: – One minute before the phone conversation, – The reading from the entire duration of the phone call. – One minute after the conversation ended. Figure 1 depicts the data collection, feature extraction (intensity of phone handling during phone conversation by computing features from frequency domain) and prediction process presented in this work.
4 Stress modelling using intermediate models In this section we describe the proposed approach that combines intermediate models and semi-supervised learning for estimating stress levels based on smart phones. 4.1 Intermediate Models The information provided by the users through the questionnaires is useful, however, it is a tedious task for each user. In this research we propose to predict 2
Phone conversations with less than 10 seconds were discarded in our dataset.
Using Intermediate Models to Improve Stress Prediction
7
Accelerometer Frequency Domain Features
Accelerometer Frequency Domain Features
Accelerometer Frequency Domain Features
Fig. 1: Proposed approach: data collection, feature extraction and prediction for classifying stress at work of employees. the mood variables associated to the questionnaires using the data from the smartphone to alleviate the user from this burden. Then, we use the predicted mood variables with the rest of the data from the smartphones to predict the stress levels. We call the models that predict the mood variables from the questionnaire intermediate models as their are used as input for the final predictive model. Although the use of additional variables, such as latent variables, have been previously used in the literature, we are not aware of research that aims at building an intermediate model that can then be used as input for the final model. Figure 2 illustrates the procedure for building the intermediate models. We train a classifier to predict the information from the questionnaires using the features extracted from the smartphone (feature extraction and Q01 in the figure, to create a model – intermediate model – that can predict the variables of the questionnaire). We then use the information from the smarphones and the predicted values from the intermediate model (q10 in the figure) to create model that can predict the level of stress. In this study, we used six variables derived from NA and PA (3 per each mood affect) to build 6 intermediate models. We train each classifier separately using each the self-reported questionnaires derived from the ’Positive Mood Affect (PA)’ and the ’Negative Mood Affect (NA)’. In the prediction stage, the intermediate models use the information from the smartphones to predict a weighted set of mood variables based on the accuracy
8
Maxhuni et al.
of each model. Then all the data from the smartphones and the mood variables are used as input for the final stress model.
Features Extraction
q'1
S1
Model S1
Model Q'1
Q'1
Fig. 2: Intermediate Models. Based on the accelerometer data from the smart phones, 30 frequency domain features are extracted. These are used to build the intermediate models for the mood variables, Q1 ; and the model for stress, S1 . In the prediction stage both models are combine via a weighted linear combination to predict the stress level.
Lt
Labeled data L
Lt
Lt Labeled data L
Lt Labeled data L
Labeled data L
Ut Ut
Ut Ut
Fig. 3: Semi-Supervised Learning Method (SSL), where L represents labeled instance, U unlabeled instances, and t number of iterations, L = Lt ∪ Ut
4.2 Semi-supervised learning In real applications missing labeled instances are a common issue and the standard supervised approaches ignore the unlabeled instances. But this information, even when it is not complete, can be helpful and should not be discarded. Semisupervised learning (SSL) [25] has been suggested as a method aiming to address this issue. The main objective of semi-supervised learning is to learn from both labeled and unlabeled data, i.e. by exploiting unlabeled samples to improve the learning performance. For this study we consider one of the most common methods of SSL called Self-Training [25]. This method works by building a classifier using the labeled examples and use it to predict the class of all the unlabeled instances. The
Using Intermediate Models to Improve Stress Prediction
9
predicted classes with high confidence from the classifier are added as new labeled examples. This augmented labeled set is used to build a new classifier and the cycle is repeated until all the unlabeled instances have been incorporated into the training set or until there is no more examples in the unlabeled set with high confidence (see Figure 3).
5 Experiments Our experiments have the following objectives: – Compare the performance of different classifiers on the data. – Assess the effect of intermediate models to enhance the knowledge of perceived stress in employees. – Use SSL to address the problem on how to use information from unlabeled data to enhance classification accuracy. For all the experiments, we used Weka’s [26] classifiers with their default parameters. We build a model for each subject and performed a 10-fold cross validation for all the experiments; we report the global accuracy, precision, recall and f-score values. Table 4 show the results using different classifiers. In the first experiment we compare the performance of the classifiers using a supervised and a semi-supervised learning (SSL) algorithms. In the second experiment we analyse the impact of using the intermediate models, with and without SSL. In our data set, more than 27.6% of the phone conversation did not have an associated stress level (the user did not answer the questionnaire). To address this issue, we used the Self-Training Method described above. We followed a simple approach where we divided the data into ten folds, where the training data was used to classify the unlabeled data (as shown in Figure 3), as threshold for the confidence we used ≥ 80% for the highest classified value. Then we used all the classified data with the original training set to produce an extended training set. As can be seen from the results adding information from generated from SSL and intermediate models improves the results in terms of accuracy, precision, recall and F-measure for all the classifiers, in some cases as for C4.5 the improvement is nearly 10%. By incorporating the intermediate models, a further improvement is obtained in both cases, with and without SSL. As it can be observed in Table 4, the best results are obtained by combining SSL and the intermediate models, and in particular with the random forest classifier.
6 Conclusions In this paper we presented a study of how to classify the perceived stress of employees from accelerometer data extracted from smart phones during phone conversations. We used real data from employees during 8 working weeks on unconstrained conditions. We extracted several features to analyse the motor
10
Maxhuni et al.
Table 4: Comparison in terms of accuracy, precision, recall and F-measure of supervised learning (Sup), semi-supervised learning (SSL) and using intermediate models (IM) with different classifiers for predicting perceived stress. Algorithm C4.5
Accuracy: (±SD) Precision: Recall: F-Measure: Random Accuracy: Forest (±SD) Precision: Recall: F-Measure: AdaBoost.M1 Accuracy: (±SD) Precision: Recall: F-Measure: SVM Accuracy: (±SD) Precision: Recall: F-Measure: Bagging Accuracy: (±SD) Precision: Recall: F-Measure:
Sup (%) SSL (%) Sup+IM (%) SSL+IM (%) 59.24 (±15.40) 58.43 59.23 58.68 65.50 (±12.72) 61.49 65.50 61.71 61.88 (±17.21) 54.19 61.88 56.24 60.59 (±16.81) 48.29 60.59 51.91 64.67 (±15.15) 58.46 64.67 60.26
68.66 (±15.53) 68.12 69.07 68.72 69.21 (±12.91) 65.76 69.21 65.56 63.51 (±15.57) 54.91 63.51 56.91 61.70 (±16.53) 52.96 61.71 54.09 69.48 (±13.62) 64.85 69.47 65.56
67.51 (±15.21) 66.20 67.51 66.47 71.68 (±12.98) 68.15 71.49 68.58 66.51 (±16.40) 59.82 64.29 59.95 68.70 (±15.84) 63.42 66.60 63.62 68.70 (±15.80) 63.24 66.42 63.36
77.24 (±16.80) 74.43 74.66 73.81 78.20 (±12.00) 73.09 75.45 72.74 75.18 (±16.76) 65.14 56.33 57.36 77.11 (±15.84) 69.03 72.67 68.89 77.11 (±15.84) 68.80 68.13 67.67
activity-related behaviour from different users. To deal with unlabeled data we propose the use of semi-supervised learning techniques. Additionally, we developed a novel approach to incorporate unobserved variables, intermediate models. We experimentally evaluated the impact of using SSL, intermediate models and both of them, using different base classifiers. The proposed approach for creating intermediate models has been shown to increase the prediction of the stress level of the users using the data derived from motor activity; from 61.5% using the standard supervised methods to ≥78% after applying intermediate models and SSL. A future work we would like to analyse in more depth the models obtained from each person in order to obtain clusters of people who behave similarly; this could help to build prediction models for new users with few data.
Using Intermediate Models to Improve Stress Prediction
11
References 1. P. Näätänen, V. Kiuru, Bergen burnout indicator 15, Edita, 2003. 2. European foundation for the improvement of living and working conditions, Fourth European Working conditions Survey. URL http://www.eurofound.europa.eu/ewco/surveys/EWCS2005/index.htm 3. Stress in america., American Psychological Association. URL http://apa.org/news/press/releases/stress/index.aspx?tab=2 4. M. Milczarek, E. Rial-González, E. Schneider, OSH [Occupational safety and health] in figures: stress at work-facts and figures, Office for Official Publications of the European Communities, 2009. 5. E. Ceja, V. Osmani, O. Mayora, Automatic stress detection in working environments from smartphones’ accelerometer data: A first step, Biomedical and Health Informatics, IEEE Journal of PP (99) (2015) 1. 6. R. Ferdous, V. Osmani, J. B. Marquez, O. Mayora, Investigating correlation between verbal interactions and perceived stress, in: Engineering in Medicine and Biology Society (EMBC), 2015 37th Annual International Conference of the IEEE, IEEE, Milano, 2015. 7. P. Hernandez-Leal, A. Maxhuni, L. E. Sucar, V. Osmani, E. F. Morales, O. Mayora, Stress Modelling Using Transfer Learning in Presence of Scarce Data, in: Ambient Intelligence for Health, Springer International Publishing, Puerto Varas, Chile, 2015, pp. 224–236. 8. V. Osmani, R. Ferdous, O. Mayora, Smartphone app usage as a predictor of perceived stress levels at workplace, in: 9th International Conference on Pervasive Computing Technologies for Healthcare, IEEE, 2015. 9. C. A. Morgan III, G. Hazlett, S. Wang, E. G. Richardson Jr, P. Schnurr, S. M. Southwick, Symptoms of dissociation in humans experiencing acute, uncontrollable stress: a prospective investigation, American Journal of Psychiatry. 10. J. Bakker, M. Pechenizkiy, N. Sidorova, What’s Your Current Stress Level? Detection of Stress Patterns from GSR Sensor Data, in: Data Mining Workshops (ICDMW), 2011 IEEE 11th International Conference on, 2011, pp. 573–580. 11. T. Roh, K. Bong, S. Hong, H. Cho, H.-J. Yoo, Wearable mental-health monitoring platform with independent component analysis and nonlinear chaotic analysis, in: Engineering in Medicine and Biology Society (EMBC), 2012 Annual International Conference of the IEEE, IEEE, 2012, pp. 4541–4544. 12. J. Wijsman, B. Grundlehner, H. Liu, H. Hermens, J. Penders, Towards mental stress detection using wearable physiological sensors, in: Engineering in Medicine and Biology Society, EMBC, 2011 Annual International Conference of the IEEE, IEEE, 2011, pp. 1798–1801. 13. H. Lu, D. Frauendorfer, M. Rabbi, M. S. Mast, G. T. Chittaranjan, A. T. Campbell, D. Gatica-Perez, T. Choudhury, Stresssense: Detecting stress in unconstrained acoustic environments using smartphones, in: Proceedings of the 2012 ACM Conference on Ubiquitous Computing, 2012, pp. 351–360. 14. R. LiKamWa, Y. Liu, N. D. Lane, L. Zhong, Moodscope: building a mood sensor from smartphone usage patterns, in: Proceeding of the 11th annual international conference on Mobile systems, applications, and services, ACM, 2013, pp. 389–402. 15. G. Bauer, P. Lukowicz, Can smartphones detect stress-related changes in the behaviour of individuals?, in: Pervasive Computing and Communications Workshops (PERCOM Workshops), 2012 IEEE International Conference on, 2012, pp. 423– 426.
12
Maxhuni et al.
16. A. Sano, R. W. Picard, Stress recognition using wearable sensors and mobile phones, in: Affective Computing and Intelligent Interaction (ACII), 2013 Humaine Association Conference on, 2013, pp. 671–676. 17. A. Muaremi, B. Arnrich, G. Tröster, Towards measuring stress with smartphones and wearable devices during workday and sleep, BioNanoScience 3 (2) (2013) 172– 183. 18. A. Bogomolov, B. Lepri, M. Ferron, F. Pianesi, A. S. Pentland, Daily stress recognition from mobile phone data, weather conditions and individual traits, in: Proceedings of the ACM International Conference on Multimedia, ACM, 2014, pp. 477–486. 19. D. Kim, Y. Seo, J. Cho, C.-H. Cho, Detection of subjects with higher self-reporting stress scores using heart rate variability patterns during the day, in: Engineering in Medicine and Biology Society, 2008. EMBS 2008. 30th Annual International Conference of the IEEE, IEEE, 2008, pp. 682–685. 20. A. Matic, V. Osmani, O. Mayora-Ibarra, Analysis of social interactions through mobile phones, Mobile Networks and Applications 17 (6) (2012) 808–819. 21. A. Matic, V. Osmani, O. Mayora, Speech activity detection using accelerometer, in: Engineering in Medicine and Biology Society (EMBC), 2012 Annual International Conference of the IEEE, 2012, pp. 2112–2115. 22. M. Prasad, P. Wahlqvist, R. Shikiar, Y.-C. T. Shih, A review of self-report instruments measuring health-related work productivity, Pharmacoeconomics 22 (4) (2004) 225–244. 23. E. J. Mezick, K. A. Matthews, M. Hall, T. W. Kamarck, D. J. Buysse, J. F. Owens, S. E. Reis, Intra-individual variability in sleep duration and fragmentation: associations with stress, Psychoneuroendocrinology 34 (9) (2009) 1346–1354. 24. D. M. McNair, M. Lorr, L. F. Droppleman, Profile of mood states, Univ., 1971. 25. X. Zhu, Semi-supervised learning literature survey. 26. M. Hall, E. Frank, G. Holmes, B. Pfahringer, P. Reutemann, I. H. Witten, The weka data mining software: an update, ACM SIGKDD explorations newsletter 11 (1) (2009) 10–18.