Oikos 124: 707–716, 2015 doi: 10.1111/oik.01654 © 2014 The Authors. Oikos © 2014 Nordic Society Oikos Subject Editor: James M. Bullock. Editor-in-Chief: Dries Bonte. Accepted 4 September 2014
Using intra-individual variation in shrub architecture to explain population cover Tristan Charles-Dominique, Claude Edelin, André Bouchard, Pierre Legendre and Jacques Brisson T. Charles-Dominique (
[email protected]) and C. Edelin, Univ. Montpellier 2, UMR AMAP, Montpellier, FR-34000 France, and: CNRS, UMR AMAP, Montpellier, FR-34000 France. Present address for TCD: Dept of Biological Sciences, Univ. of Cape Town, Rondebosch 7701, Cape Town, South Africa. – A. Bouchard, P. Legendre and J. Brisson, Inst. de Recherche en Biologie Végétale, 4101 est, rue Sherbrooke, Montréal, QC, H1X 2B2, Canada. AB and JB also at: Dépt de Sciences Biologiques, Univ. de Montréal, C.P. 6128, succ. Centre-ville Montréal, QC, H3C 3J7, Canada.
Plant architecture is related to the performance of long-lived plants; its role in promoting species coexistence and in successional patterns is now widely recognized. However, because plant architecture involves branching processes, it is highly variable at the intra-specific level. In this paper, we address two questions: what is the best way to describe plant architecture to obtain meaningful information for explaining population cover: at the whole-plant level, or at the level of its unitary constituent parts? Further, are there architectural designs related to populations’ success? We evaluated the relative impact of ontogeny and whole-plant traits on the cover achieved by the populations of five shrub species developing on 25 abandoned farmlands in southwestern Québec (Canada). We compared four ways of analyzing plant architecture: 1–2) using morphological traits described at the scale of a module (an elementary architectural unit made up of all the different types of shoots), with or without taking into account the ontogeny of the whole organism, 3) using the rate of changes during ontogeny as traits, and 4) using whole-plant traits describing branching processes at a scale larger than modules. We then used variation partitioning to discriminate the actual effects of these traits on percent cover of the species from hidden effects due to plant ontogenesis and population spatial structure. Our results suggest that the predominant variables that effectively describe population cover vary from one species to another. At the same time, whole-plant architectural traits and the rate of change of morphological traits during ontogeny both have an important effect on population cover. These findings suggest that acknowledging the developmental pattern of woody species can clarify the impact of intra-specific trait variation on population cover.
Architectural and morphological variation among woody species has been the subject of much research. In particular, researchers have investigated its influence on successional patterns (Küppers 1989, Oldeman 1990, Millet et al. 1998, 1999), as well as its contribution to species’ ability to coexist through niche diversification during regeneration (Horn 1971, Kohyama 1987, Poorter et al. 2003, 2006, Aiba and Nakashizuka 2009) and thrive under different environmental conditions (Pickett and Kempf 1980, Staver et al. 2012). Analysis of trait variability that determines species success has only minimally considered intraspecific trait variation, even though recent studies have shown that it can be an essential component of hypotheses about community and ecosystem functioning (Wakeling et al. 2011, Albert et al. 2012, Violle et al. 2012). Within-species trait variation includes several well-understood sources of variation: genotypic variation, phenotypic plasticity, ontogeny and plant organization (White 1979, Sultan 2003, Barthélémy and Caraglio 2007, Kawamura 2010). For long-lived species, position effects within plant architecture and ontogenic changes help to explain the structure of intraspecific variability and how it
affects key functional traits (Evans 1972, Hallé et al. 1978, White 1979, Coleman et al. 1994, Young et al. 2005, de Kroon et al. 2005, Poorter et al. 2005, Niinemets 2006, Barthélémy and Caraglio 2007). Plant construction is based on repetition of units of different sizes and complexity, such as metamers (bud internode leaf ), shoots, branches, modules, architectural units or reiterated complexes (Hallé et al. 1978, White 1979, Barthélémy and Caraglio 2007). However, in many situations, plant responses to the environment cannot be scaled up from one level of morphological organization to another (White 1979, Valladares 1999, Navas and Garnier 2002, Kawamura 2010). It is thus essential that ecological studies select the appropriate level of organization in individuals to describe populations or community responses (Körner 1994). Two main patterns could explain differential responses in plant development between whole-plant structure and module responses (the term ‘module’ refers in this paper to a structural unit repeated over time and composed of a dominant axis and its lateral subordinates axes): first, similar modules can be organized in different ways, producing organisms with different forms, 707
functions and ecological behaviours (Edelin 1977, Hallé et al. 1978, White 1979, Oldeman 1990, Millet et al. 1999, Preston and Ackerly 2004, Barthélémy and Caraglio 2007, Kawamura 2010); second, the successive modules in a structure are only rarely equivalent to one another because of modifications during plant ontogeny, through a process called ‘ontogenic drift’ or ‘morphogenetic gradient’ (Nozeran et al. 1971, Evans 1972, Coleman et al. 1994, Barthélémy and Caraglio 2007), which leads the same organism to occupy a series of different niches over the course of its life cycle (Young et al. 2005, Niinemets 2006). These two patterns can also interact with phenotypic plasticity: 1) phenotypic plasticity can either have an effect independent from ontogenic drift or produce confounding effects, for example, by modifying the plant growth rate or its ontogenetic program (Coleman et al. 1994, Kawamura and Takeda 2002, Wright and McConnaughay 2002); 2) a strong positional effect of modules within the whole-plant structure determines their functions and plastic response abilities (Winn 1996, Grosfeld et al. 1999, Benot et al. 2010, Charles-Dominique et al. 2010, 2012). While refining the description of these patterns is considered key to explaining species success, very few quantitative studies have focused specifically on the requirements of long-lived species after their juvenile stage (Wright and McConnaughay 2002, Poorter et al. 2005). This paper will address the following questions: 1) what is the most relevant morphological scale for studying the consequences of plant performance at the population level: whole-plant traits or module traits? 2) When studying module traits, what is the best method for incorporating ontogeny in order to most accurately describe the intra-specific variability that is important for species percent cover? To address these questions, we analyzed five shrub species that dominate abandoned farmland with a history of pastural use in southern Québec, Canada (Benjamin et al. 2005): Cornus sericea (Cornaceae), Prunus virginiana (Rosaceae), Rhamnus cathartica (Rhamnaceae), Rhus typhina (Anacardiaceae) and Zanthoxylum americanum (Rutaceae). Previous studies identified common structural components in these five shrubs that can be measured in situ to obtain a detailed description of their architecture (CharlesDominique et al. 2010, 2012, Charles-Dominique 2011). We first compare the overall explanation of their percent cover that can be provided by whole-plant traits to an interpretation based on traits defined at the module scale, integrating ontogenic drift or not. We then identify the traits most relevant for explaining the variation in population percent cover for each species.
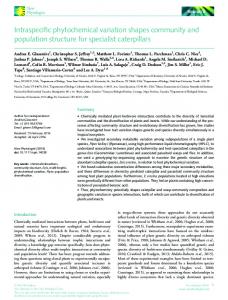
Methods Site selection The study was conducted in the Upper Saint Lawrence regional county municipality (MRC du Haut-SaintLaurent) located in southwestern Québec (Canada). Sites were selected from within an area of 10 km2 (Fig. 1) using the selection method described in Benjamin et al. (2005). In total, 36 sites were randomly selected in a stratified 708
Figure 1. Location of the 25 study sites. Black crosses indicate the site locations. Latitude and longitude coordinates are shown in the margins of the Ikonos satellite image (August 2000).
manner from among 180 abandoned farmlands, respecting the regional representation of vegetation cover classes (herbaceous or shrub), superficial deposits (marine or glacial), land-use history, and surrounding dominant matrix (forested or agricultural). This approach facilitated the most accurate interpretation of results possible at the landscape scale (Legendre and Legendre 2012). We restricted our study to 25 sites with brown stony loam underlain with surface deposits of morainic origin where spiny shrub communities develop preferentially (Benjamin et al. 2005). These communities were also the more appropriate ones to analyze because the assemblages developed on long-abandoned farmland with improbable reconversion to agriculture, whereas abandoned farmland with marine surface deposits could well be used again in the future for agricultural purposes (Benjamin et al. 2005). The area of the farmlands ranged from 1.46 to 6.45 hectares. Visual estimations were performed by two independent observers to estimate the percent cover of each shrub species into classes: 0–1%, 1–2.5%, 2.5–5%, 5–10%, 10–25%, 25–100%. Sites entirely lacking any one of the five species were excluded from the study in order to ensure data could be collected on the population development of each species. Species selection The five most abundant shrub species on the sites were selected for analysis of the morphological determinants of their population cover: Cornus sericea (Cornaceae), Prunus virginiana (Rosaceae), Rhamnus cathartica (Rhamnaceae), Rhus typhina (Anacardiaceae) and Zanthoxylum americanum (Rutaceae). The architecture of these species consists of three levels of organization (Fig. 2) based on modules, a structural unit repeated over time and composed of a dominant axis and its lateral subordinate axes. In these plants, the modules repeat in alignment to form a pseudo-monopodium (sympodial structure) or a monopodium (monopodial structure). A unit of sympodial structure corresponds to an element of the sympodium (Hallé et al. 1978); a unit of monopodial structure represents the annual production of the dominant
Figure 2. Architectural structure of the five shrub species. The species exhibit three levels of organization; modules are repeated to form pseudo-monopodia or monopodia that are themselves repeated to form dichasial branched complexes. The whole-organism architecture of the five species is made up of branched complexes along a rootstock (R. cathartica, C. sericea), a horizontal root system (R. typhina, Z. americanum) or a stoloniferous branched system (P. virginiana). Letters (a, b, c) identify successive modules within (pseudo-)monopodia; arabic numerals (1, 2, 3), successive branched complexes; Roman numerals (I, II, III), successive stocks (following Charles-Dominique 2011).
709
axis and its lateral subordinate axes. Monopodia and pseudo-monopodia are repeated sub-terminally to form regular dichasia called branched complexes. They result from the setting up of multiple forks with two equivalent branches. The whole organism is in fact a set of basal repetitions of branched complexes conferring a shrub habit to these species. Interspecific variation at every level of organization explains the different architectural profiles encountered among the five species. In the discussion below, all traits measured at the module scale will be referred to as module traits; those measured at higher levels of organization will be referred to as whole-plant traits. Morphological variation We measured morphological traits of the three most developed individuals of each species per site that were located at a minimum distance of 20 m apart. Trait measurements were repeated on the 3rd, 8th, 13th and 18th modules of the most developed branched complex of each individual, for a total of 961 modules. All variables at the module scale were measured following the most developed branch at each fork. The morphological variables used in the analyses are presented in Table 1. These variables describe the three levels of organization (Fig. 2) from the module to the whole plant. Plant age was determined a posteriori by delimiting annual shoots using presence of short internodes and scale leaves scars (Barthélémy and Caraglio 2007). The age estimate was confirmed by counting annual growth rings in cases where the result was unclear. For Rhamnus cathartica, Zanthoxylum americanum and Rhus typhina, the flowering frequency was evaluated only on female plants. Branched complex density was estimated by counting the number of branched complexes within a radius of 5 m, centered on the collar of the plant. The maximum radius of the organism was measured between the collar and the projection of the most distant point in the crown. The ranks of the last branched complex and module were noted in the largest branched complex to reflect the developmental stage. The rank is counted on successive morphological structures produced over time as shown in Fig. 2: the first branch complex was grown from seed, subsequent ones produced by basal branching are numbered chronologically; in every branch complex, the most basal module is the first, and subsequent structures produced by sub-terminal branching are numbered chronologically. Statistical analyses We separated the morphological variables into four groups: simple traits (five variables measured at the module scale),
calibrated traits (five variables, module scale), ontogenic trajectories (five variables, module scale), and traits measured at the upper levels of organization (six variables: (pseudo-) monopodium, branched complex and whole-plant traits). °° Simple traits were obtained by averaging the values of all measured modules. These traits allowed us to describe the module properties without taking into account their ontogenic modifications. °° Calibrated traits were obtained by 1) transforming the data collected for all individuals on all sites to obtain a linear relationship between the module ranks and the measured variable, 2) using linear regression for ontogenic detrending. The residuals were then used as a trait. This procedure allowed us to define an ontogenic drift of reference for each species (linear regression) and to control for the effect of ontogeny in the measurements. °° Ontogenic traits were obtained by using the slopes of the linear regressions between the module ranks and the measured variables as traits. These traits reflect the speed of changes in morphological variables over time. Previous studies showed that this speed can be modified in response to environmental conditions (Grosfeld et al. 1999, Charles-Dominique et al. 2010, 2012). Data were pooled at the site level before statistical analysis. We used variation partitioning (Borcard et al. 1992) to estimate the unique and joint effects of chronology, architectural traits and spatial variables on population percent cover. Spatial variables (dbMEM eigenfunctions, described below) are used to model the spatial relationships among populations that may affect the influence exercised by two other groups of factors. A significant unique effect of the spatial variables on population percent cover would imply that at least one non-recorded biological property, which is spatially structured, is missing from the model and would justify further investigation. Morphological variables were square-root transformed (except for the number of leaves per module, which was not modified) in order to satisfy the condition of normality of the residuals in a regression with species vegetation cover as the response variable (Shapiro–Wilk W test; H0: normality of distribution, µ 0.1). Variation partitioning implied the following steps for each species (Borcard et al. 1992, 2011): 1) detrending was used to remove a potential linear spatial trend in the data, which would reflect a process occurring at a scale larger than the study area (Legendre and Legendre 2012); the regression residuals were then used as the response matrix; 2) distance-based Moran’s eigenvector maps (dbMEM, Borcard and Legendre 2002, Dray et al. 2006) were constructed from the geographical distances
Table 1. Morphological variables: BC density refers to the number of branch complexes per square meter. Flowering frequency corresponds to the ratio of stems bearing flowers over the total number of stems potentially bearing flowers. Module length is measured on the primary axis of each module. A growth unit corresponds to the portion of an axis that develops during an uninterrupted period of extension (Barthélémy and Caraglio 2007). Level of organization
Individual plant
Ontogeny Morphology
age height BC density max. radius
710
Branched complex
(Pseudo-)monopodium
rank of the last BC no. of monopodia flowering frequency
rank of the last module no. of modules
Module length no. of lateral axes no. of leaves stem diameter no. of growth units
between the 25 study sites. Only the dbMEM spatial variables with a Moran’s spatial correlation index (Moran’s I) higher than the expected value of I were retained to model positive spatial correlation in the data (Borcard et al. 2011); 3) forward selection by multiple regression was applied to the structural and spatial explanatory variables using a stopping criterion of alpha 0.05 (Borcard et al. 2011); 4) multiple regression and partial multiple regressions were used with two or three explanatory matrices; 5) permutation tests (999 permutations) were performed to test the significant effects (µ 0.05) of the testable fractions (Legendre and Legendre 2012); 6) For each of these analyses, adjusted R-squares (R2adj) provided unbiased estimates of the variation explained by the fractions (Peres-Neto et al. 2006). Venn diagrams were used to illustrate the results of variation partitioning. The calculations were carried out using the following functions in R 3.0.2: PCNM of PCNM package (Legendre et al. 2012) for dbMEM computation, forward.sel function of packfor package (Dray et al. 2012) for selection of explanatory variables, and varpart function of the vegan package (Oksanen et al. 2013) for variation partitioning.
Results Spatial structure Figure 3 shows the spatial structures of the populations of three species. Forward selection did not provide any significant MEM variable to explain the percent cover of Prunus virgiana and Rhus typhina, which were only present on 11 and 9 sites, respectively. Since they had no significant spatial structure at the study scale, variation partitioning was performed using only two explanatory matrices, morphology and ontogeny. The significant MEM variables found for Zanthoxylum americanum, Cornus sericea and Rhamnus cathartica are shown in Fig. 3 and were then used to represent the spatial structure of these populations in the landscape.
Relationships between morphological properties, ontogeny and population cover Results of the multiple and partial multiple regressions are reported in Fig. 4. For each explanatory matrix, we report the variations explained uniquely and jointly by the matrices of explanatory variables, showing the adjusted coefficient of determination (R2adj) and the significance of the unique fractions, which are testable (Borcard et al. 2011). Overall models (including all subsets of explanatory variables) explain respectively 77, 59, 64 and 75% of the percent cover variation of Z. americanum, C. sericea, Rhus typhina and R. cathartica among sites. Of the percent cover variation of Z. americanum (Fig. 4a), 84% is explained by the morphological variables; this includes 61% uniquely explained by morphology and 19% explained jointly by the morphological and ontogenetic variables. For R. typhina (Fig. 4c), the morphological effect accounts for 65% of the variation, whereas ontogenetic effect is negligible. For C. sericea (Fig. 4b), morphology explains 46% of the percent cover variation and the spatial dbMEM eigenfunctions explain 21%; 4% of the variation is explained jointly by these two sets of variables. The partial contribution of the spatial variables is high and significant, indicating that these populations have a spatial organization not linked with the measured morphological variables. Additional studies could be carried out to identify biological variables accounting for this spatial variability. In Rhamnus cathartica (Fig. 4d), 67% of the percent cover variation is explained by the morphological variables, 54% by the ontogenetic variables, and 36% is spatially structured. 48% of the variation is explained jointly by the morphological and ontogenetic variables, suggesting that additional studies are needed to clearly separate the morphological and ontogenetic effects. 29% of the variation is shared between the morphological and spatial variables.
Discussion
Morphological variables
Whole-plant architectural traits take precedence
Morphological variables related to species percent covers that were identified by forward selection are shown in Table 2. The percent cover of Z. americanum was higher on sites where individuals had a small number of monopodia, a low height, a large stem diameter and a high density of branched complexes. No morphological variable was significantly related to the percent cover variation of P. virginiana. This result could be due to the small variation in percent cover for this species associated with the small number of sites where it was present. A larger percent cover of R. typhina was found on sites where the number of leaves of individuals decreased rapidly over ontogenesis. Individual properties correlated to an increase in population cover of C. sericea were a great density of branched complexes and a great height. The percent cover of R. cathartica was higher on sites where individuals had branched complexes containing a high number of monopodia, with a high number of leaves per module and a module length that decreased quickly over ontogenesis.
Four of the five species under study (Prunus virginiana, Cornus sericea, Zanthoxylum americanum and Rhamnus cathartica) have highly variable architectures depending on environmental conditions (Charles-Dominique et al. 2010, 2012, Charles-Dominique 2011). For these species, whole-plant architectural traits provided an explanation of the percent cover at least twice as strong as module traits. Kawamura and Takeda (2008) showed that Vaccinium hirtum plants responded to light availability by producing new sprouts rather than by increased growth of the existing stem, exemplifying the importance of considering wholeplant architectural traits. For Rhus typhina, the most predictive traits were not whole-plant architectural traits but rather ontogenic trajectories. Interestingly, previous architectural analyses of this species (Charles-Dominique 2011) showed that its whole-plant architecture seems unresponsive to the local environment: this species has a stereotyped development with aerial parts conforming to Leeuwenberg’s architectural model (Hallé et al. 1978). 711
Figure 3. Spatial structure. (A) Bubble plot map of the percent cover of Prunus virginiana. Abscissa and ordinate are the spatial coordinates of the sites, as in Fig. 1. Lines form the minimum spanning tree joining the sites. Circle sizes are proportional to percent covers. (B) Bubble plot map of the percent cover of Zanthoxylum americanum; (C) MEM analysis for Z. americanum: map of significant MEM; (D) Bubble plot map of the percent cover of Rhus typhina; (E) Bubble plot map of the percent cover of Cornus sericea; (F) MEM analysis for C. sericea: map of significant MEM no. 5; (G) Bubble plot map of the percent cover of Rhamnus cathartica; (H, I) MEM analysis for R. cathartica: maps of significant MEM variables. The MEM eigenfunctions form continuous waves on the surface, but their values are computed and shown only at the points where species were present. Along these spatial waves, some values are positive (black squares) while others are negative (white squares); square sizes are proportional to the absolute values. Table 2. Morphological variables related to species percent cover. The variables selected by forward selection are reported by species, with their significance level (0 *** 0.001 ** 0.01 * 0.05 ns), the sign of the slope and the adjusted R². BC stands for branched complex, No. for number, pseudo-M for pseudo-monopodia. Prefixes S and O identify simple and ontogenic traits, respectively. The traits describing the plant are measured: at the individual level for ‘BC density’ and ‘Height’, at the branched complex level for ‘No. of monopodia’ and ‘Pseudo-monopodia’, and at the module level for ‘Module diameter’, ‘Leaf number’ and ‘Module length’. Z. americanum No. of monopodia* Height*** S-module diameter** BC density*
712
– –
0.16 0.20 0.26 0.08
R. typhina
C. sericea
O-leaf no.***
BC density** Height*
–
0.81
R. cathartica
0.30 0.22
No. pseudo-M*** S-leaf no.*** O-module length*
–
0.35 0.22 0.10
Figure 4. Venn diagrams of the variation partitioning of the species’ percent cover explained by three data sets corresponding to morphological, ontogenic and spatial variables. Fractions corresponding to unique effects have been tested by partial multiple regression (significance levels: 0 *** 0.001 ** 0.01 * 0.05 ns). Residuals in each diagram correspond to the fraction not explained by the overall model. Adjusted coefficients of determination are reported when they were positive. Circle sizes are not proportional to the corresponding R2adj.
The stronger link between whole-plant traits and population cover has several consequences: 1) It implies that within species, successful populations are those that develop following a particular way of branching. Characterizing the corresponding strategies is thus necessary prior to comparison of species’ competitive abilities: comparing the full range of behaviours or mean behaviour of species could lead to biased results as it can hide meaningful information (Wakeling et al. 2011, Violle et al. 2012). 2) The link between whole-plant traits and population spread cover corroborates the suggestion by de Kroon et al. (2005) that competitive properties may not be properly extrapolated from a few modules without taking whole-plant organization into account. A better understanding of the integrative traits that allow woody species to occupy space efficiently could bring new insights into species behaviors and interactions, as has been the case for herbaceous species (Huber et al. 1999, Benot et al. 2010). While numerous studies have described the whole-plant architecture of welldeveloped individuals, thereby providing helpful tools and results for understanding the space use by trees (Hallé et al. 1978, Oldeman 1990, Barthélémy and Caraglio 2007), the
integration of architectural strategies into ecology remains a promising realm. 3) Another important consequence of this result is related to the relevance of the biological material we observed for describing species ecology. Where branching properties of the whole organism of well-developed plants were identified as important for population cover, our results suggest that to be complete, analysis must include not only seedlings and saplings, but also mature plants (Poorter et al. 2005, Young et al. 2005). 4) From a methodological viewpoint, the description of branching patterns at the whole-plant scale provides interesting additional information that is often more accessible and more easily measured in the field. Ontogeny matters Morphological traits vary simultaneously over the course of plant growth and in response to the growing environment (Evans 1972, Wright and McConnaughay 2002, Barthélémy and Caraglio 2007). Identifying effects of ontogeny is thus essential when analyzing phenotypic plasticity or the genetic 713
basis for plant morphology (Winn 1996, Diggle 2002, de Kroon et al. 2005, Barthélémy and Caraglio 2007). The strategies adopted to disentangle the effects of ontogenesis and those from other sources of intraspecific variability (phenotypic plasticity and genetic differentiation) are multiple, but each strategy targets different ontogenic effects (Wright and McConnaughay 2002). We examined three approaches to analyzing the effect of intraspecific variability of plant architecture on population cover at the module scale. Our results reveal that the different ways of integrating plant ontogenesis into the analysis of intraspecific variability are not equivalent for explaining population cover. While architectural module traits provide less complete explanations than whole-plant traits, integration of the ontogenic effect is important because it could be extended to a range of measurements made at the module scale, such as physiological or anatomical variables. The calibrated traits did not lead to complete results because their ability to explain population cover remains relatively unchanged when compared to simple traits (no calibration of ontogenic drift); none of the calibrated traits were selected during variable selection. In the shrub populations under study, ontogenetic traits were the most relevant for explaining population cover. This suggests that among sites, the rate of ontogenic drift of plants can change, and that this rate modification is of great importance in explaining population cover. It also highlights the importance of integrating ontogenic effects in the analysis of intraspecific variability (Diggle 2002, Wright and McConnaughay 2002). According to Wright and McConnaughay (2002), the implication is that calibrating the age or size of plants before measuring traits at a single position is not sufficient to remove ontogenic effects, due to complex plant responses during ontogenesis. For example, modification of ontogenetic drift, as recorded for R. typhina or R.cathartica, could cause morphological structures normally found in older plants to develop earlier in the plant’s life. In these situations, the age or the size of the plant would not provide information about its physiological status (Barthélémy and Caraglio 2007). Shrub behaviors and population cover In Z. americanum, the traits associated with population cover are related to reduced height and high stem density. The high density of stems is produced by a higher branched complex density. This could be related, in the case of this species, to the frequency with which root suckers are emitted (Charles-Dominique 2011). This is highly variable and depends on the plant’s light environment. The C. sericea populations with a high percent cover have taller individuals with a high branched complex density. Previous studies hypothesized that the same architectural traits were important for the species’ ability to outcompete neighboring species by preventing them from germinating and developing (Meilleur et al. 1997, Charles-Dominique et al. 2010). The results of the present study partially support these hypotheses by confirming the impact of these traits on population cover. In R. cathartica, the traits associated with high population cover are a high number of pseudo-monopodia, numerous leaves per module and a rapid decrease of module length 714
during ontogenesis. In this species, a high number of pseudo-monopodia is not associated with greater height but corresponds mainly to a more dichasial structure, both dense and more branched (Charles-Dominique et al. 2012). The rapid decrease of module length expressed in open canopies has also been linked to these more dichasial structures (Charles-Dominique et al. 2012). The populations of R. typhina with high population cover exhibit a rapid decrease in the number of leaves per shoot during development. This species is characterized by a structure composed of simple modules having a single axis category. This property may be responsible for the species’ limited tendency to modify its architecture. Considerations about the determinism of intraspecific variation We studied the relationships between intraspecific trait variation and population cover without consideration of whether they have genetic or environmental causes. This procedure does not provide a mechanistic explanation for the determinants of the observed variation, but according to Violle et al. (2012), the effects of these factors (genetic and environmental causes) are inseparable in community ecology without specific investigations. Based on our results, we can derive several hypotheses about the causes of the observed intraspecific variability. First, the unique effect of ontogeny on percent cover was not found to be significant for the five species studied (Z. americanum, R. typhina, C. sericea and R. cathartica), suggesting that differences in population cover are caused by differential success of species over sites, independently of age. Another important factor that could explain these variations is genetic differentiation between populations. Small-scale genetic differentiation has been observed by several authors in comparable situations. For example, such differentiation has been highlighted for populations of perennial plants at scales of 100–300 m and has been shown to affect many of the most important features of plant structure and functions (Linhart and Grant 1996). Many of the mechanisms leading to genetic differentiation, such as, for example, genetic isolation by distance, are spatially structured (Linhart and Grant 1996, Hardy and Vekemans 1999). Thus, a hypothetical genetic differentiation responsible for morphological variation could probably be included in our analysis as a possible explanation for the spatial structure of population densities. The weak fractions coexplained by morphology and spatial structure show that if there is a genetic basis, it is not spatially organized. The morphological variations observed in our study could probably be linked with environmental variability, as plastic responses (Sultan 2003, Valladares et al. 2007). Our results could thus be supported by a detailed analysis of the environmental factors related to this intraspecific variability of architectural traits. Conclusion We analyzed relationships between population cover and the architectural properties of five shrub species. While these shrubs are constructed from the repetition of repeated
equivalent modules, the intraspecific variability in population success is mainly associated to the organization of these modules on the whole plant in space and time, rather than properties at the module scale. These results suggest that using architecture to analyze competition among perennial plants can allow researchers to describe important features of plant shape and functions. We suspect that many morphological behaviors of ecological significance could be identified in perennial plants, which would improve our understanding of population demography and community coexistence. A huge gap remains to be filled, however, between our knowledge of species’ architectural patterns at the individual level and the use of these patterns to explain their ecology. Acknowledgements – We wish to thank Audrey Comtois for assistance in data collection. Thanks to François Munoz and Pierre Couteron for helpful suggestions in manuscript preparation. We are very grateful to Karen Grislis for English revision. This work was supported by a Natural Sciences and Engineering Research Council of Canada grant to AB and JB and by a Centre National de la Recherche Scientifique grant to CE and TCD.
References Aiba, M. and Nakashizuka, T. 2009. Growth properties of 16 non-pioneer rain forest tree species differing in sapling architecture. – J. Ecol. 97: 992–999. Albert, C. H. et al. 2012. On the importance of intraspecific variability for the quantification of functional diversity. – Oikos 121: 116–126. Barthélémy, D. and Caraglio, Y. 2007. Plant architecture: a dynamic, multilevel and comprehensive approach to plant form, structure and ontogeny. – Ann. Bot. 99: 375–407. Benjamin, K. et al. 2005. Vegetation composition and succession of abandoned farmland: effects of ecological, historical and spatial factors. – Landscape Ecol. 20: 627–647. Benot, M.-L. et al. 2010. Do spatial patterns of clonal fragments and architectural responses to defoliation depend on the structural blue-print? An experimental test with two rhizomatous Cyperaceae. – Evol. Ecol. 24: 1475–1487. Borcard, D. and Legendre, P. 2002. All-scale spatial analysis of ecological data by means of principal coordinates of neighbour matrices. – Ecol. Modell. 153: 51–68. Borcard, D. et al. 1992. Partialling out the spatial component of ecological variation. – Ecology 73: 1045–1055. Borcard, D. et al. 2011. Numerical ecology with R. – Springer. Charles-Dominique, T. 2011. Analyse des relations entre plasticité architecturale des buissons et proliferation de leurs populations. – Univ. Montpellier 2, France. Charles-Dominique, T. et al. 2010. Architectural strategies of Cornus sericea, a native but invasive shrub of southern Quebec, Canada, under an open or a closed canopy. – Ann. Bot. 105: 205–220. Charles-Dominique, T. et al. 2012. Architectural strategies of Rhamnus cathartica (Rhamnaceae) in relation to canopy openness. – Botany 90: 976–989. Coleman, J. C. et al. 1994. Interpreting phenotypic variation in plants. – Trends Ecol. Evol. 9: 187–191. de Kroon, H. et al. 2005. A modular concept of phenotypic plasticity in plants. – New Phytol. 166: 73–82. Diggle, P. K. 2002. A developmental morphologist’s perspective on plasticity. – Evol. Ecol. 16: 267–283. Dray, S. et al. 2006. Spatial modelling: a comprehensive framework for principal coordinate analysis of neighbour matrices (PCNM). – Ecol. Modell. 196: 483–493.
Dray, S. et al. 2012. packfor: forward selection with permutation (Canoco p. 46). R package ver. 0.0–8. – . Edelin, C. 1977. Images de l’architecture des conifères. – Univ. Montpellier II, France. Evans, G.C. 1972. The quantitative analysis of plant growth. – Univ. of California Press. Grosfeld, J. et al. 1999. Architectural variations of Araucaria araucana (Molina) K. Koch (Araucariaceae) in its natural habitat. – In: Kurmann, M. H. and Hemsley, A. R. (eds), The evolution of plant architecture. Royal Botanic Gardens Kew, pp. 109–122. Hallé, F. et al. 1978. Tropical trees and forests – an architectural analysis. – Springer. Hardy, O. J. and Vekemans, X. 1999. Isolation by distance in a continuous population: reconciliation between spatial autocorrelation analysis and population genetics models. – Heredity 83: 145–154. Horn, H. S. 1971. The adaptive geometry of trees. – Princeton Univ. Press. Huber, H. et al. 1999. Spatial structure of stoloniferous herbs: an interplay between structural blue-print, ontogeny and phenotypic plasticity. – Plant Ecol. 141: 107–115. Kawamura, K. 2010. A conceptual framework for the study of modular responses to local environmental heterogeneity within the plant crown and a review of related concepts. – Ecol Res. 25: 733–744. Kawamura, K. and Takeda, H. 2002. Light environment and crown architecture of two temperate Vaccinium species: inherent growth rules versus degree of plasticity in light response. – Can. J. Bot. 80: 1063–1077. Kawamura, K. and Takeda, H. 2008. Developmentally programmed and plastic processes of growth in the multistemmed understory shrub Vaccinium hirtum (Ericaceae). – Botany 86: 268–277. Kohyama, T. 1987. Significance of architecture and allometry in saplings. – Funct. Ecol. 1: 399–404. Körner, C. 1994. Scaling from species to vegetation: the usefulness of functional groups. – In: Schulze, E.-D. and Mooney, H. A. (eds), Biodiversity and ecosystem function. Springer, pp 117–140. Küppers, M. 1989. Ecological significance of above-ground architectural patterns in woody plants: a question of cost–benefit relationships. – Tree 4: 375–379. Legendre, P. and Legendre, L. 2012. Numerical ecology, 3rd English edn. – Elsevier Science. Legendre, P. et al. 2012. PCNM: MEM spatial eigenfunction and principal coordinate analyses. R package ver. 2.1-2. – https://r-forge.r-project.org/R/?group_id=195 . Linhart, Y. B. and Grant, M. C. 1996. Evolutionary significance of local genetic differentiation in plants. – Annu. Rev. Ecol. Syst. 27: 237–277. Meilleur, A. et al. 1997. Shrub propagation techniques for biological control of invading tree species. – Environ. Manage. 21: 433–442. Millet, J. et al. 1998. Plant succession and tree architecture: an attempt at reconciling two scales of analysis of vegetation dynamics. – Acta Biotheor. 46: 1–22. Millet, J. et al. 1999. Relationship between architecture and successional status of trees in the temperate deciduous forest. – Ecoscience 6: 187–203. Navas, M.-L. and Garnier, E. 2002. Plasticity of whole plant and leaf traits in Rubia peregrina in response to light, nutrient and water availability. – Acta Oecol. 23: 375–383. Niinemets, Ü. 2006. The controversy over traits conferring shadetolerance in trees: ontogenetic changes revisited. – J. Ecol. 94: 464–470. Nozeran, R. et al. 1971. Intervention of internal correlations in the morphogenesis of higher plants. – Adv. Morphogenesis 9: 1–66.
715
Oldeman, R. A. A. 1990. Elements of sylvology. – Springer. Oksanen, J. et al. 2013. vegan: community ecology package. R package ver. 2.0–3. – . Peres-Neto, P. R. et al. 2006. Variation partitioning of species data matrices: estimation and comparison of fractions. – Ecology 87: 2614–2625. Pickett, S. T. A. and Kempf, J. S. 1980. Branching patterns in forest shrubs and understory trees in relation to habitat. – New Phytol. 86: 219–228. Poorter, L. et al. 2003. Architecture of 53 rain forest tree species differing in adult stature and shade tolerance. – Ecology 84: 602–608. Poorter, L. et al. 2005. Beyond the regeneration phase: differentiation of height-light trajectories among tropical tree species. – J. Ecol. 93: 256–267. Poorter, L. et al. 2006. Architecture of 54 moist-forest tree species: traits, tradeoffs, and functional groups. – Ecology 87: 1289–1301. Preston, K. A. and Ackerly, D. D. 2004. The evolution of allometry in modular organisms. – In: Pigliucci, M. and Preston, K. A. (eds), Phenotypic integration: studying the ecology and evolution of complex phenotypes. Oxford Univ. Press, pp. 80–106. Staver, A. C. et al. 2012. Top–down determinants of niche structure and adaptation among African Acacias. – Ecol. Lett. 15: 673–679.
716
Sultan, S. E. 2003. Phenotypic plasticity in plants: a case study in ecological development. – Evol. Dev. 5: 25–33. Valladares, F. 1999. Architecture, ecology and evolution of plant crowns. – In: Pugnaire, F. I. and Valladares, F. (eds), Handbook of functional plant ecology. Marcel Dekker, pp. 121–194. Valladares, F. et al. 2007. Ecological limits to plant phenotypic plasticity. – New Phytol. 176: 749–763. Violle, C. et al. 2012. The return of the variance: intraspecific variability in community ecology. – Trends Ecol. Evol. 27: 244–252. Wakeling, J. L. et al. 2011. Simply the best: the transition of savanna saplings to trees. – Oikos 120: 1448–1451. White, J. 1979. The plant as a metapopulation. – Annu. Rev. Ecol. Syst. 10: 109–145. Winn, A. A. 1996. The contributions of programmed developmental change and phenotypic plasticity to within-individual variation in leaf traits in Dicerandra linearifolia. – J. Evol. Biol. 9: 737–752. Wright, S. D. and McConnaughay, K. D. M. 2002. Interpreting phenotypic plasticity: the importance of ontogeny. – Plant Species Biol. 17: 119–131. Young, T. P. et al. 2005. The ecology of restoration: historical links, emerging issues and unexplored realms. – Ecol. Lett. 8: 662–673.