JOURNAL OF APPLIED PHYSICS
VOLUME 87, NUMBER 10
15 MAY 2000
Thermodynamics of Cu47Ti34Zr11Ni8 , Zr52.5Cu17.9Ni14.6Al10Ti5 and Zr57Cu15.4Ni12.6Al10Nb5 bulk metallic glass forming alloys S. C. Glade,a) R. Busch,b) D. S. Lee,c) and W. L. Johnson Division of Engineering and Applied Science, California Institute of Technology, Pasadena, California 91125
R. K. Wunderlich and H. J. Fecht Materials Science, University of Ulm, Albert-Einstein-Alle 47, D-89081 Ulm, Germany
共Received 14 December 1999; accepted for publication 18 February 2000兲 The differences in the thermodynamic functions between the liquid and the crystalline states of three bulk metallic glass forming alloys, Cu47Ti34Zr11Ni8 , Zr52.5Cu17.9Ni14.6Al10Ti5 , and Zr57Cu15.4Ni12.6Al10Nb5 , were calculated. The heat capacity was measured in the crystalline solid, the amorphous solid, the supercooled liquid, and the equilibrium liquid. Using these heat capacity data and the heats of fusion of the alloys, the differences in the thermodynamic functions between the liquid and the crystalline states were determined. The Gibbs free energy difference between the liquid and the crystalline states gives a qualitative measure of the glass forming ability of these alloys. Using the derived entropy difference, the Kauzmann temperatures for these alloys were determined. © 2000 American Institute of Physics. 关S0021-8979共00兲07810-5兴
I. INTRODUCTION
II. EXPERIMENTAL METHODS
Metallic glasses are a relatively new class of materials. They were first obtained from a metallic melt by rapid quenching 共approximately 106 K s⫺1 ) in 1961 by Duwez et al.1 Recently, new metallic glass forming compositions have been developed, including La–Al–Ni,2 Zr–Ni–Al–Cu,3 Mg–Cu–Y,4 Zr–Ti–Cu–Ni–Be,5 and Cu–Ti–Zr–Ni.6 The best glass former out of these alloys is Zr41.2Ti13.8Cu12.5Ni10Be22.5 , with a critical cooling rate for glass formation of 1 K s⫺1.7 Due to the improved glass forming ability of these alloys, experiments on the thermophysical properties in the glassy state and in the supercooled liquid can now be performed, including measurements of specific heat capacity,8,9 viscosity,10 atomic diffusion coefficient,11 and the coefficient of thermal expansion.12 In this article, we investigate the thermodynamics of three bulk glass forming alloys: Cu47Ti34Zr11Ni8 , Zr52.5Cu17.9Ni14.6Al10Ti5 , and Zr57Cu15.4Ni12.6Al10Nb5 . 13 With critical cooling rates from 10 to 250 K s⫺1, these alloys have a moderate glass forming ability compared to Zr41.2Ti13.8Cu12.5Ni10Be22.5 . However, these glasses are among the best nonberyllium containing glasses, making them easier to process and to handle. After measuring the heat capacity of these alloys in the crystalline solid, the amorphous solid, the supercooled liquid, and the equilibrium liquid, the differences in thermodynamic functions between the liquid and the crystalline states can be determined. The Gibbs free energy difference gives a qualitative measure of the stability of the glass compared to the crystalline state.
We prepared the alloys in an arc melter with a titanium gettered, ultrahigh purity argon atmosphere, with elements of purities from 99.9% to 99.9999%. The nominal compositions of the alloys prepared were Cu47Ti34Zr11Ni8 , Zr52.5Cu17.9Ni14.6Al10Ti5 , and Zr57Cu15.4Ni12.6Al10Nb5 . To obtain amorphous samples for differential scanning calorimetry 共DSC兲 experiments, we melted the alloys in quartz tubes in a radio frequency induction furnace and then injection cast the melt with argon into a copper mold. The molten metals were held in the quartz tubes for as short a time as possible 共usually ⬍10 s兲 to avoid any contamination. In previous work done on SiC composites with Cu47Ti34Zr11Ni8 and Zr57Cu15.4Ni12.6Al10Nb5 as the matrix material, silicon additions to the alloy improved the thermal stability of the amorphous solid.14,15 We do not see this improvement in the thermal stability of the amorphous solid, so the silicon contamination from melting these alloys in quartz tubes is thought to be less than 0.5% atomic. A DSC 共Perkin Elmer DSC-7兲 was used to determine the absolute specific heat capacity of the alloys. Heating a sample at 0.333 K s⫺1 and then holding it at a constant temperature results in a step in heat flux given by
冉 冊 冉 冊
˙ ⫽ Q ⫽ Q Q t t
T˙ ⫽0
⫺
Q t
T˙ ⫽0
⫽c•
dT , dt
共1兲
a兲
Author to whom correspondence should be addressed; electronic mail:
[email protected] b兲 Current address: Department of Mechanical Engineering, Oregon State University, Corvallis, OR 97331. c兲 Current address: Symyx Technologies, Santa Clara, CA 95051. 0021-8979/2000/87(10)/7242/7/$17.00
where ( Q/ t) T˙ ⫽0 is the power required to heat the sample and sample pan at a constant heating rate, ( Q/ t) T˙ ⫽0 is the power needed to hold the sample and sample pan at a con7242
© 2000 American Institute of Physics
Downloaded 12 Jan 2006 to 131.215.240.9. Redistribution subject to AIP license or copyright, see http://jap.aip.org/jap/copyright.jsp
Glade et al.
J. Appl. Phys., Vol. 87, No. 10, 15 May 2000
7243
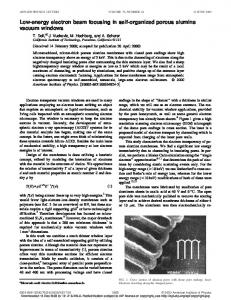
FIG. 1. Thermal behavior of Cu47Ti34Zr11Ni8 upon heating. The lower temperature data were obtained with a DSC 共heating rate of 0.333 K s⫺1兲 and the higher temperature data were obtained with a DTA 共heating rate of 0.167 K s⫺1兲. The onset of the glass transition, T g , the onset of crystallization, T x , the solidus temperature, T solidus , the temperature at the peak of the melting endotherm, T peak , and the liquidus temperature, T liquidus , are indicated. The exothermic hump after the melting peak is due to the reaction of the alloy with the graphite crucible.
stant temperature, and c is the heat capacity of the sample and sample pan. By performing these heat flux steps every 20 K on the metal sample in the sample pan, a sapphire standard in the sample pan, and the sample pan by itself, the absolute specific heat capacity of the metal sample can be determined by ˙ ˙ Q m sapphire•metal metal⫺Q pan • c p 共 T 兲 metal⫽ ˙ ˙ Q sapphire⫺Q pan m metal•sapphire •c p 共 T 兲 sapphire ,
共2兲
where m i is mass, i is molar mass, and c p (T) sapphire is the heat capacity of sapphire.9 The absolute specific heat capacity of the supercooled liquid immediately after the glass transition could not be measured using the method described above because these alloys are not very stable against crystallization in this temperature range. To determine the specific heat capacity in this TABLE I. Glass transition temperatures, crystallization temperatures, solidus temperatures, peak temperatures 共peak of the melting endotherm兲, liquidus temperatures, and the heats of fusion for the three alloys. The solidus and liquidus temperatures of Cu47Ti34Zr11Ni8 measured in this study differ from the previously reported values of 1105 and 1160 K, respectively 共see Ref. 6兲. Lin performed DTA experiments using alumina crucibles, while we performed the DTA experiments using graphite crucibles. The difference in the values measured is attributed to the reaction of the alloy with the alumina crucibles. T g a T x a T solidusb T peakb T liquidusb ⌬H f b 共K兲 共K兲 共K兲 共K兲 共K兲 共kJ g atom⫺1兲 Cu47Ti34Zr11Ni8 Zr52.5Cu17.9Ni14.6Al10Ti5 Zr57Cu15.4Ni12.6Al10Nb5 a
673 717 675 727 682 742
1114 1072 1091
1119 1085 1105
Measured with a heating rate of 0.333 K s⫺1. Measured with a heating rate of 0.167 K s⫺1.
b
1128 1091 1115
11.3 8.2 9.4
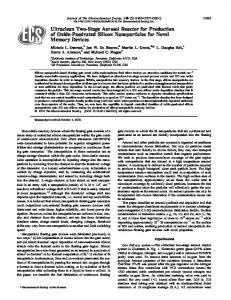
FIG. 2. The specific heat capacity of the crystalline solid 共䊏兲, the amorphous alloy 共䊐兲, the supercooled liquid measured with constant heating rate experiments 共䉱兲, and the undercooled liquid and the equilibrium liquid measured with ac modulation calorimetry 共䊉兲 for: 共a兲 Cu47Ti34Zr11Ni8 , 共b兲 and 共c兲 Zr57Cu15.4Ni12.6Al10Nb5 . For Zr52.5Cu17.9Ni14.6Al10Ti5 , Zr52.5Cu17.9Ni14.6Al10Ti5 , the equilibrium liquid data were not measured, but a value of 42.5 J g atom⫺1 K⫺1 at 1085 K was assigned to allow the determination of the fitting constant for the liquid specific heat capacity 共䊊兲. The lines on the graphs are the fits to Eqs. 共7兲 and 共8兲.
Downloaded 12 Jan 2006 to 131.215.240.9. Redistribution subject to AIP license or copyright, see http://jap.aip.org/jap/copyright.jsp
7244
Glade et al.
J. Appl. Phys., Vol. 87, No. 10, 15 May 2000 TABLE II. Fitting constants for the heat capacity data, using c p,crystal(T)⫽3R⫹aT⫹bT 2 to fit the crystalline state heat capacity data and c p,liquid(T)⫽3R⫹cT⫹dT ⫺2 to fit the liquid heat capacity data. a 共J g atom⫺1 K⫺2兲 Cu47Ti34Zr11Ni8 Zr52.5Cu17.9Ni14.6Al10Ti5 Zr57Cu15.4Ni12.6Al10Nb5
b 共J g atom⫺1 K⫺3兲 6.82 ⫻ 10⫺6 16.8 ⫻ 10⫺6 8.37 ⫻ 10⫺6
⫺0.000 89 ⫺0.008 61 ⫺0.003 02
temperature range, constant heating rate DSC experiments were performed at 0.333, 0.667, 1.33, and 3.33 K s⫺1. The specific heat capacity is determined by ˙ Q c p,glass⫽ ˙ ⫹c p,crystal⫹scaling constant, Tm
共3兲
˙ is the power input, T˙ is the heating rate, m is the where Q mass, and is the molar mass. The DSC was calibrated for each heating rate to account for the shift in temperature with different heating rates. Alternating current 共ac兲 modulation calorimetry16,17 was used to measure the specific heat capacity of the undercooled liquid and the equilibrium liquid. The ac modulation calorimetry technique was performed using TEMPUS 共Tiegelfreies Elektromagnetisches Prozessieren Unter Schwerelosigkeit, see Ref. 18兲, an electromagnetic processing facility that flew on board the National Aeronautics and Space Administration’s 共NASA兲 space shuttle. ac modulation calorimetry is a noncontact technique for measuring heat capacity; by modulating the power input to the sample and measuring the temperature response, the heat capacity can be determined. Two time constants are important in this experimental method:
1⫽
cp
共4兲
4A ⑀ T T 30
and
2⫽
3c p , 4 3 R th
共5兲
where c p is the sample heat capacity, A is the sample surface area, ⑀ T is the total hemispherical emissivity of the sample surface, is the Stefan–Boltzman constant, T 0 is the sample temperature, R is the sample radius, and th is the sample thermal conductivity. 1 is the external relaxation time due to radiative heat loss and 2 is the internal relaxation time due to the finite thermal conductivity of the sample. Heat capacity is determined by c p⫽ f 共 , 1 , 2 兲
P m共 兲 , ⌬T m 共 兲
c 共J g atom⫺1 K⫺2兲
共6兲
where f is a correction function for radiation loss and finite thermal conductivity, P m ( ) is the power of modulation, ⌬T m ( ) is the amplitude of temperature response to the power modulation, and is the frequency of modulation. Modulation frequencies of 0.08 and 0.12 Hz were used in these experiments.
d 共J g atom⫺1 K兲 2.83 ⫻ 106 6.43 ⫻ 106 6.32 ⫻ 106
0.0156 0.0112 0.0133
A differential thermal analyzer 共Perkin Elmer DTA-7兲, using a heating rate of 0.167 K s⫺1, was used to determine the heats of fusion, the solidus temperatures, and the liquidus temperatures of these alloys. Graphite crucibles were used in these experiments to minimize the reaction between the molten alloy and crucible.
III. RESULTS
Upon heating an amorphous alloy at a constant heating rate, the alloy goes through the glass transition, crystallizes, and then melts. This behavior is shown in Fig. 1, a DSC scan and a differential thermal analysis 共DTA兲 scan of Cu47Ti34Zr11Ni8 . The onset of the glass transition T g is indicated by a small endothermic rise. Crystallization begins at T x ⫽717 K, with three exothermic peaks. Zr52.5Cu17.9Ni14.6Al10Ti5 and Zr57Cu15.4Ni12.6Al10Nb5 both have a single crystallization peak after heating through the glass transition. For Cu47Ti34Zr11Ni8 , melting begins at the solidus temperature of 1114 K, with the alloy being completely molten at the liquidus temperature of 1128 K. Integrating the area of the melting peak, we find that the heat of fusion is 11.3 kJ g atom⫺1 for Cu47Ti34Zr11Ni8 . The characteristic temperatures as well as the heats of fusion of Cu47Ti34Zr11Ni8 and the other two alloys, Zr52.5Cu17.9Ni14.6Al10Ti5 and Zr57Cu15.4Ni12.6Al10Nb5 , are summarized in Table I. The specific heat capacity of the crystalline solid, the amorphous solid, the supercooled liquid, and the equilibrium liquid for each alloy is shown in Figs. 2共a兲–2共c兲. The specific heat capacity for the crystalline and the amorphous states was determined by DSC experiments, while the specific heat capacity of the undercooled liquid and the equilibrium liquid was determined by ac modulation calorimetry. Since the amorphous solid is not in thermodynamic equilibrium or metastable equilibrium in the glass transition region, heat capacity data in this region are not included. The heat capacity of a crystal well above the Debye temperature can be described by19 c p,crystal共 T 兲 ⫽3R⫹aT⫹bT 2 .
共7兲
The heat capacity of an undercooled liquid can be described by c p,liquid共 T 兲 ⫽3R⫹cT⫹dT ⫺2 , ⫺1
共8兲
⫺1
where R⫽8.314 52 J g atom K , and a, b, c, and d are fitting constants. The constants for both fits to the specific heat capacity data for each alloy are summarized in Table II.
Downloaded 12 Jan 2006 to 131.215.240.9. Redistribution subject to AIP license or copyright, see http://jap.aip.org/jap/copyright.jsp
J. Appl. Phys., Vol. 87, No. 10, 15 May 2000
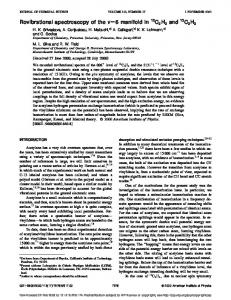
FIG. 3. The calculated difference in enthalpy between the liquid and the crystalline states as a function of temperature for 共a兲 Cu47Ti34Zr11Ni8 , 共b兲 Zr52.5Cu17.9Ni14.6Al10Ti5 , and 共c兲 Zr57Cu15.4Ni12.6Al10Nb5 . Also indicated on these plots are the Kauzmann temperature T K , the glass transition temperature T g 共onset with a heating rate of 0.333 K s⫺1兲, and the temperature at which the Gibbs free energy of the liquid and the crystalline states are taken to be equal, T f .
The specific heat capacity of Zr52.5Cu17.9Ni14.6Al10Ti5 in the undercooled liquid and equilibrium liquid was not measured with ac modulation calorimetry. However, the specific heat capacity of the liquid for many metallic glass forming
Glade et al.
7245
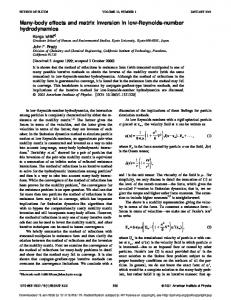
FIG. 4. The calculated difference in entropy between the liquid and the crystalline states for 共a兲 Cu47Ti34Zr11Ni8 , 共b兲 Zr52.5Cu17.9Ni14.6Al10Ti5 , and 共c兲 Zr57Cu15.4Ni12.6Al10Nb5 . Indicated on these plots are the Kauzmann temperature T K , the glass transition temperature T g 共onset with a heating rate of 0.333 K s⫺1兲, and the temperature at which the Gibbs free energy of the liquid and the crystalline states are taken to be equal T f .
and alloys, including Zr41.2Ti13.8Cu12.5Ni10Be22.5 , 8 9 Mg65Cu25Y10 , is approximately 40 J g atom⫺1 K⫺1 at the and melting temperature. For Cu47Ti34Zr11Ni8 Zr57Cu15.4Ni12.6Al10Nb5 共this work兲, the heat capacity near the melting temperature is approximately 45 J g atom⫺1 K⫺1.
Downloaded 12 Jan 2006 to 131.215.240.9. Redistribution subject to AIP license or copyright, see http://jap.aip.org/jap/copyright.jsp
7246
Glade et al.
J. Appl. Phys., Vol. 87, No. 10, 15 May 2000
TABLE III. The Kauzmann temperatures, the glass transition temperatures 共measured with a heating rate of 0.333 K s⫺1兲, and the entropies of fusion for the three alloys. TK 共K兲 Cu47Ti34Zr11Ni8 Zr52.5Cu17.9Ni14.6Al10Ti5 Zr57Cu15.4Ni12.6Al10Nb5
Tg 共K兲
537 638 664
673 675 682
⌬S f 共J g atom⫺1 K⫺1兲 10.1 7.6 8.5
Therefore, a specific heat capacity of 42.5 J g atom⫺1 K⫺1 at 1085 K was assigned to Zr52.5Cu17.9Ni14.6Al10Ti5 , so that the fitting constants for the liquid specific heat capacity could be determined. It is expected that this value is within 10% of the actual value. The difference in the specific heat capacity of the liquid and the crystalline states, ⌬c l⫺x p , was calculated. With these data, the differences in the thermodynamic functions of the liquid and the crystalline states can be determined. The calculated difference in enthalpy is given by ⌬H l⫺x 共 T 兲 ⫽⌬H f ⫺
冕
Tf
T
⌬c l⫺x p 共 T ⬘ 兲 dT ⬘
共9兲
and is shown in Figs. 3共a兲–3共c兲 for these alloys. In this equation, ⌬H f is the enthalpy of fusion and T f is the temperature at which the Gibbs free energy of the liquid and the crystalline states are equal. The difference in the enthalpy between the liquid and the crystalline states at the glass transition 共measured with a rate of 0.333 K s⫺1兲 is the amount of enthalpy frozen into the liquid at T g . T f , the temperature at which the Gibbs free energy of the liquid and the crystalline states are equal, is not known exactly for these alloys. However, the Gibbs free energy of the liquid and the crystalline states are equal to one another between the solidus and liquidus temperatures. T f was taken to be the temperature at which the endothermic peak is maximum during melting 共determined with the DTA兲, T peak , as listed in Table I. The calculated difference in entropy between the liquid and crystalline states is given by ⌬S l⫺x 共 T 兲 ⫽⌬S f ⫺
冕
Tf
T
⌬c l⫺x p 共T⬘兲 T⬘
dT ⬘
共10兲
and is shown in Figs. 4共a兲–4共c兲 for these alloys. T peak is used in place of T f in this calculation. ⌬S f , the entropy of fusion, is given by ⌬S f ⫽
⌬H f . Tf
共11兲
Entropy of fusion data are found in Table III. Similar to the ⌬H l⫺x (T) function that was calculated, there is residual entropy frozen into the glass below the glass transition temperature. The T K indicated on these plots is the calculated Kauzmann temperature. The Kauzmann temperature is the isentropic temperature, the temperature at which the entropy of the liquid is equal to the entropy of the crystal. This temperature is commonly believed to be the lowest temperature at which a supercooled liquid can exist without either spon-
FIG. 5. The calculated difference in the Gibbs free energy between the liquid and the crystalline states for 共a兲 Cu47Ti34Zr11Ni8 , 共b兲 Zr52.5Cu17.9Ni14.6Al10Ti5 , and 共c兲 Zr57Cu15.4Ni12.6Al10Nb5 . Indicated on these plots are the Kauzmann temperature T K , the glass transition temperature T g 共onset with a heating rate of 0.333 K s⫺1兲, and the temperature at which the Gibbs free energy of the liquid and the crystalline states are taken to be equal T f .
taneously crystallizing or forming a glass.20 Kauzmann temperature data are found in Table III. It is important to note that the entropy difference that is calculated from the heat capacity data is the total entropy difference between the liq-
Downloaded 12 Jan 2006 to 131.215.240.9. Redistribution subject to AIP license or copyright, see http://jap.aip.org/jap/copyright.jsp
Glade et al.
J. Appl. Phys., Vol. 87, No. 10, 15 May 2000
7247
TABLE IV. The critical cooling rates and the reduced glass transition temperatures for the three alloys in this work and two other metallic glass forming alloys, in order of decreasing glass forming ability. Critical cooling rate 共K s⫺1兲 Zr41.2Ti13.8Cu12.5Ni10Be22.5b Zr57Cu15.4Ni12.6Al10Nb5 Zr52.5Cu17.9Ni14.6Al10Ti5 Mg65Cu25Y10c Cu47Ti34Zr11Ni8
1 10 10 50 250
T rga 0.67 0.62 0.62 0.59 0.60
a
Determined using the onset of the glass transition measured with a heating rate of 0.333 K s⫺1 and the liquidus temperature measured with a heating rate of 0.167 K s⫺1. b See Ref. 8. c See Ref. 9.
FIG. 6. The calculated difference in the Gibbs free energy between the liquid and the crystalline states for a number of glass forming alloys 共see Ref. 9兲.
uid and the crystalline states and not the configurational entropy difference. The total entropy difference between the liquid and the crystalline states includes configurational entropy, communal entropy, and vibrational entropy. Thus, this calculated Kauzmann temperature does not necessarily represent the temperature where the configurational entropy of the liquid vanishes. The calculated difference in the Gibbs free energy between the liquid and crystalline states is given by
冉
⌬G l⫺x 共 T 兲 ⫽ ⌬H f ⫺
冉
冕
⌬c l⫺x p 共 T ⬘ 兲 dT ⬘
冊
冕
dT ⬘
Tf
T
⫺T ⌬S f ⫺
Tf
T
⌬c l⫺x p 共T⬘兲 T⬘
冊
共12兲
which is a good approximation immediately below the melting point. Initially, as the liquid is undercooled, the entropy of fusion ⌬S f determines the rate at which ⌬G l⫺x changes. Another parameter that is a qualitative indicator of the glass forming ability in glass forming alloys is the reduced glass transition temperature T rg . The reduced glass transition temperature is given by T rg⫽
Tg , Tm
共14兲
where T g is the glass transition temperature and T m is the melting temperature. It is a measure of the time spent in the supercooled liquid regime when cooling the liquid from the melt. Larger reduced glass transition temperatures indicate better glass forming ability; the temperature interval between the melting temperature and glass transition temperature is smaller, decreasing the likelihood of crystallization. Values of the critical cooling rates and T rg for the three alloys in this work and two other metallic glass forming alloys are given in Table IV.
and is shown in Figs. 5共a兲–5共c兲 for these alloys. V. SUMMARY AND CONCLUSION IV. DISCUSSION
A comparison of the Gibbs free energy difference between the liquid and the crystal for several metallic glass forming alloys9 is shown in Fig. 6, along with the estimated critical cooling rates for these alloys. In general, the lower the Gibbs free energy difference between the liquid and the crystalline states, the better the glass forming ability of the alloy 共according to the critical cooling rate兲. It is important to note that this Gibbs free energy difference is the driving force for crystallization only in the case of a polymorphic transformation. If the crystallization is not polymorphic 共as is the case for many metallic glass forming compositions兲, this free energy difference is the lower limit of the thermodynamic driving force for crystallization. Also, in general, the smaller the entropy of fusion, the better is the glass forming ability of these metallic glasses. This is understood by the Turnbull approximation21 ⌬G l⫺x ⫽⌬H f ⫺T⌬S f ,
共13兲
The thermodynamic functions of three bulk glass forming alloys, Cu47Ti34Zr11Ni8 , and Zr52.5Cu17.9Ni14.6Al10Ti5 , and Zr57Cu15.4Ni12.6Al10Nb5 , were determined. To do this, the heat capacity in the crystalline solid, the amorphous solid, the supercooled liquid, and the equilibrium liquid, and the heats of fusion for these alloys were measured. The Gibbs free energy difference between the liquid and the crystalline states gives a qualitative measure of the glass forming ability of these glass forming alloys. ACKNOWLEDGMENTS
The authors thank S. Bossuyt, H. Choi-Yim, and C. C. Hays for assistance in the laboratory and John Haygarth of Teledyne Wah-Chang for providing material for the TEMPUS samples. They also thank Team TEMPUS for helping make the MSL-1 space shuttle flight experiments successful. This work was supported by NASA 共Grant No. 4NAG8-1182兲. S.C.G. acknowledges fellowship support from NDSEG.
Downloaded 12 Jan 2006 to 131.215.240.9. Redistribution subject to AIP license or copyright, see http://jap.aip.org/jap/copyright.jsp
7248
W. Klement, R. H. Willens, and P. Duwez, Nature 共London兲 187, 869 共1960兲. 2 A. Inoue, T. Zhang, and T. Masumoto, Mater. Trans., JIM 31, 425 共1990兲. 3 T. Zhang, A. Inoue, and T. Masumoto, Mater. Trans., JIM 32, 1005 共1991兲. 4 A. Inoue, A. Kato, T. Zhang, S. G. Kim, and T. Masumoto, Mater. Trans., JIM 32, 609 共1991兲. 5 A. Peker and W. L. Johnson, Appl. Phys. Lett. 63, 2342 共1993兲. 6 X. H. Lin and W. L. Johnson, J. Appl. Phys. 78, 6514 共1995兲. 7 Y. J. Kim, R. Busch, W. L. Johnson, A. J. Rullison, and W. K. Rhim, Appl. Phys. Lett. 65, 2136 共1994兲. 8 R. Busch, Y. J. Kim, and W. L. Johnson, J. Appl. Phys. 77, 4039 共1995兲. 9 R. Busch, W. Liu, and W. L. Johnson, J. Appl. Phys. 83, 4134 共1998兲. 10 A. Masuhr, R. Busch, and W. L. Johnson, J. Non-Cryst. Solids 252, 566 共1999兲. 11 U. Geyer, S. Schneider, W. L. Johnson, Y. Qui, T. A. Tombrello, and M. 1
Glade et al.
J. Appl. Phys., Vol. 87, No. 10, 15 May 2000
P. Macht, Phys. Rev. Lett. 75, 2364 共1995兲. K. Ohsaka, S. K. Chung, W. K. Rhim, A. Peker, D. Scruggs, and W. L. Johnson, Appl. Phys. Lett. 70, 726 共1997兲. 13 X. H. Lin, Ph.D. thesis, California Institute of Technology, 1997. 14 H. Choi-Yim, R. Busch, and W. L. Johnson, J. Appl. Phys. 83, 7993 共1998兲. 15 H. Choi-Yim, R. Busch, U. Ko¨ster, and W. L. Johnson, Acta Mater. 47, 2455 共1999兲. 16 H. J. Fecht and W. L. Johnson, Rev. Sci. Instrum. 62, 1299 共1991兲. 17 R. K. Wunderlich and H. J. Fecht, Int. J. Thermophys. 17, 1203 共1996兲. 18 J. Szekely, E. Schwartz, and R. Hyers, JOM 47, 50 共1995兲. 19 O. Kubaschewski, C. B. Alcock, and P. J. Spencer, Materials Thermochemistry, 6th ed. 共Permagon, New York, 1993兲. 20 W. Kauzmann, Chem. Rev. 43, 219 共1948兲. 21 D. Turnbull, J. Appl. Phys. 21, 1022 共1950兲. 12
Downloaded 12 Jan 2006 to 131.215.240.9. Redistribution subject to AIP license or copyright, see http://jap.aip.org/jap/copyright.jsp