aspects of KEEL software: An educational module well suited to be used in Data Mining, Machine Learning and Knowledge. Discovery in Databases ..... the best accuracy in 4 of 10 data sets, whereas C4.5 obtains the best average result.
Using KEEL Software as a Educational Tool: A Case of Study Teaching Data Mining J. Derrac, J. Luengo, J. Alcal´a-Fdez Department of Computer Science and Artificial Intelligence, CITIC-UGR, University of Granada 18071 Granada, Spain {jderrac,julianlm,jalcala}@decsai.ugr.es
designed to tackle a particular application - therefore being very hard to use in a practical context. This entails the necessity of performing various modifications and adaptations to the original source codes, risking the correctness of the implementations and thus the reliability of the conclusions achieved. In the last few years, many software tools have been developed to ease these problems. Although most of them are commercially distributed, a few are available as open source software such as Weka [2] or Java-ML [3], highlighting the role of open source tools in the development of the research community [4] (we recommend visiting the KDnuggets software directory 1 and The-Data-Mine site 2 ). KEEL [5] is an open source Java software tool to assess computational intelligence algorithms for DM problems including regression, classification, clustering and so on. It contains a big collection of classical and up-todate techniques, including preprocessing and postprocessing approaches, hybrid models, statistical methodologies for contrasting experiments and so forth [6]. It allows to perform a complete analysis of new computational intelligence proposals in comparison to existing ones. Moreover, KEEL has been designed with a double goal: research and educational. In this work, we will focus on the educational aspects of KEEL, presenting its educational module. This tool offers a real-time view of the evolution of the algorithms, allowing the students to use this information in order to learn how to adjust their parameters. In this sense, the educational module is a simplified version of the main KEEL research tool, where only the most relevant techniques are available. Using it, the user has a visual feedback of the progress of the algorithms, and can access the final results from the same interface used to design the experiments. This tool can be used in transnational education, for example, in the framework of international educational programs [7]. Its employment can be interesting for students in DM, ML or KDD courses worldwide, due to the wide set of application fields in which these techniques can be used and the availability of the software tool through the KEEL project website (http://www.keel.es).
Abstract—Regarding information technologies, transnational education has to face several challenges in order to offer a suitable education for computer science students worldwide. Software tools, and specially open source ones, give to the students the possibility of experiment with the most known techniques in the area. Among them, the KEEL software tool can be highlighted as a versatile framework for understanding the mechanics of several computational intelligence fields. The aim of this contribution is to present the educational aspects of KEEL software: An educational module well suited to be used in Data Mining, Machine Learning and Knowledge Discovery in Databases courses. This module provides the user with a visual feedback of the progress of the algorithms, thus being helpful in the task of evaluating and understanding the behavior of classic and modern techniques in these fields. Keywords-Data Mining; Machine Learning; Knowledge Discovery in Databases; Java; Software Tool; Educational Tool
I. I NTRODUCTION Nowadays, undergraduate and graduate students in computer science and other fields usually take several subjects where advanced Knowledge Discovery in Databases (KDD) techniques are taught. These techniques compose a set of key concepts for understanding the role of Data Mining (DM) and Machine Learning (ML) [1], providing students with a very important tool for their professional training. Most of these techniques are somewhat complex. They require a thorough practical analysis in order to enable students to understand the most prominent advantages and disadvantages of each one. This analysis allows a better understanding of each of their components and their behavior over different kind of problems, thus helping to discern which one fits better to a particular case. The underlying problem here is that most of these techniques require a certain programming expertise along with considerable time and effort to write the computer program. In this way, KDD lessons become to mere programming classes instead of focusing into analyzing the different traits that characterize each technique. This problem can only be eased with the use of software tools that relieve students from programing tasks, allowing them to focus into the intrinsic characteristics of the KDD algorithms. In the Web we cannot find too many implementations of these techniques. Moreover, most of them are specifically
c 978-1-4577-1126-8/11/$26.00 �2011 IEEE
A. Fern´andez, S. Garc´ıa Department of Computer Science University of Ja´en 23071 Ja´en, Spain {alberto.fernandez,sglopez}@ujaen.es
1 http://www.kdnuggets.com/software 2 http://the-data-mine.com/bin/view/Software
55
A successful case of use of KEEL in transnational educational programs can be found at the MIBISOC (Medical Imaging using Bio-Inspired and Soft Computing) project 3 . The KEEL software was presented in the training course, within its ML teaching module. Students used KEEL to ease their first experience with ML problems, using well-known algorithms to tackle some problems of the area. The rest of this work is organized as follows: Section II gives a brief description of the features of the KEEL software tool. Section III describes the educational module, pointing out its most outstanding capabilities. Section IV shows a case of study considering several data mining methods. Finally, Section V concludes the work. II. KEEL D ESCRIPTION KEEL is a software tool to assess computational intelligence algorithms for DM problems including regression, classification, clustering, pattern mining and so on. The presently available version of KEEL consists of the following function blocks (see Figure 1):
Figure 1. •
•
•
Screenshot of the main window of KEEL software tool
Data Management: This part is made up of a set of tools that can be used to export and import data in other formats to or KEEL format, data edition and visualization, to apply partitioning to data and so on. Design of Experiments: The main section of KEEL is devoted to the design of experiments, providing many options in different areas: type of validation, type of learning (classification, regression, unsupervised learning) and so on. Once the experiments has been generated, they can be carried out in batch mode. Educational Experiments: With a similar structure to the previous part, this one allows to design experiments that can be run step-by-step in order to display the learning process of a certain model. The results of the
3 MIBISOC is a Marie Curie International Training Network granted by the European Commission within the Seventh Framework Program (FP7 PEOPLE-ITN- 2008). http://www.softcomputing.es/mibisoc/
56
experiments are reported in the same GUI, providing a way to learn how the different algorithms behave. • Modules: This category give access to several additional modules, including a framework specialized in imbalanced learning [8], a nonparametric statistical analysis module [9], [10], and a module for multiple instance learning [11]. This structure makes KEEL software useful for different types of user, who expect to find different functionalities in a DM software. Shortly, we describe the main features of KEEL: • It presents a large collection of evolutionary algorithms for predicting models, preprocessing (evolutionary feature and instance selection) and postprocessing (evolutionary tuning of fuzzy rules). It also contains many state-of-the-art methods for different areas of DM such as decision trees, fuzzy rule based systems or crisp rule learning. • It includes data preprocessing algorithms proposed in the specialized literature: data transformation, discretization, instance and feature selection, noise filtering and so forth. • It has a statistical library to analyze algorithms’ results. It comprises a set of statistical tests for analyzing the suitability of the results and performing parametric and nonparametric comparisons among the algorithms. • It provides a user-friendly interface, oriented to the analysis of algorithms. • The software is aimed to create experimentations containing multiple data sets and algorithms connected among themselves to obtain an expected results. Experiments are independently script-generated from the user interface for an off-line run in the same or other machines. For more information about the main features of the KEEL tool, please refer to [5], [6] or to the website of the KEEL project (http://www.keel.es). III. E DUCATIONAL M ODULE Inside an e-learning environment, the needs of a student are quite different to those of a researcher (that is, performing experiments with a large number of problems and state-of-the-art methods, followed by statistically sound comparisons between them). Generally speaking, if the tool is to be used in class, the students will need to perform short-sized experiments focused on a real-time view of the evolution of the algorithms, in order to learn how the algorithms behave. In this sense, the educational tool has been developed with a focus in the most representative elements of each area. It offers the most relevant preprocessing and learning approaches, together with a wide collection of techniques and problem instances which properly represents the main characteristics of the classification and regression problems.
Second International Conference on EUropean Transnational Education (ICEUTE 2011)
Figure 2. Selection of data sets for the experiments. New sets may be added as needed, through the Import button.
Figure 4. Experiment management window. Results for each method are reported, including performance measures, time elapsed and models generated.
techniques is critical, since it will not be very likely that students in these stages of its formation will have a deep understanding of most of the techniques’ mechanics.
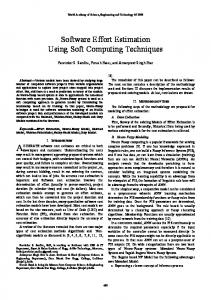
Figure 3. A experiment analyzing the effects of Las Vegas Filter Feature Selection method over 4 classifiers: K-Nearest Neighbors, a Radial Basis Function Neural Network, a Support Vector Machine, and Naive Bayes. Fayyad et al. discretizer is used to asses data for the Naive Bayes method.
When generating a experiment with the Educational module, the first step is to select the area and validation scheme in which it will be based. After the kind of the problem (classification or regression) and the scheme of validation (k-fold cross validation, 5x2-fold cross validation or without validation) have been selected, the user is prompted to select the data sets that will be used in the experiment. Figure 2 shows an example for the classification problem. Note that the inclusion of new data sets is also possible here, by using the Import button under the User Datasets area. The GUI allows the user to design experiments in a graphical way, including algorithms and preprocessing methods. Figure 3 depicts an experiment designed for testing several state-of-the-art classifiers if a feature selection method is used for preprocessing the training data. Using a drag-anddrop mechanism, students can design these kind of experiments without the necessity of using hard and complicate mechanisms for configuring the data sets, algorithms, and the rest of aspects of a major experimental design. This aspect is especially important if we consider that the Educational Module offers a wide collection of methods belonging to very different fields. Thus, the necessity of an easy procedure to create and set-up experiments using these
In the Educational module, the experiment is carried out in real time. When an experiment is designed the user can choose either to save the experiment in a XML file or to run it. If the user chooses to run it, then the system will show an auxiliary window to manage and visualize the execution of each algorithm (Figure 4). The user/teacher can start, suspend/pause and stop the experiment at any moment in order to see step by step partial reports of the experimentation. When the run finishes, this window will show the results obtained for each algorithm in separate tags reporting, for instance, the confusion matrices for classification or the mean square errors for regression problems. In this way, the user has a visual feedback of the progress of the algorithms, being able to access to the final results from the same interface used to design the experimentation formerly. In the report area, the models generated by the algorithms are prompted, providing the user with a snapshot of the knowledge extracted from the data set and its intrinsic structure (for instance, decision trees algorithms will prompt a representation of the trees built, whereas rule-based methods will output the rule base generated, and so forth). This module is ideal for students willing to analyze and improve the results obtained with a given methodology. In this way, the students can test the performance of two related methods in a fixed set of problems. Another possibility would be to select a set of representative methods from various techniques, applying them to a data set with the objective to determine which kind of techniques achieve a better performance on it. Using the information contained in the reports, the user may interpret the results and determine the causes of the good/bad behavior of a given method, and furthermore, try to improve its performance by, for example, changing the parameters that governs its behavior.
Second International Conference on EUropean Transnational Education (ICEUTE 2011)
57
Table I DATA SETS USED IN THE STUDY Data set Bupa Ecoli Glass Haberman Iris
# Ex. # At. # Cl. 345 336 214 306 150
6 7 9 3 4
2 8 7 2 3
Data set Monk-2 New-Thyroid Pima Vehicle Wine
# Ex. # At. # Cl. 432 215 768 846 178
6 5 8 18 13
2 3 2 4 3 Figure 5.
Table II A LGORITHMS CONSIDERED Acronym
Name
C-SVM Chi-RW C4.5 KNN NB RBFN
C-Support Vector Machine Chi et al. Fuzzy Rule Learning Model C4.5 Decision Tree K-Nearest Neighbors Naive Bayes Radial Basis Function Neural Network
[12] [13] [14] [15] [16] [17]
Fayyad
Fayyad et al. discretizer (for NB)
[18]
Graph of the experiment performed as case of study
Reference
IV. C ASE OF S TUDY In this section, we will conduct a small experimental study analyzing the accuracy of several well-known ML techniques over various problem instances of the supervised classification area. Our aims are to analyze the behavior of these techniques and to determine which one fits better to the set of problems selected. Table I describes the main characteristics of the 10 data sets selected: # Ex. denotes the number of examples in the data set, # At. stands for the number of attributes and # Cl. means the number of classes. These data sets have been taken from the KEEL-Dataset repository 4 , and are available in the KEEL software. As validation scheme for them, we will use the 10-folds cross validation procedure. In general, this scheme is preferred over the use of a single training and test partition since it is less sensitive to overfitting and allows to employ each of the instances of the data set as testing data at least once (note that the partitioning process is performed automatically by KEEL, thus users does not need to perform any additional operations to use this scheme). Table II shows the algorithms used (for any KEEL method, appropriate references can be found both in the help of the tool and in the Included Algorithms section of the website of the KEEL project 5 ). Each method implemented in KEEL offers a default set-up for any parameter, following the recommendations of the methods’ original authors. In this study, we will use these default parameters (they can be seen at the use case offered by the module for each method). After all these elements have been chosen, we can draw the graph of the experiment (see Figure 5) considering the 7 different techniques of Table II. Then, we may launch the 4 http://www.keel.es/datasets.php 5 http://www.keel.es/algorithms.php
58
Figure 6. module
Control interface for managing experiments in the Educational
Figure 7. Results reported for C-SVM in test phase. Average accuracy, accuracy in each partition and the general confusion matrix can be found in this report
experiment. Using the control interface (Figure 6), we can control whether to start, suspend or terminate it. As soon as each run is finished, the results are shown at the report area. For each method and data set, a complete report shows the accuracy and confusion matrices obtained in training and test phase (see Figure 7). Using these reports, we have obtained the Table III, showing the average accuracy results obtained in test phase (expressed in the [0, 1] interval). The best results are highlighted in bold. As can be seen in the table, C-SVM achieves the best accuracy in 4 of 10 data sets, whereas C4.5 obtains the best average result. This is interesting because this best
Second International Conference on EUropean Transnational Education (ICEUTE 2011)
Figure 8. Models generated by C-SVM (left) and Chi-RW (right) methods. Note that the attribute a5 is split in a different way in each one. Another major difference lies in the fact that Chi-RW use all the attributes in its model, whereas C4.5 does not considers attributes a1, a3 and a6
Table III R ESULTS OBTAINED (ACCURACY IN TEST PHASE ) Data set
C-SVM Chi-RW
C4.5
KNN
NB
RBFN
Bupa Ecoli Glass Haberman Iris Monk-2 New-Thyroid Pima Vehicle Wine
0.7010 0.7580 0.6210 0.7280 0.9660 0.8050 0.9810 0.7700 0.7990 0.9430
0.5790 0.7200 0.5980 0.7320 0.9260 0.4280 0.8410 0.7300 0.6070 0.9380
0.6920 0.7940 0.6720 0.7320 0.9600 1.0000 0.9250 0.7390 0.7410 0.9490
0.6110 0.8060 0.7330 0.6690 0.9330 0.7770 0.9720 0.6990 0.7000 0.9550
0.5710 0.8210 0.7190 0.7280 0.9260 0.9720 0.9530 0.7520 0.5910 0.9880
0.6400 0.3720 0.4760 0.6920 0.9130 0.9670 0.8790 0.7030 0.3540 0.6910
Average
0.8072
0.7099 0.8204 0.7855 0.8021 0.6687
average result is not achieved by the method with the best result in most data sets. This suggest that the set of problems selected contains different instances which are easier or harder to the classifiers depending on their characteristics, thus there is not a clear winner in this comparison. Moreover, the reports obtained through the Educational module also offers information about the models built in the training phase. This can be very useful in case that we
would be interested in determining why a given algorithm has shown an outstanding/poor behavior in a given problem. For example, a teacher could ask to their students to conduct this particular experiment and question their students about the reasons of the poor performance of the Chi-RW method when compared with C4.5 in the Monk-2 problem. If students look carefully at the two models generated (see Figure 8), they could find the reason: The most important attribute used by C4.5 for performing the classification (a5) is incorrectly split by the fuzzy rules of the Chi-RW method. The cut point defined by C4.5 at 3.0 is obviated by Chi-RW, giving it a high membership value (the centers of the two last labels of the a5 attribute are very near, 2.5 and 4). The students may proceed from this point, looking for a better set-up for the Chi-RW algorithm that obtains suitable rules for this issue, aiming to improve its accuracy. In this case of study, we have shown the usefulness of the Educational module framework as a tool for allowing students to analyze the performance and the models generated by very different techniques, without requiring to implement them. This let them to focus their efforts in the analysis of the algorithms and its behavior regarding the problems
Second International Conference on EUropean Transnational Education (ICEUTE 2011)
59
selected and the parameters’ configuration used, instead of wasting their time coding them. We have also point out how a full experiment considering 10 different classification problems and 6 techniques (coming from very different fields such as neural networks, support vector machines or fuzzy systems) can be performed very easily, without requiring the user to search in Internet for each resource. V. C ONCLUSION In this work we have presented KEEL as a educational tool for supporting the teaching of DM, ML and KDD subjects worldwide. The data sets and techniques implemented in its educational module allows teachers to use this software tool as a valuable resource in the task of giving students a deep overview on the characteristics of regression and classification problems. To demonstrate the capabilities of the module, we have illustrated a case of use where a comparison between several state-of-the-art techniques in classification is done. The results of the algorithms considered have been shown through the on-line reporting tool, obtaining relevant information about performance measures and models generated. This information has allow us to achieve several conclusions in an easy way, without the necessity of hard-coding any experimental method or performing any additional programming work regarding to the acquisition of results. In this way, similar processes can be followed by students or teachers in order to experiment with any of the techniques included in the educational module, without any additional requirements. ACKNOWLEDGMENT This work has been supported by the Project TIN200806681-C06-01. J. Derrac holds a FPU scholarship from Spanish Ministry of Education. J. Luengo holds a postdoctoral research contract at the University of Granada. R EFERENCES [1] E. Mjolsness and D. DeCoste, “Machine learning for science: State of the art and future prospects,” Science, vol. 293, pp. 2051–2055, 2001. [2] R. R. Bouckaert, E. Frank, M. A. Hall, G. Holmes, B. Pfahringer, P. Reutemann, and I. H. Witten, “Weka experiences with a java open-source project,” Journal of Machine Learning Research, vol. 11, pp. 2533–2541, 2010. [3] T. Abeel, Y. V. de Peer, and Y. Saeys, “Java-ML: A machine learning library,” Journal of Machine Learning Research, vol. 10, pp. 931–934, 2009. [4] S. Sonnenburg, M. Braun, C. Ong, S. Bengio, L. Bottou, G. Holmes, Y. LeCun, K.-R. M¨uller, F. Pereira, C. Rasmussen, G. R¨atsch, B. Sch¨olkopf, A. Smola, P. Vincent, J. Weston, and R. Williamson, “The need for open source software in machine learning,” Journal of Machine Learning Research, vol. 8, pp. 2443–2466, 2007.
60
[5] J. Alcal´a-Fdez, L. S´anchez, S. Garc´ıa, M. del Jesus, S. Ventura, J. Garrell, J. Otero, C. Romero, J. Bacardit, V. Rivas, J. Fern´andez, and F. Herrera, “KEEL: A software tool to assess evolutionary algorithms to data mining problems,” Soft Computing, vol. 13, no. 3, pp. 307–318, 2009. [6] J. Alcal´a-Fdez, A. Fern´andez, J. Luengo, J. Derrac, S. Garc´ıa, L. S´anchez, and F. Herrera, “Keel data-mining software tool: Data set repository, integration of algorithms and experimental analysis framework,” Journal of Multiple-Valued Logic and Soft Computing, vol. 17, no. 2-3, 2011. [7] B. Baruque, A. Herrero, E. Corchado, and J. Sedano, “Implementation of the european computer science course under the spanish university education system,” in International Conference on European Transnational Education (ICEUTE 2010), Burgos, Spain. University of Burgos, 2010, pp. 1022– 1029. [8] G. E. A. P. A. Batista, R. C. Prati, and M. C. Monard, “A study of the behaviour of several methods for balancing machine learning training data,” SIGKDD Explorations, vol. 6, no. 1, pp. 20–29, 2004. [9] J. Derrac, S. Garc´ıa, D. Molina, and F. Herrera, “A practical tutorial on the use of nonparametric statistical tests as a methodology for comparing evolutionary and swarm intelligence algorithms,” Swarm and Evolutionary Computation, vol. 1, no. 1, pp. 3–18, 2011. [10] S. Garc´ıa and F. Herrera, “An extension on statistical comparisons of classifiers over multiple data sets for all pairwise comparisons,” Journal of Machine Learning Research, vol. 9, pp. 2579–2596, 2008. [11] T. Dietterich, R. Lathrop, and T. Lozano-P´erez, “Solving the multiple instance problem with axis-parallel rectangles,” Artifical Intelligence, vol. 89, no. 1–2, pp. 31–71, 1997. [12] C. Cortes and V. Vapnik, “Support-vector networks,” Machine Learning, vol. 20, no. 3, pp. 273–297, 1995. [13] Z. Chi, H. Yan, and T. Pham, Fuzzy algorithms with applications to image processing and pattern recognition. World Scientific, 1996. [14] J. R. Quinlan, C4.5: Programs for Machine Learning. Morgan Kauffman Publishers, San Mateo-California, 1993. [15] T. M. Cover and P. E. Hart, “Nearest neighbor pattern classification,” IEEE Transactions on Information Theory, vol. 13, no. 1, pp. 21–27, 1967. [16] P. Domingos and M. Pazzani, “On the optimality of the simple bayesian classifier under zero-one loss,” Machine Learning, vol. 29, pp. 103–137, 1997. [17] D. L. D. S. Broomhead, “Multivariable functional interpolation and adaptative networks,” Complex Systems, vol. 11, pp. 321–355, 1988. [18] U. M. Fayyad and K. B. Irani, “Multi-interval discretization of continuous-valued attributes for classification learning,” in 13th International Joint Conference on Uncertainly in Artificial Intelligence. Chambery, France (IJCAI93), 1993, pp. 1022–1029.
Second International Conference on EUropean Transnational Education (ICEUTE 2011)