Fisheries Research 66 (2004) 373–379
Short communication
Using knowledge from fishers and fisheries scientists to identify possible groundfish ‘Essential Fish Habitats’ M. Bergmann a,∗ , H. Hinz a , R.E. Blyth a , M.J. Kaiser a , S.I. Rogers b , M. Armstrong c a
School of Ocean Sciences, University of Wales at Bangor, Menai Bridge LL59 5AB, UK b Centre for Environment, Fisheries and Aquaculture, Lowestoft, UK c Department of Agriculture and Rural Development, Belfast, UK
Received 21 November 2002; received in revised form 4 July 2003; accepted 18 July 2003
Abstract Fishers have often complained that standard fisheries survey data do not adequately reflect the grounds targeted by commercial fishers and hence scientists tend to make over-cautious estimates of fish abundance. Such criticisms are of particular importance if we are to make a creditable attempt to classify ‘Essential Fish Habitat’ using existing large-scale standard trawl surveys. Nevertheless, these data sets provide a powerful tool to examine consistent patterns in the temporal abundance of fish on a spatial scale. Here, we report a questionnaire survey of fishers that invited them to indicate the location of grounds of key importance for gadoid fishes. In addition, fishers were asked to indicate whether they had noticed key habitat features that might indicate the characteristics of EFH. A comparison of such areas as highlighted by fishers with data from standard groundfish surveys were broadly compatible for all three species of gadoids examined. Many sampling stations of these surveys fell outside areas highlighted by fishers as key fishing grounds/habitats. Fishers were able to provide usable biological observations that were consistently cross-referenced by several independent sources, for example the occurrence of haddock over brittlestar beds. We conclude that fishers’ knowledge is an invaluable supplement to existing data sets that can help to better focus more detailed studies of EFH. © 2003 Elsevier B.V. All rights reserved. Keywords: Essential Fish Habitat; Traditional ecological knowledge; Fisheries management; Gadus morhua; Merlangius merlangus; Melanogrammus aeglefinus
1. Introduction Despite of centuries of intensive commercial exploitation of fish in European waters, scientists know surprisingly little about the variation in the habitat requirements of certain commercially exploited fish species. In recent years, the wider ecological effects ∗ Corresponding author. Tel.: +44-1248-388124; fax: +44-1248-716367. E-mail address:
[email protected] (M. Bergmann).
of fishing have become a global environmental concern (e.g. Collie et al., 2000). A consideration of the effects of fishing on marine habitat that is critical for commercially important fish species became a legal requirement in the US with the reauthorisation of the Magnuson-Stevens Fisheries Conservation and Management Act (1996). These habitats have been termed ‘Essential Fish Habitats’ (EFH) and would include areas that are spawning and nursery grounds, provide specific feeding resources and shelter from predators and form part of a migration route (Benaka, 1999).
0165-7836/$ – see front matter © 2003 Elsevier B.V. All rights reserved. doi:10.1016/j.fishres.2003.07.007
374
M. Bergmann et al. / Fisheries Research 66 (2004) 373–379
This new emphasis on EFH has resulted in a number of studies in north America (e.g. Benaka, 1999). Cod (Gadus morhua L.), haddock (Melanogrammus aeglefinus (L.) and whiting (Merlangius merlangus (L.) and plaice (Pleuronectes platessa L.) are the most important demersal fish species targeted in the United Kingdom although landings have decreased considerably over the past decade (DEFRA, 2000). Fishing effort remains high whilst spawning stocks have fallen below their precautionary level, and the numbers of young fish have generally declined since 1990, raising concerns about the risk of stock collapse. The spawning grounds and nursery areas of many species of fish are well known. One component of EFH, that to date has received little attention, would constitute those areas in which adult fish are able to feed effectively and reduce their risk of predation. The habitat specific behaviour of some fishes is used by fishers to target particular species. Demersal fishers observe samples from the seabed each time they haul their nets, which far exceeds the sampling schemes that scientists can sustain (Maynou and Sardà, 2001). Furthermore, experienced fishers have knowledge based on decades of observations that has been passed down from one generation to the next (Freire and Garc´ıa-Allut, 1999). In addition, they often keep detailed records of exactly where and when they fish and how much they catch. Present day ship-based electronic instruments permit fishers to see first-hand the link between their catches and different seabed types. Although the ultimate goal of fishing is to provide income, rather than to test scientific hypotheses, many fishermen seek to understand the very questions that motivate our study. The need to improve the collaboration between scientists and the fishing industry is widely recognised by scientists and fishers alike (e.g. Taylor, 1998; Freire and Garc´ıa-Allut, 1999; Baelde, 2001; Mackinson, 2001; Maynou and Sardà, 2001; Moore, 2003). The involvement of the fishing industry in fisheries science might not only improve the credibility of fisheries science but also enhance the support for any regulations that may be based upon it. To date, little use is made of fishers’ knowledge in management decision making processes (but see Pederson and Hall-Arber, 1999). In the present paper, two complementary approaches were adopted to identify possible locations
and characteristics of EFHs as a basis for further scientific survey. Data from national scientific groundfish surveys were compared with information on fishing grounds provided by fishers during interviews and from questionnaires. 2. Methods 2.1. Identification of potential EFHs using groundfish surveys Areas of the seabed that consistently harbour high densities of cod, haddock and whiting in the Irish Sea (ICES division VIIa) were identified using two databases of fishery-independent data from groundfish surveys. The Centre for Environment, Fisheries and Aquaculture Science (CEFAS, Lowestoft) holds a data set from 1990 to 1998. Fish were sampled with a 4-m beam trawl at fixed stations every autumn (Ellis et al., 2002). The Department of Agriculture and Rural Development (DARD, Belfast) database spans a period from 1991 to 2000. Fish were caught by otter-trawling at fixed stations every summer/autumn (Ellis et al., 2002). The abundance of each species for each station per year was ranked and a mean rank over time (per station) calculated to identify potential EFHs for future habitat survey (Hinz et al., 2003; Bergmann et al., unpublished data). Plots of mean abundance or total abundance over time were not considered useful to identify habitats that are used consistently from 1 year to the next as a strong year class could skew the results. Our rationale for using a rank score was that it is most relevant to know which habitat is consistently attractive to fish. These ranks were plotted using ARC VIEW GIS 3.2. 2.2. Identification of potential EFHs using fishers’ knowledge Following an introduction of the project in the national industry paper ‘Fishing News’ we liased with the fishing industry to refine the resolution of our broad-scale fish maps (groundfish surveys). Information was gathered in a pilot study through questionnaire-based interviews with maps at an annual national fishing exhibition in Glasgow (respondents
M. Bergmann et al. / Fisheries Research 66 (2004) 373–379
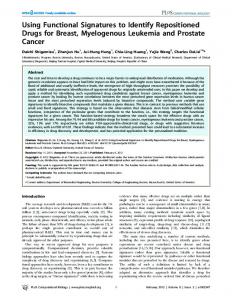
were selected at random). Sample size was limited by the time available to undertake interviews and the willingness of potential participants. The questionnaire was designed to study fishers’ perceptions of the relationship between commercially important fish and habitat features, perceived changes in abundance and to gain information about the location of potential EFHs. It consisted of 16 questions in total (Pederson and Hall-Arber, 1999) that were variously dichotomous, multiple choice and open-ended. Only six questions are analysed here due to constraints of space. More data were gathered by mailing revised questionnaires with maps to Sea Fisheries Committees and other relevant organisations. Additional interviews were conducted at a fishing exhibition in Newcastle (Northern Ireland) (n = 5). We collated a total of 39 questionnaires and 28 maps. These hand-drawn plots on standardised maps were digitised as a chart (GIS) suitable for comparison with those generated from groundfish surveys. The responses to questionnaires were analysed by calculating the frequency of statements made. 3. Results 3.1. Fishing ground locations and distribution of mean ranks of fish abundance Most fishers were responsive and helpful during interviews. The Fleetwood Fish Forum (a fishers’ organisation) provided a high-resolution chart detailing the seasonal distribution of commercial fish species in the eastern Irish Sea, which represents the aggregated knowledge of some 50 fishers. Many respondents operated outside the Irish Sea or targeted other species. Therefore, only 18 of these maps are included in Fig. 1A–C (this figure includes the Fleetwood chart counted as n = 1). The locations of fishing grounds for cod and whiting were similar (Fig. 1A and B). The main fishing grounds were located between the Isle of Man and Scotland, around the Solway Firth, New England and Wales. Similarly, groundfish survey data indicated that the highest mean ranks of cod were situated off the Ribble estuary, Belfast Lough, Anglesey/Colwyn Bay, Solway Firth and the central Irish Sea (Fig. 1A). Several fishers plotted areas in this region and off
375
the northern coast of Wales independently, which increases our confidence in these data. There was broad consistency between the whiting fishing grounds indicated by fishers and the distribution of high mean ranks of whiting (Fig. 1C) although no fishing grounds were indicated off the Ribble Estuary, which had a consistent high mean rank abundance of whiting. Fishing grounds for haddock were largely located along the Irish coast and the Solway Firth. The distribution of high haddock mean ranks was similar to the distribution of fishing grounds although groundfish surveys indicated low abundances in the NE Irish Sea were several fishers highlighted grounds of key importance (Fig. 1B). 3.2. Questionnaires 3.2.1. What do you regard as important ground features for your target species? Cod, haddock and whiting were targeted by 16 out of a total of 39 respondents. The most important ground types stated for cod included sand (56%), mud (56%), ‘hard’ ground (comprises the categories boulders, cobble, rocks, stones, ‘rough’) (44%) and gravel/shingle (31%). The most frequently stated habitat features for cod included sand, feed (which we interpret to mean the ground that contained food for the fish), hard grounds (each 25%), wrecks, gravel (each 19%), mixed grounds and mussel beds (each 6%). For haddock the most frequently stated ground types were hard grounds (69%), sand (56%), mud (50%) and gravel/shingle (38%). Haddock habitat features included hard grounds (25%), brittlestar beds (19%), feed (19%), gravel, sand, mud (13%), seaweed (we interpret this to mean emergent growths of weed-like bryozoans) and mixed grounds (6%). Important grounds for whiting comprised mud (56%), sand (50%), hard grounds (31%) and gravel/shingle (31%). The most frequently stated habitat features were hard grounds (19%), mud, sand, gravel (13%), sea grass1 and soft corals (Alcyonium digitatum) (6%). Sandeels were perceived as important prey items of cod (67%) and haddock (80%), followed by ‘small fish’ (50 and 60%, respectively) shrimps (25 1 Although the respondent used the term ‘sea grass’ we doubt that the angiosperm plant was meant. It seems more likely that he used this term for sea weed or weed-like bryozoans or hydroids.
376
M. Bergmann et al. / Fisheries Research 66 (2004) 373–379
Fig. 1. Distribution of mean ranks of fish abundance (( ) CEFAS; ( ) DARD)) in the Irish Sea from 1990 to 2001 and fishing ground locations as outlined by fishers: (A) cod, 17 maps in total with 41 grounds; (B) haddock, eight maps with 16 grounds; (C) whiting, 10 maps with 22 grounds.
and 40%, respectively) and small crabs (38 and 20%, respectively). The response rate to this open-ended question was relatively low: 25% of the respondents did not comment on cod habitat features, haddock habitat (44%) or whiting habitat (69%). 3.2.2. What do you regard as important factors that affect the grounds that you fish? Heavy fishing gear such as beam trawls, scallop dredges and twin otter trawls were named as impor-
tant factors that affect targeted habitats by 21% of the respondents. Other factors mentioned included fishing (effort) (21%), feed (15%), weather (15%) and season (13%). 3.2.3. Do you think fishing gear has altered the grounds that you usually fish? 56% of the respondents thought that fishing gear had altered their grounds (96% response rate).
M. Bergmann et al. / Fisheries Research 66 (2004) 373–379
377
Table 1 Results of three questions posed in questionnaires (n = 39 unless stated otherwise; f = frequency of category checked; % = percentage of frequency) Changes over time
f
%
Changes in your target species
f
%
Cause of change
f
%
Target species Bottom animals and plants Habitat structure Fish health By-catch No changes Other changes Not answered
12 12 3 1 7 5 5 9
31 31 8 3 18 13 13 23
No change Increase Decrease Moved to other areas Replaced by another species Decrease in size (n = 26) Other changes Not answered
2 5 29 5 2 9 1 4
5 13 74 13 5 35 3 10
Climate Pollution Changes in fishing gear Changes in prey abundance Habitat loss Overfishing Other causes Not answered
15 14 11 9 3 22 4 7
38 36 28 23 8 56 10 18
3.2.4. Have you noticed any changes over the time that you have been fishing? A third of the respondents observed changes in their target species such as a decrease in abundance (74%) and size (35%), and only 2% stated that there was no change in their target species (Table 1). 3.2.5. If you noticed a change to the grounds or species that you fish, please indicate what you think may be the cause(s) These changes were attributed to overfishing (56%), climate (38%), pollution (36%), changes in fishing gear (28%) and prey abundance (23%).
4. Discussion 4.1. Fishing ground locations and distribution of mean ranks of fish abundance Although many respondents volunteered for interviews or questionnaires, fewer were willing to plot key fishing grounds on charts. This was largely due to a perception that such information might lead to negative management developments for fishers in a time of political pressure caused by numerous temporal closures (e.g. the Irish Sea ‘cod box’). For example, the information may inform the choice of potential areas for closure or the imposition of further limits on fishing practices (Pederson and Hall-Arber, 1999). Furthermore, many respondents operated in areas outside the Irish Sea or targeted other species, which restricted the number of charts used. The similarity of the fishing grounds outlined for the three different species reflects, to some extent, the fact that several fishers did not dis-
tinguish between which species were mainly targeted in the different areas outlined. In those cases, it was assumed that all their preferred species were targeted in the area outlined although we recognise that it may have been a prime ground for one particular species. At first sight it would appear that areas of the highest fish densities obtained from databases do not always coincide with those given by fishers. For example, fish densities were generally high along the Irish coast line according to the groundfish surveys whereas many fishers highlighted grounds off the Solway Firth. This, however, may partly reflect a local bias in the port of origin of many of the respondents that attended the fishing exhibition in Scotland. Owing to logistic problems, it was more difficult to reach Irish fishers. It should be noted, however, that two Irish fishers also outlined grounds off the Solway Firth. An attempt to interview more Irish fishers at the Fisheries Co-operative Meeting in Newcastle (Northern Ireland) yielded five questionnaires but no charts as most fishers targeted shellfish, or were unwilling to mark their fishing grounds. Closer inspection of Fig. 1A–C shows, however, that the highest mean ranks for haddock and cod coincided with fishing grounds off the Solway Firth and off the northern Wales coast. A greater sample size, involving more fishers from Ireland, would permit a less biased comparison between the fishers’ and groundfish survey data. It is possible that this spatial bias could be circumvented by restricting a spatial analysis of the groundfish survey data to subsets of the data in the vicinity of respondents’ ports only. The fishers’ information has independently corroborated that high density sites as obtained from groundfish surveys are indicators of areas targeted by fishers
378
M. Bergmann et al. / Fisheries Research 66 (2004) 373–379
and therefore of relevance for further research. Several fishers highlighted the same grounds in the northern Irish Sea, off Ireland and off Wales. These areas presumably have features that consistently attract fish in sufficient numbers and quality to be of economic interest. Therefore, we have undertaken further habitat survey in these areas to investigate why these habitats consistently attract fish (Bergmann et al., unpublished data). Some of the discrepancies between the fishers’ charts and the groundfish survey data may be influenced by the lack of sampling stations located between the north of the Isle of Man, SW Scotland and NW England. This is probably due to differences in the gear historically used during the CEFAS groundfish survey, a beam trawl, the use of which would be restricted over some of the rough grounds around the Isle of Man. Recent studies from the NW Atlantic indicate a preference of young cod and haddock for habitats of coarse sediment interspersed with rocks (e.g. Lough et al., 1989; Gotceitas et al., 1995). On the other hand, the groundfish survey may include areas that fishers normally avoid because they would catch too much ‘rubbish’2 that may clog up their nets during the longer commercial tows. Some of the discrepancies between the charts generated by groundfish surveys and fishers, however, adds further support for input from the fishing industry into groundfish surveys (ICES, 2003). Since no ‘filter’ was incorporated in our questionnaires to test if questions were answered truthfully (Maynou and Sardà, 2001) we have to assume that the respondents answered the questions to the best of their knowledge. Our results have to be treated with care, however, as such uncertainties may introduce strong biases in the conclusions reached, which are not measurable. Maurstad (2000) highlighted that the publication of maps and other information given by fishers in a purely scientific context can put scientists into a dilemma in terms of intellectual property rights and confidentiality. Also, the knowledge becomes separated from its sociological context. We decided to publish our results, however, as we feel that the quality of the charts presented here is not sufficiently accurate to pose a threat to any individual respondent’s livelihood. Also, it is likely that the information volunteered is known and exchanged by many fishers. 2
Inert material and by-catch of non-target species.
4.2. Questionnaires A wide range of habitat features were mentioned by respondents. Sand, mud and hard grounds were most frequently named as key ground types for all three fish species, although more respondents (69%) considered ‘hard’ grounds as important for haddock cf. other species. In a similar study in the US, groundfish were targeted across all habitat categories (Pederson and Hall-Arber, 1999). Further habitat survey also showed that areas of consistently high cod and whiting densities contained a wide variety of habitats ranging from mud over sand to hard grounds (Bergmann et al., unpublished data). Three fishers stated independently that ‘wigs’ (probably brittlestars) are an important habitat feature for haddock. Although fishers suggested that haddock sought out brittlestar beds to ‘clean themselves’ after spawning it is known that haddock feed on brittlestars, which act as a grinding agent in their stomachs (Mattson, 1992). This emphasizes the potential value of apparently obscure observations made by fishers even though their conclusions may be inaccurate. Several respondents noted that weed (possibly hydroids or the wide-spread bryozoan, Flustra) was often found in their haddock or plaice catches and one fisher also associated whiting with soft corals, A. digitatum. These habitat features may provide fish with shelter from predators or act as foci of prey species (e.g. pandalid shrimps). Such features are subject of further investigation (Bergmann et al., unpublished data). In agreement with Pederson and Hall-Arber (1999) few fishers commented on habitat characteristics other than ground types (see above), and such features were given in interviews rather than in mail shot questionnaires. Fishers are often unaware of species’ names, especially those of non-target invertebrates and seem unwilling to offer their own interpretation that may be proven incorrect (Mackinson, 2001). It was easier to steer and expand questions during interviews through explanations and by showing images of fauna that fishers would recognise. More than 50% of the respondents believed that fishing gear has altered their grounds. Particular concern was expressed about heavy gears such as scallop dredges, beam trawls and twin otter trawls. Similarly, Collie et al. (2000) showed that scallop – together with intertidal dredging has the greatest initial impact on
M. Bergmann et al. / Fisheries Research 66 (2004) 373–379
biota. However, most fishers attributed habitat changes to gear types that were not used by themselves. Our consultation with fishers has not only added to the credibility of our own study but has also highlighted how our current knowledge can be expanded. Further insights may be gained by an analysis of statements made in questionnaires which are then integrated with biological data using fuzzy logic (Mackinson, 2001). The integration of fishers’ knowledge into science and management is a potentially invaluable tool that should not be overlooked (Pederson and Hall-Arber, 1999). Acknowledgements The authors thank all the fishers who participated in this study and two anonymous referees who helped to improve an earlier draft of this paper. The project was funded by DEFRA contract MF0805. References Baelde, P., 2001. Fishers’ description of changes in fishing gear and fishing practices in the Australian South East Trawl Fishery. Mar. Freshwater Res. 52, 411–417. Benaka, L., 1999. Fish Habitat: Essential Fish Habitat and Rehabilitation. American Fisheries Society, Bethesda, MD. Collie, J.S., Hall, S.J., Kaiser, M.J., Poiner, I.R., 2000. A quantitative analysis of fishing impacts on shelf-sea benthos. J. Anim. Ecol. 69, 785–798. DEFRA, 2000. United Kingdom sea fisheries statistics 1999 and 2000. The Stationery Office, London. Ellis, J.R., Armstrong, M.J., Rogers, S.I., Service, M., 2002. The distribution, structure and diversity of fish assemblages in the Irish Sea. In: Nunn, J.D. (Ed.), Marine Biodiversity in Ireland and Adjacent Waters. Ulster Museum, Belfast, pp. 93–107.
379
Freire, J., Garc´ıa-Allut, A., 1999. Integration of fishers’ ecological knowledge in fisheries biology and management. A proposal for the case of the artisanal coastal fisheries of Galicia (NW Spain). ICES CM 1999/S:7. Gotceitas, V., Fraser, S., Brown, J.A., 1995. Habitat use by juvenile Atlantic cod (Gadus morhua) in the presence of an actively foraging and non-foraging predator. Mar. Biol. 123, 421–430. Hinz, H., Kaiser, M.J., Bergmann, M., Rogers, S.I., Armstrong, M., 2003. Using habitat selection theory to identify possible ‘Essential fish habitats’. J. Fish Biol. (in press). ICES, 2003. Report of the ICES/NSCFP study group on the incorporation of additional information from the fishing industry into fish stock assessments. ICES Council Meeting Papers. ICES CM 2003/ACFM:14 Ref. D, pp. 1–27. Lough, R.G., Page, C.V., Potter, D.C., Auditore, P.J., Bolz, G.R., Neilson, J.D., Perry, R.I., 1989. Ecology and distribution of juvenile cod and haddock in relation to sediment type and bottom currents on eastern George’s Bank. Mar. Ecol. Prog. Ser. 56, 1–12. Mackinson, S., 2001. Integrating local and scientific knowledge: an example in fisheries science. Environ. Manage. 27, 533–545. Mattson, S., 1992. Food and feeding habits of fish species over a soft sublittoral bottom in the northeast Atlantic. 3. Haddock (Melanogrammus aeglefinus (L.)) (Gadidae). Sarsia 77, 33–45. Maurstad, A., 2000. Trapped in biology. In: Neis, B., Felt, L. (Eds.), Finding Our Sea Legs—Linking Fishery People and their Knowledge with Science and Management. ISER Books, St. John’s, New Foundland, pp. 135–152. Maynou, F., Sardà, F., 2001. Influence of environmental factors on commercial trawl catches of Nephrops norvegicus (L.). ICES J. Mar. Sci. 58, 1318–1325. Moore, P.G., 2003. Seals and fisheries in the Clyde Sea area (Scotland): traditional knowledge informs science. Fish. Res. 63, 51–61. Pederson, J., Hall-Arber, M., 1999. Fish habitat: a focus on New England fishermen’s perspectives. In: Benaka, L.R. (Ed.), Fish Habitat: Essential Fish Habitat and Rehabilitation. American Fisheries Society, Bethesda, MD, pp. 188–211. Taylor, R., 1998. Another approach to scallop production, habitat concerns and biodiversity. In: Dorsey, E.M., Pederson, J. (Eds.), Effect of Fishing Gear on the Sea Floor of New England. Conservation Law Foundation, Boston, pp. 111–114.