Herald Sun Jan 13, 2013. Available online at: http://www.heraldsun.com.au/news/breaking-news/insurers-blame-councils-for- flood-damage/story-e6frf7kf- ...
J. Abbot & J. Marohasy, Int. J. Sus. Dev. Plann. Vol. 10, No. 1 (2015) 29–41
USING LAGGED AND FORECAST CLIMATE INDICES WITH ARTIFICIAL INTELLIGENCE TO PREDICT MONTHLY RAINFALL IN THE BRISBANE CATCHMENT, QUEENSLAND, AUSTRALIA J. ABBOT & J. MAROHASY School of Medical & Applied Sciences, Central Queensland University, Noosa, Queensland, Australia.
ABSTRACT Brisbane, the capital of Queensland, Australia, has flooded periodically and catastrophically, most recently in January 2011. Official seasonal rainfall forecasts failed to predict the floods. Since winter 2013, the Australian Bureau of Meteorology uses a general circulation model, the Predictive Ocean Atmosphere Model for Australia (POAMA), to make official seasonal rainfall forecasts presented as the conditional probability of rainfall being greater or less than the long-term median rainfall. We show that a more skilful forecast can be made using an artificial neural network (ANN), a form of statistical modelling based on artificial intelligence. A Jordan recurrent neural network with one hidden layer was implemented, using genetic optimization of inputs. For the sites of Gatton and Harrisville, in the Brisbane catchment, monthly rainfall forecasts from the ANN show lower root mean square errors than forecasts from POAMA. These rainfall forecasts from the ANN model were further improved by using inputs of independently forecast values for climate indices including the Southern Oscillation Index, the Interdecadal Pacific Oscillation, Pacific sea surface temperature anomalies (Niño 3.4) and also atmospheric temperature. The results presented here represent a first attempt at independently forecasting climate indices using an ANN model for the Australian east coast. Keywords: Rainfall, forecast, lagged climate indices, SOI, IPO, Niño 3.4, Brisbane, flood, artificial neural network.
1 INTRODUCTION 1.1 Climate indices and rainfall forecasting Queensland is a large state in the northeast of Australia with highly variable rainfall [1, 2]. Intraseasonal, interannual and decadal variability in Queensland rainfall has been linked to complex physical phenomena remote to the Australian land mass apparent as recurring patterns in sea surface temperature (SST) and air pressure described numerically by climate indices [3, 4]. Particular attention has been focussed on concurrent relationships between rainfall and climate indices associated with the El Niño Southern Oscillation (ENSO) [5], including the Southern Oscillation Index (SOI) [6] and El Niño SST indices [7]. Risbey et al. [4] examined concurrent relationships between seasonal rainfall over Australia with individual ENSO-related drivers (SOI, Niño 3, Niño 3.4, Niño 4, EMI (the ENSO Modokai Index) and also the Indian Ocean Dipole (IOD; measured by the DMI), the Southern Annular Mode, the Madden-Jullian Oscillation and the blocking index. The study concluded that the dominant concurrent driver is ENSO, typically accounting for the largest amount of rainfall variance, generally in the range of 25%–50%, depending on the season and region. Cai et al. [8] examined the relationships between SOI and Queensland annual rainfall over the period 1889–1998 on a decadal basis and showed that the magnitude of linear correlation coefficients between SOI and annual rainfall are highly variable both temporally and geographically. There is some evidence that the relationship
© 2015 WIT Press, www.witpress.com ISSN: 1743-7601 (paper format), ISSN: 1743-761X (online), http://www.witpress.com/journals DOI: 10.2495/SDP-V10-N1-29-41
30
J. Abbot & J. Marohasy, Int. J. Sus. Dev. Plann. Vol. 10, No. 1 (2015)
between ENSO-related drivers of rainfall is modulated by phases of another index, the Interdecadal Pacific Oscillation (IPO) [9]. These types of concurrent relationships between rainfall and climate indices may help to explain the cause of rainfall within a particular period for a particular region, but they can only be used for rainfall forecasting if there is an independent means of forecasting the climate index. In other words, when using statistical models, it is only relationships between future rainfall and lagged values of climate indices, or rainfall and future predicted values of climate indices that can practically serve as valid model input. This was explained in a conference paper [10] that was the catalyst for the development of the method for independently forecasting climate indices used in this study. There have been many studies of relationships between rainfall and lagged values of climate indices [11, 12]. Chiew et al. [12] examined linear correlations between rainfall and ENSO indices (SOI and SSTs) for the Queensland region. The strongest correlations, above 0.4, were found for spring rainfall over parts of the Queensland region, particularly in the northeast. The geographical coverage and intensity of the strongest correlations declined as lags were progressively introduced from 0, 1, 2 and 3 months. Specific correlations with summer rainfall were less expansive geographically, and these also diminished with lag time. Schepen et al. [3] calculated the influence of 13 individual lagged climate indices on seasonal rainfall for geographical grid areas across Australia. The indices included SOI, Niño 3, Niño 3.4, Niño 4, DMI, EMI (ENSO Modoki Index) and EPI (Indian Ocean East Pole index) at lag periods of 1, 2 and 3 months. For each grid location within Australia and for each season, they identified the lagged climate index with the strongest influence. The results showed that for each location, the identity of the most influential climate index is very variable, within and between locations, as well as the magnitude of the associated lag duration, and the strength of the influence. As stronger associations are found between rainfall and concurrent climate indices than between rainfall and lagged values [12], this suggests that a better rainfall forecast could be achieved by first forecasting the indices, and then using those values as input for rainfall forecast. This was the approach taken by Clarke et al. [11] who used forecasts of Niño 3.4 to produce seasonal rainfall forecasts for Australia’s northeast coast. Artificial neural networks (ANNs) can be used to forecasts climate indices [13, 14], with correlation coefficients above 0.8 for monthly values of SOI and SSTs with lead time of 1 month [14]. 1.2 Limitations of current methods for forecasting medium-term rainfall There were major floods in Brisbane, the capital of Queensland, in 1841, 1893 and 1974. The Wivenhoe dam was built for flood mitigation and completed in 1985, but this dam did not prevent catastrophic flooding again in January 2011. The dam contributed to the flooding, because at the height of the crisis, when the structural integrity of the dam wall was challenged, a large volume of water was intentionally and abruptly released [15]. Insurance claims following the flood totalled approximately A$2.4 billion [16] and there is a pending class action lawsuit, potentially the largest ever in Australia, with claims for damages estimated to exceed A$1 billion [17]. Official seasonal rainfall forecasts for the Brisbane catchment have historically been issued based on output from a relatively simple statistical model using climate indices, in particular, patterns in SSTs. In winter 2013, the Australian Bureau of Meteorology, BOM, transferred to a system based on the Predictive Ocean Atmosphere Model for Australia, POAMA. POAMA is a general circulation model that has been producing forecasts since 2001. However, despite substantial research efforts and technological advances, there is no evidence to suggest that POAMA or other general circulation
J. Abbot & J. Marohasy, Int. J. Sus. Dev. Plann. Vol. 10, No. 1 (2015)�
31
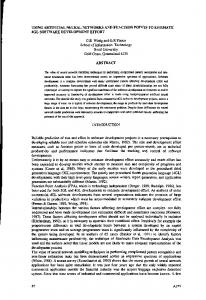
Figure 1: Seasonal rainfall forecast by the BOM issued in November 2010.
models can produce a more skilful medium-term rainfall forecast than the simple statistical models historically used to predict seasonal rainfall using climate indices [3]. Both the official statistical models used until winter 2013 and POAMA provide the seasonal forecast as a conditional probability of rainfall being greater than, or less than, a seasonal median for the 3-month period of the designated season. This information, even if it is accurate, does not provide enough detail to warn of an impending flood. For example, the statistical forecast issued in November 2010 by the BOM for summer (December 2010, January 2011 and February 2011) was in the form of a seasonal forecast map, Fig. 1, indicating a 75% probability of above median rainfall for the Brisbane River catchment. This forecast was consistent with the total precipitation observed over the 3-month period. The flooding, however, resulted from falls of high intensity over a period of much shorter duration. 1.3 Forecasting rainfall using artificial neural networks ANNs are a sophisticated form of statistical modelling based on advances in artificial intelligence. The ANN model used in this study essentially mines historical data, including rainfall, atmospheric temperatures and climate indices, for patterns to produce a desired output that is a quantitative (rather than probabilistic) rainfall forecast for a specific future time period. ANNs have been used to forecast rainfall in many parts of the world [18–22], but rarely used in Australia [23, 24] and never to generate official seasonal rainfall forecasts. Abbot and Marohasy [24] compared the skill of monthly rainfall forecasts from POAMA with forecasts from a prototype ANN model (without genetic optimization) for geographically distinct sites in Queensland using popular climate indices, rainfall and temperature as inputs. They found that for 16 of the 17 sites studied, the ANN model gave a lower root mean square error (RMSE), indicative of a more skilful monthly rainfall forecast.
32
J. Abbot & J. Marohasy, Int. J. Sus. Dev. Plann. Vol. 10, No. 1 (2015)
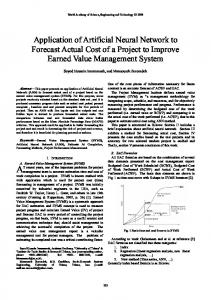
Figure 2: Diagram of Jordan neural network, showing input, hidden, context and output layers. Many neural network applications incorporate multilayer perceptrons (MLPs) as fundamental processing elements (PEs) trained with a standard backpropagation algorithm. These neural networks can perform well in solving static problems but are limited in solving temporal problems, ones where the previous value of the input affects the current output. Recurrent networks, such as Jordan networks, extend the basic MLP architecture by also including context units, PEs that remember past activity. In the Jordan network, the output of the network is copied to the context unit, as illustrated in Fig. 2. The output of the Jordan neural network is copied to the context units. In addition, the context units are locally recurrent, that is, they feedback onto themselves. The local recurrence decreases the values by a multiplicative time constant (τ) as they are fed back. This constant determines the memory depth, that is, how long a given value fed to the context unit will be ‘remembered’. The context unit acts as a simple lowpass filter, creating an output (y(n)), calculated as a weighted average value of some of its more recent past inputs. In the case of the Jordan context unit, the output is obtained by summing the past values multiplied by the scalar tn, where
y(n) = ∑x(n) tn�(1)
Genetic optimization provides an efficient way of selecting those inputs that are significant in determining target rainfall and eliminating those inputs with very low information content. Essentially, genetic optimization enables elimination of inputs that carry mainly noise rather than useful signal, so that the number of input considered in the optimized model might typically be reduced from over 40 to less than 10. In this study, forecasts were made for three sites within the Brisbane catchments using the Jordan network with optimization. The initial forecasts were made using only lagged input parameters to i. Benchmark output from the ANN against POAMA. ii. Evaluate the impact of 1-, 2- and 3-month lags, and accordingly the extent to which a forecast potentially loses skill moving from forecasting 1, 2 and 3 months in advance. iii. �Determine the capacity of the ANN to deal with unary, binary and ternary data sets, that is, with an increasing number of input variables. iv. Determine if the ANN model could forecast the extreme rainfall of December 2010 and January 2011 for these sites. v. A ‘best forecast’ using only lagged values was constructed to explore the potential to improve forecasts through post-processing.
J. Abbot & J. Marohasy, Int. J. Sus. Dev. Plann. Vol. 10, No. 1 (2015)�
33
From the reference point of a current period, it would be impossible when making an operational rainfall forecast to input actual future values of variables such as climate indices. However, it is valid to input future values of climate indices into a rainfall forecast model, if there is a mechanism to independently predict those future values. The closer the predicted values of the climate indices to the actual values, measurable at some point in the future, the better the rainfall forecast will theoretically be. It would thus follow that a limit to improved rainfall forecasts by this process can be ascertained by using the actual future values of the climate indices as inputs in the rainfall forecast model, which is a focus of this study. Monthly rainfall forecasts for one of the sites, Harrisville, with 1-month lead time and ternary input data sets were compared in three different scenarios. In the first scenario, the input data sets comprised only current and lagged values of climate indices and atmospheric temperatures. Under the second scenario, input data sets contained, in addition, forecast values of climate indices and atmospheric temperatures. Under the third scenario, the input data sets contained the corresponding actual lead values, rather than the forecast values. 2 DATA AND METHODS 2.1 Data The sites of Harrisville, Gatton and Lowood in the Brisbane catchment area were chosen because they are close to the Wivenhoe dam and have historical rainfall data extending back at least one hundred years. Monthly rainfall data for the sites was obtained from the BOM. Harrisville (station 040094) has an annual average rainfall of 820 mm and is approximately 30 km south-west of Wivenhoe. Gatton (station 040083) has an annual average rainfall of 778 mm and is located approximately 50 km south of Wivenhoe. Lowood (station 040120) has an annual average rainfall of 812 mm and is approximately 10 km south of Wivenhoe. There are no correspondingly long temperature data series for the sites of Harrisville, Gatton or Lowood, or any other locality in southeast Queensland. Composite maximum and minimum temperature records were constructed from January 1887 to present using data from the BOM for three sites in Brisbane: the Brisbane Regional Office (station 40214), Brisbane Aero (station 40223) and Brisbane (station 40913). Four climate indices were used as input variables: i. The SOI gives an indication of the development and intensity of El Niño or La Niña events in the Pacific Ocean, and is calculated using the pressure differences between Tahiti and Darwin. ii. The IOD is a coupled ocean and atmosphere phenomenon in the equatorial Indian Ocean that affects the climate of Australia and other countries that surround the Indian Ocean basin. The IOD is commonly measured by the Dipole Mode Index (DMI) as the difference between SST anomalies in the western (50°E to 70°E and 10°S to 10°N) and eastern (90°E to 110°E and 10°S to 0°S) equatorial Indian Ocean. iii. Niño 3.4 is a measure of the SST anomaly, which is the departure of a given SST from the longterm average temperature. For data sampling of SSTs, the tropical Pacific has been divided into a number of regions including Niño 3 defined by 90°W–150°W and 5°N–5°S, and Niño 4 defined by 150°W–160°E and 5°N–5°S, Niño 3.4 by 120°W–170°W and 5°N–5°S. Niño 3.4 encompasses part of both region 3 and 4. iv. The IPO is a multi-decadal SST pattern shown to modulate ENSO climate teleconnections to Australia.
34
J. Abbot & J. Marohasy, Int. J. Sus. Dev. Plann. Vol. 10, No. 1 (2015)
Values for SOI, DMI and Niño 3.4 were sourced from the Royal Netherlands Meteorological Institute Climate Explorer – a web application that is part of the World Meteorological Organisation and European Climate Assessment and Dataset project. Values for IPO were provided by Chris Folland from the UK Met Office. Monthly rainfall was forecast using the neural network software NeuroSolutions 6 for Excel (NeuroDimensions, Florida, USA) with an Elman neural network [24]. For each input data set, the ANN was optimized for 3000 epochs using a genetic optimization algorithm for 10 generations. Training sets comprised approximately 85% of the total data available for each location, with the remaining approximately 15% used for testing. To compare the skill of the forecast between sites with differing annual rainfall totals, RMSE values were normalized, by dividing the RMSE by the corresponding monthly average rainfall to give a weighted non-dimensional index [24]. 2.2 Rainfall forecasts using only lagged input parameters Forecasts were initially made for Harrisville, Gatton and Lowood using the ANN model and lagged input parameters for 1, 2 and 3 months, corresponding to totals of 7, 21 and 35 different combinations of unary, binary and ternary sets, respectively. These forecasts were made for the period July 1997 until December 2010 and were thus restricted to only the first month of the very wet summer. This was because data were initially only available for that period and, in particular, because output from POAMA was only made available until December 2010 by the BOM as a benchmark for this study. A unary data set is defined as the current monthly value of one of these input parameters, plus the 12 corresponding lagged values for the previous 12 months, comprising a total of 13 input columns to the neural network. A binary data set was defined as a combination of two unary data sets. For example, the combination of 26 input data columns for SOI and MaxT (SOI/MaxT) comprises a binary set. Similarly, ternary combinations of the unary sets consist of 39 input data columns, as, for example, the combination of SOI, MaxT and Rain (SOI/MaxT/Rain). When more data became available, ANN forecasts for one of these sites, Lowood, were made using a 1-month lagged and ternary combinations for the period May 1992 to December 2011. A ‘best forecast’ for this period was constructed after the post-processing of output data. 2.3 Rainfall forecasts using both lagged and lead input parameters There are essentially five different possible types of input variables for an ANN model: i. Concurrent values are all values in the same time period. ii. Current values have a lead or lag of zero. iii. Actual values are measured values. iv. Lagged values are any value of a variable measured in the past. v. Lead, also known as forecast values, are un-measurable from the reference point of the current period, but potentially predictable in a forecast model. The literature (see Section 1.1) indicates that the relationships between concurrent climate indices and rainfall are generally stronger than the relationship between lagged climate indices and rainfall. We, thus, independently forecast individual climate lead values of indices, so that these values could then also be incorporated into a rainfall forecast. In particular, we use actual values as the third category of our monthly forecasts to determine the degree to which a forecast could ultimately be improved by using accurately forecast values as input
J. Abbot & J. Marohasy, Int. J. Sus. Dev. Plann. Vol. 10, No. 1 (2015)�
35
Table 1: �Forecast of climate indices and atmospheric temperatures with 1-month lead. Forecasted parameter SOI IPO DMI Niño 3.4 MaxT (Harrisville) MinT (Harrisville)
Inputs
Correlation coefficient
SOI/MaxT/MinT IPO/MaxT/MinT DMI/MaxT/MinT Niño/MaxT/MinT MaxT/MinT MinT/MinT
0.66 0.95 0.78 0.96 0.95 0.97
Figure 3: Monthly SOI forecast with 1-month lead-time from January 1985 to October 2010. variables. Thus, in this study we used an ANN model with genetic optimization to forecast monthly rainfall for the three sites within the Brisbane River catchment using: i. Lagged values. ii. Lagged values and also forecast lead values. iii. Lagged values as well as actual lead values, measured at a future point in time. 2.4 Forecasting climate indices and atmospheric temperatures Maximum and minimum temperatures and three climate indices, SOI, IPO and Niño 3.4, were independently forecast using an ANN with 1-month lead time, so that these values could then also be incorporated into monthly rainfall forecast (Table 1). The forecast atmospheric temperature values from the ANN are highly correlated with observed values (Table 1). Niño 3.4 and IPO are the most accurate forecast indices, and SOI is the least accurate (Table 1). The SOI and minimum temperature forecasts are also shown as time series charts (Figs 3 and 4). 3 RESULTS AND DISCUSSION 3.1 Benchmarking the ANN model forecasts for the Brisbane catchment POAMA is considered by the BOM to be a state-of-the-art, inter-seasonal to seasonal, forecast system based on a coupled ocean/atmosphere model and ocean/atmosphere/land observation assimilation systems. Version, POAMA-1.5, replaced POAMA-1 as the Bureau’s operational dynamical seasonal
36
J. Abbot & J. Marohasy, Int. J. Sus. Dev. Plann. Vol. 10, No. 1 (2015)
Figure 4: � Monthly minimum temperature forecast with 1-month lead-time from July 1997 to December 2010. Table 2: �Comparing the skill of the rainfall forecasts (mm) using RMSE and WNDI. Best artificial neural network Lead 1 month 2 months 3 months
Inputs sets MinT/SOI/ Niño MinT/IPO Niño/MaxT
RMSE
WNDI
POAMA RMSE
WNDI
Harrisville 44.9 0.66
74.9
1.10
45.7 46.4
0.67 0.68
69.1 64.7
1.01 0.95
0.76 0.89 0.87
74.9 70.2 64.4
1.16 1.08 0.99
Gatton 1 month 2 months 3 months
Rain IPO/MinT IPO/Rain
48.9 57.6 56.3
prediction system in September 2007 and was used until 2011 when it was superseded by a newer version, POAMA-2. In December 2011, we were provided with output from version POAMA-1.5 corresponding to the sites of Harrisville and Gatton, to facilitate comparisons with rainfall forecasts using ANNs. The values were provided as anomalies and simple bilinear interpolations of surrounding grid points; it was from these values that we calculated the monthly rainfall and then RMSE and WINDI values. We compared RMSE and WINDI values from the POAMA and ANN monthly forecasts as a measure of the skill of the monthly forecasts for the 13.5-year period from July 1997 to December 2010 (Table 2). The ANN model produced a more skilful forecast than POAMA for both sites and for each of the lead times (Table 2). When the output for the ANN is compared with the output for POAMA by way of charting (Figs 5 and 6), it is evident that the ANN forecast generally shows less deviance from the observed rainfall values, as would be expected from the lower RMSE values (Table 2). Both the methods show the annual summer peaks in rainfall for Harrisville, but there is no clear signal in the POAMA forecast for December 2010 of observed extreme rainfall. The POAMA forecast for the 2010/2011 summer peaks too early reaching a maximum in November 2010, before the extreme rainfall was observed.
J. Abbot & J. Marohasy, Int. J. Sus. Dev. Plann. Vol. 10, No. 1 (2015)�
37
Figure 5: �ANN monthly rainfall forecasts for Harrisville with 1-month lead-time from July 1997 to December 2010.
Figure 6: �POAMA monthly rainfall forecasts for Harrisville with 1-month lead-time from July 1997 to December 2010. The output from POAMA is generally consistent with what is known of rainfall forecasts from general circulation models for the Australian east coast. For example, Vaze et al. [25] concluded that all 15 general circulation models investigated in that study failed to reproduce the observed historical annual and seasonal mean rainfalls, across southeast Australia. 3.2 Optimizing the ANN forecast Our objective was the best possible monthly rainfall forecast for localities within the Brisbane catchment and we expected the skill of the forecast to deteriorate as the lead-time increased from 1 to 3 months. Somewhat surprisingly, the forecasts for both POAMA and the ANN do not show a clear deterioration in the skill moving from 1- to 3-month lead-times (Table 2). This would suggest that a monthly rainfall forecast 3 months out can be as skilful as a forecast made just 1 month in advance. There was also no unique, input combination that consistently provided a best forecast. This result is consistent with the study by Schepen et al. [3] where 13 oceanic and atmospheric climate indices lagged at periods of 1, 2 and 3 months were evaluated as predictors of Australian seasonal rainfall. The overall picture that emerged, when considered spatially and temporally, is a complex mosaic, or patchwork, for the assignment of dominant lagged indicators of rainfall.
38
J. Abbot & J. Marohasy, Int. J. Sus. Dev. Plann. Vol. 10, No. 1 (2015)
Figure 7: �Artificial neural network monthly rainfall forecast for Lowood with post-processing from August 1992 to December 2011. Climate indices, atmospheric temperatures and rainfall, were all important components of the optimal data input sets. RMSE values for the site of Harrisville, considering a 1-month lead forecast, ranged from a high of 59.9 mm for the ternary set (Rain/IPO/Niño) to a low of 44.9 mm for the ternary input set (SOI/Niño/MinT). Values for Gatton ranged from a high of 60.7 mm for the ternary set (Rain/MinT/MaxT) to a low of 48.9 mm for the unary input set (Rain). The output for Lowood ranged from a high of 71.3 mm for the ternary set (SOI/Niño/MinT) to a low of 56.7 mm for the input set (Rain/SOI). A more limited number of ANN forecasts were made for the period August 1992 to December 2011 for the site of Lowood. The more skilful forecasts predicted the flooding in December 2010 and January 2011 and could be further improved through post-processing (Fig. 7). The concept of combining outputs from different forecast models to achieve an optimal result has been widely discussed, particularly in the context of general circulation models [26, 27]. For example, Kodra et al. [28] evaluated the predictive skill of results from an ensemble of seven different general circulation models, and their combinations, for forecasting Indian monsoon rainfall and temperatures. By combining two primary ANN output time-series forecasts, both generated with ternary input data sets. The first model used the ternary input set (Rain/IPO/Niño) to give an RMSE of 61.2 mm. The second used the ternary input set (Rain/MaxT/IPO) to give output with an RMSE of 61.3 mm. The first model provided a more skilful differentiation of the high rainfall period during the summer of 2010/2011. The second gave a better representation of rainfall during dryer periods. The combined output had an RMSE value of 57.2 mm. The extreme rainfall is represented in the forecast by a prominent forecast peak of 454.4 mm in December 2010. The actual peak was 642.6 mm (Fig. 7). This signal is clearly distinguishable from the prolonged period of drought in the prior 10 years when the maximum rainfall in any month never exceeded 220 mm (Fig. 7). 3.3 ANN forecasts using lead input parameters For a given ternary input data set, there is a reduction in RMSE when the current value is used in conjunction with a forecast lead, but as might be expected, the improvement is most pronounced where the actual lead values of climate indices and atmospheric temperature are used as inputs. This is illustrated for a subset of results for Harrisville using ternary input sets in Table 3. As discussed in
39
J. Abbot & J. Marohasy, Int. J. Sus. Dev. Plann. Vol. 10, No. 1 (2015)�
Table 3: �Forecast skill compared for three input scenarios for monthly rainfall for Harrisville: (i) current plus lagged; (ii) current plus lagged plus forecast lead values and (iii) current plus lagged plus actual lead values. Current plus lagged values
Current plus lagged plus Current plus lagged plus forecast lead values actual lead values
Inputs
RMSE
RMSE
RMSE
Rain/MaxT/SOI Rain/MaxT/Niño
48.7 49.6
46.6 46.9
42.8 43.1
Rain/SOI/IPO
50.1
50.4
45.9
Rain/IPO/Niño
59.9
47.7
46.0
Rain/MaxT/DMI
48.2
46.9
42.3
Rain/MinT/Niño
48.0
45.2
41.3
SOI/MaxT/MinT
47.2
47.1
39.7
SOI/IPO/DMI
54.1
52.9
49.9
Rain/MaxT/IPO
47.6
44.8
43.8
Rain/MinT/MaxT
48.7
48.6
38.5
MinT/MaxT/Niño
47.5
49.0
41.0
Rain/SOI/DMI
49.3
48.6
43.7
MaxT/Niño/IPO
49.4
47.5
44.4
Niño/DMI/MinT
50.4
45.2
38.9
Rain/DMI/IPO
51.0
49.5
46.1
Section 1.1, concurrent values of climate indices have generally been found to have stronger associations with rainfall than lagged values [12], so this result was expected. It confirms that one way of improving monthly rainfall forecasts is by including forecast input parameters, with the skill of the rainfall forecast influenced by the skill of the forecast of those input parameters. The forecast values in this study were provided by an ANN model. General circulation models such as POAMA can also forecast climate indices, and it would be worthwhile to compare their skill at forecast climate indices with the skill of ANN models including for the Brisbane catchment. 4 CONCLUSIONS Seasonal rainfall forecasts are important for Brisbane, a city that has been subject to periodic catastrophic flooding. In this paper, we show a practical method for improved forecasting. In particular, using a Jordan recurrent neural network model, it is possible to generate monthly rainfall forecasts for the Brisbane River catchment that are more skilful than the official forecast using POAMA (Table 2 and Figs 5 and 6). Furthermore, the skill of this forecast can be improved by incorporating forecast lead values as inputs. Such lead values can be independently forecast using an ANN model as demonstrated in this study.
40
J. Abbot & J. Marohasy, Int. J. Sus. Dev. Plann. Vol. 10, No. 1 (2015)
ACKNOWLEDGEMENT This work was funded by the B. Macfie Family Foundation. REFERENCES [1] Lough, J.M., Variations of some seasonal rainfall characteristics in Queensland, Australia: 1921–1987. International Journal of Climatology, 13, pp. 391–409, 1993. doi: http://dx.doi. org/10.1002/joc.3370130404 [2] Klingaman, N.P., Woolnough, S.J. & Syktus, J., On the drivers of inter-annual and decadal rainfall variability in Queensland, Australia. International Journal of Climatology, 3(10), pp. 2413–2430, 2012. doi: http://dx.doi.org/10.1002/joc.3593 [3] Schepen, A., Wang, Q.J. & Robertson, D., Evidence for using lagged climate indices to forecast Australian seasonal rainfall. Journal of Climate, 25, pp. 1230–1246, 2012. doi: http:// dx.doi.org/10.1175/jcli-d-11-00156.1 [4] Risbey, J.S., Pook, M.J., Mcintosh, P.C., Wheeler, M.C. & Hendon, H.H., On the remote drivers of rainfall variability in Australia. Monthly Weather Review, 137, pp. 3233–3253, 2009. doi: http://dx.doi.org/10.1175/2009mwr2861.1 [5] Kirono, D.G.C., Chiew, F.H.S. & Kent, D.M., Identification of best predictors for forecasting seasonal rainfall and runoff in Australia. Hydrological Processes, 24(4), pp. 1237–1247, 2010. doi: http://dx.doi.org/10.1002/hyp.7585 [6] Chowdhury, R.K. & Beecham, S., Australian rainfall trends and their relation to the southern oscillation index. Hydrological Processes, 24, pp. 504–514, 2010. doi: http://dx.doi. org/10.1002/hyp.7504 [7] Murphy, B.F. & Ribbe, J., Variability of Southeastern Queensland rainfall and climate indices. International Journal of Climatology, 24, pp. 703–721, 2004. doi: http://dx.doi.org/10.1002/ joc.1018 [8] Cai, W., Whetton, P.H. & Pittock, A.B., Fluctuations of the relationship between ENSO and northeast Australian rainfall. Climate Dynamics, 17, pp. 421–432, 2001. doi: http://dx.doi. org/10.1007/pl00013738 [9] Power, S.B. & Smith, I.N., Weakening of the Walker Circulation and apparent dominance of El Niño both reach record levels, but has ENSO really changed? Geophysical Research Letters, 34, 2007, DOI:10.1029/2007GL030854. doi: http://dx.doi.org/10.1029/2007gl030854 [10] Abbot, J. & Marohasy, J., The application of artificial intelligence for monthly rainfall forecasting in the Brisbane Catchment, Queensland, Australia. WIT Transactions on Ecology and The Environment, Vol. 172, © 2013, WIT Press: Southampton, www.witpress.com, ISSN 1743-3541 (on-line) DOI:10.2495/RBM130111. [11] Clarke, A.J., Van Gorder, S. & Everingham, Y., Forecasting long-lead rainfall probability with application to Australia’s northeastern coast. Journal of Applied Meteorology and Climatology, 49(7), pp. 1443–1453, 2010. doi: http://dx.doi.org/10.1175/2010jamc2373.1 [12] Chiew, F.H.S., Piechota, T.C., Dracup J.A. & McMahon, T.A., El Niño/southern oscillation and Australian Rain, streamflow and drought: links and potential for forecasting. Journal of Hydrology, 204, pp. 138–149, 1998. doi: http://dx.doi.org/10.1016/s0022-1694(97)00121-2 [13] Perez-Chavarriia, M.A., Hidalgo-Silva, H.H. & Ocampo-Torres, F.J., Time series prediction using artificial neural networks. Ciencias Marinas, 28(1), pp. 67–77, 2002. [14] Baawain, M.S., Nour, M.H., El-Din, A.G. & El-Din, M.G., El Nino southern-oscillation prediction using southern oscillation index and Nino3 as onset indicators: application of artificial neural networks. Journal of Environmental Engineering and Science, 4(2), pp. 113–121, 2005. doi: http://dx.doi.org/10.1139/s04-047
J. Abbot & J. Marohasy, Int. J. Sus. Dev. Plann. Vol. 10, No. 1 (2015)�
41
[15] van den Honert, R.C. & McAneney, J., The 2011 Brisbane Floods: causes, impacts and implications. Water, 3, pp. 1149–1173, 2011. doi: http://dx.doi.org/10.3390/w3041149 [16] Cratchley, D., Insurers prepared for mounting flood costs. Herald Sun Jan 13, 2013. Available online at: http://www.heraldsun.com.au/news/breaking-news/insurers-blame-councils-forflood-damage/story-e6frf7kf-1226564743427 [17] Johnson, S., Queensland floods class action could set record. Yahoo 7 News January 20, 2013. Available online at: http://au.news.yahoo.com/latest/a//latest/15887827/qld-floods-class-actioncould-set-record/ [18] Dahamsheha, A. & Aksoyb, H., Artificial neural network models for forecasting intermittent monthly precipitation in arid regions. Meteorological Application, 16, pp. 325–337, 2009. doi: http://dx.doi.org/10.1002/met.127 [19] Shukla, R.P., Tripathi, K.C., Pandey, A.C. & Das, I.M.L., Prediction of Indian summer monsoon rainfall using Niño indices: a neural network approach. Atmospheric Research, 102, pp. 99–109, 2011. doi: http://dx.doi.org/10.1016/j.atmosres.2011.06.013 [20] Wu, X., Cao, H., Flitman, A., Wei, F. & Feng, G., Forecasting monsoon precipitation using artificial neural networks. Advances in Atmospheric Sciences, 18, pp. 950–958, 2001. [21] Philip, N.S. & Joseph, K.B., 2A neural network tool for analysing trends in rainfall. Computers & Geosciences, 29, pp. 215–223, 2003. doi: http://dx.doi.org/10.1016/s0098-3004(02)00117-6 [22] Chakraverty, S. & Gupta, P., Comparison of neural network configurations in the long-range forecast of southwest monsoon rainfall over India. Neural Computing & Applications, 17, pp. 187–192, 2008. doi: http://dx.doi.org/10.1007/s00521-007-0093-y [23] Mekanik, F. & Imteaz, M.A., Forecasting Victorian spring rainfall using ENSO and IOD: a comparison of linear multiple regression and nonlinear ANN International Conference on Uncertainty Reasoning and Knowledge Engineering. Proc. of the 2nd Int. Conf. on Uncertainty Reasoning and Knowledge Engineering (URKE 2012), Jakarta, Indonesia, pp. 86–89, 2012. doi: http://dx.doi.org/10.1109/urke.2012.6319591 [24] Abbot, J. & Marohasy, J., Application of artificial neural networks to rainfall forecasting in Queensland, Australia. Advances in Atmospheric Sciences, 29(4), pp. 717–730, 2012. doi: http://dx.doi.org/10.1007/s00376-012-1259-9 [25] Vaze, J., Teng, J. & Chiew, F.H.S., Assessment of GCM simulations of annual and seasonal rainfall and daily rainfall distribution across south-east Australia. Hydrological Processes, 25, pp. 1486–1497, 2011. doi: http://dx.doi.org/10.1002/hyp.7916 [26] Raisanen, J., Ruokolainen, L. & Ylhaisi, J., Weighting of model results for improving best estimates of climate change. Climate Dynamics, 35, pp. 407–422, 2010. doi: http://dx.doi. org/10.1007/s00382-009-0659-8 [27] Pennell, C. & Reichler, T., On the effective number of climate models. Journal of Climate, 24, pp. 2358–2367, 2011. doi: http://dx.doi.org/10.1175/2010jcli3814.1 [28] Kodra, E., Ghosh, S. & Ganguly, A.R., Evaluation of global climate models for Indian monsoon climatology. Environmental Research Letters, 7(1), 014012, 2012. doi: http://dx.doi. org/10.1088/1748-9326/7/1/014012