JGLR-00550; No. of pages: 12; 4C: 3, 6, 11 Journal of Great Lakes Research xxx (2013) xxx–xxx
Contents lists available at SciVerse ScienceDirect
Journal of Great Lakes Research journal homepage: www.elsevier.com/locate/jglr
Using LiDAR to reconstruct the history of a coastal environment influenced by legacy mining Foad Yousef a, W. Charles Kerfoot a,⁎, Colin N. Brooks b, Robert Shuchman b, c, Bruce Sabol d, Mark Graves d a
Lake Superior Ecosystems Research Center and Department of Biological Sciences, Michigan Technological University, Houghton, MI 49931, USA Michigan Tech Research Institute, Michigan Technological University, Ann Arbor, MI, 48105, USA Department of Geological and Mining Engineering and Sciences, Michigan Technological University, Houghton, MI 49931, USA d U.S. Army Engineer Research and Development Center (ERDC-Environmental Laboratory), Vicksburg, MS 39180, USA b c
a r t i c l e
i n f o
Article history: Received 20 December 2011 Accepted 21 December 2012 Available online xxxx Communicated by George Leshkevich Keywords: Remote sensing LiDAR Coastal erosion Tailings pile Nipissing dunes Lake Superior
a b s t r a c t LiDAR (light detection and ranging) data can be used to create fine digital elevation and bathymetric models (DEMs). Here we examine natural coastal erosion in Grand Traverse Bay, Michigan, a part of Keweenaw Bay in Lake Superior, and discuss how a variety of geological features (submersed river bed and channels associated with the Houghton Low; Nipissing dunes) interact with long-term sediment accumulation patterns. The geological features also modify migrating tailings from a legacy mining site. The combination of LiDAR derived images and aerial photographs allowed us to reconstruct the historical movement of tailings along the coastline. A total of 22.8 million metric tonnes (Mt) of stamp sand were discharged into the coastal environment off Gay, MI. Over a span of 80 years, beaches to the southwest of Gay have progressively received 7.0 Mt (30.7%) of the mass eroded from the original pile, whereas 11.1 Mt (48.7%) have moved into the bay. The total amount accumulated along the beaches now greatly exceeds the mass remaining on the original tailings pile (3.7 Mt; 16.2%). Bathymetric differences between two LiDAR surveys (2008 and 2010) were also used to estimate the mass, and to track the movement of migrating underwater stamp sand bars. These bars are moving southwesterly towards Buffalo Reef, creating a threat to the lake trout and lake whitefish breeding ground. © 2013 Published by Elsevier B.V. on behalf of International Association for Great Lakes Research
Introduction Airborne LiDAR bathymetry (ALB) or airborne light detection and ranging (LiDAR) is a remote sensing technique for measuring water depths with an airborne scanning pulsed laser beam (Guenther, 1985). The technique is well suited to nearshore mapping in clear water because it provides the three-dimensional data needed to create a digital terrain model with a ±10–50 centimeter (cm) vertical accuracy for topographic and bathymetric mapping (Irish et al., 2000). Compared with passive remote sensing systems (e.g. aerial photos, Landsat), which are quite limited with respect to the depth to which they can measure, active LiDAR technology can penetrate up to three times Secchi depth, i.e. considerably beyond passive light penetration. Modern LiDAR systems reach up to a maximum of 50 meters (m) in very clear, marine water, and between 20 and 35 m in clear coastal waters (Guenther et al., 2000). Commercial topographic LiDAR systems operate at a pulse repetition frequency of at least 20,000 Hz and a footprint diameter of 15–20 cm. A topographic LiDAR operating in the infrared (IR) band can image the water surface, but cannot penetrate it. An ALB system, however, operates at a ⁎ Corresponding author. Tel.: +1 906 487 2791. E-mail addresses:
[email protected] (F. Yousef),
[email protected] (W.C. Kerfoot),
[email protected] (C.N. Brooks),
[email protected] (R. Shuchman),
[email protected] (B. Sabol),
[email protected] (M. Graves).
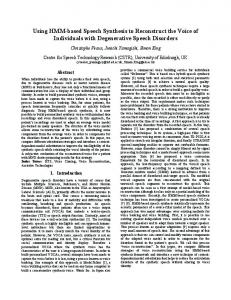
lower pulse-repetition frequency than the topographic LiDAR [up to 3000 hertz (Hz)], with a footprint diameter of 2 m (Table 1). In the CHARTS ALB system used here (Table 1), the LiDAR sensor records the time difference between two signals (an infrared wavelength that reflects off the lake surface, and a green water-penetrating wavelength that returns from the bottom sediments) to derive measurements of water depth. As opposed to SHOALS (Scanning Hydrographic Operational Airborne LiDAR Survey), CHARTS (Compact Hydrographic Airborne Rapid Total Survey), and LADS (Laser Airborne Depth Sounder) sensors, the newer USGS EAARL (Experimental Advanced Airborne Research LiDAR) and CZMIL (Coastal Zone Mapping and Imaging LiDAR) bathymetric LiDARs do not utilize an infrared band. During coastal surveys using CHARTS, the aircraft travels over water at about 60 m per second, pulsing two varying laser beams towards the earth through an opening in the plane's fuselage. The first wavelength (green) is intended for lakebed detection because of its water penetration ability, whereas the second wavelength (infrared) allows sensing of the water surface, which behaves as a near opaque surface at this wavelength (Fig. 1). The LiDAR sensor records the time difference between the two signals to derive measurements of water depth. Today, airborne LiDAR bathymetry and topographic LiDAR are used as standard tools for coastal mapping around the globe. Flood maps, shoreline mapping, monitoring of coastal erosion, and habitat protection are only a few of the applications (Guenther, 2007; Pe'eri and Long, 2011). Marine applications of
0380-1330/$ – see front matter © 2013 Published by Elsevier B.V. on behalf of International Association for Great Lakes Research http://dx.doi.org/10.1016/j.jglr.2013.01.003
Please cite this article as: Yousef, F., et al., Using LiDAR to reconstruct the history of a coastal environment influenced by legacy mining, J Great Lakes Res (2013), http://dx.doi.org/10.1016/j.jglr.2013.01.003
2
F. Yousef et al. / Journal of Great Lakes Research xxx (2013) xxx–xxx
Table 1 Characteristics of typical topographical and bathymetrical LiDAR sensors.
Topographic LiDAR Bathymetric LiDAR 2008 LiDAR Topo/Bathy 2010 LiDAR Topo/Bathy
LiDAR beam frequency (nm)
Pulse repetition (kHz)
Pixel size (m)
Vertical accuracy (m)
Horizontal accuracy (m)
1064 532 1064 (infra-red) 532 (green) 1064 (infra-red) 532 (green)
20 3 9 1 1 1
0.15–0.20 ~2 2
±0.1–0.5
±0.6–5
±0.3
±3
2
±0.3
±3
blue-green laser techniques to mapping underwater structures include: 1) mapping of coral reefs relative to fish assemblages (Walker et al., 2009), 2) coral reef extent and structure (Brock et al., 2004; Wright and Brock, 2002), 3) characterization of Atlantic barrier islands (Nayegandhi et al., 2005), 4) studies of Gulf of Mexico estuaries (Brock et al., 2002; Nayegandhi et al., 2006), 5) quantification of hurricane effects (Zhang et al., 2005), and 6) studies of sea turtle nesting on beaches (Long et al., 2011). Freshwater applications include surveys of erosion patterns along braided streams (Bowen and Waltermire, 2002; Kinzel et al., 2007), Great Lakes coastal erosion (Kerfoot et al., 2012), and evidence for ancient lakes (Mackey et al., 2011). Here we use a combination of aerial photography and LiDAR derived images to uncover historical events that influenced Great Lakes coastal environments and investigate how these historical features interact with recent anthropogenic events (tailings pile erosion). The investigation deals with historic features along Grand Traverse Bay (also locally termed “Big” Traverse Bay), a small coastal portion of Keweenaw Bay, Lake Superior (Fig. 2). Several of the features mark geologic events that are thousands of years old, yet they still influence sedimentation patterns. Other perturbations are much more recent. Severe anthropogenic disturbances to the Keweenaw Peninsula took place within the past 160 years. Between 1850 and 1929, the Keweenaw mining district was the second largest producer of copper in the world, largely from native copper (Benedict, 1952; Murdoch, 1943). Native copper came from two principle kinds of ore in the Portage Lake Volcanic Series: basalt lava flows (amygdule deposits) and inter-bedded sediments
(conglomerates). The ore was crushed with early gravity and later with giant steam-driven stamps to release the native copper and silver (Benedict, 1955; Butler and Burbank, 1929). Over 140 mines worked the central deposits and over 40 mills processed stamp rock (Kerfoot et al., 1994). Smelters produced 4.4 million metric tonnes (Mt) of copper, whereas stamp mills sluiced around 360 Mt of copper-rich stamp tailings into rivers and waterways, including 64 Mt directly onto Lake Superior shorelines and 25 Mt into Keweenaw Bay (Kerfoot et al., 1994, 2009, 2012; Kolak et al., 1999). Along the 8.5 km stretch of Grand Traverse Bay in Keweenaw Bay, two stamp mills at Gay (Mohawk and Wolverine Mills) discharged a total of 22.7 Mt of stamp sand onto a single pile (Fig. 2; Kerfoot et al., 2012). Stamp sands discharged off Gay have dispersed as “black sand” beach deposits between the original tailings pile and the Traverse River (Fig. 2). One of the major concerns in this region is the intrusion of stamp sands around and onto Buffalo Reef, located off the Coal Dock location in mid-bay. Buffalo Reef is an important lake trout and whitefish spawning ground [Great Lakes Indian Fish and Wildlife Commission (GLIFWC), Chiriboga, 2006; Chiriboga and Mattes, 2008]. Impairment of reef habitat could lead to a decline in important fish species, infringement upon federally guaranteed treaty reserved rights, and a health impact on the tribal and the non-tribal population that consumes these resources. Here we use a combination of aerial photography and LiDAR derived images to measure how post-Pleistocene erosion features interact with migrating stamp sands to threaten Buffalo Reef and the natural beach stretches on Grand Traverse Bay. With LiDAR technology, we discovered new post-Pleistocene underwater features that contribute to, and help direct, natural sediment transport. We estimated several historical erosion rates related to stamp sand mass, namely movements and regionspecific erosion/accretion patterns that are superimposed upon natural sedimentation patterns in the bay. Relative to stamp sand dispersion, we wanted to quantify: 1) where and how fast the original tailings pile was eroding, 2) how much stamp sand was being deposited along shoreline stretches (original tailings pile to the Traverse River), and 3) how erosion or accretion dynamics were different in various parts of the coastal region. In terms of technological advances, we also wanted to know if coastal LiDAR data could be used to indirectly or directly estimate the mass of stamp sand that is migrating underwater in the bay. Moreover, where there are underwater masses, are there also indications of recent movement? Underwater movement bears on issues related to toxic effects of stamp sands on benthic organisms (Kraft, 1979; Kraft and Sypniewski, 1981) and encroachment onto Buffalo Reef (Biberhofer and Procopec, 2008; Kerfoot et al., 2012). Are there techniques that provide more direct and precise estimates? In a broader context, to what degree can the complimentary use of aerial photography and LiDAR expand studies of beach erosion relative to mine tailings restoration and remediation efforts? Methods LiDAR image processing
Fig. 1. Data recording during an overflight of the bathymetric LiDAR system. Modified from LaRocque and West (1990).
Studies were carried out along the southern shoreline of Lake Superior, on the Keweenaw Peninsula (Fig. 2). In this investigation, LiDAR was used principally for producing DEMs. During the week of
Please cite this article as: Yousef, F., et al., Using LiDAR to reconstruct the history of a coastal environment influenced by legacy mining, J Great Lakes Res (2013), http://dx.doi.org/10.1016/j.jglr.2013.01.003
F. Yousef et al. / Journal of Great Lakes Research xxx (2013) xxx–xxx
3
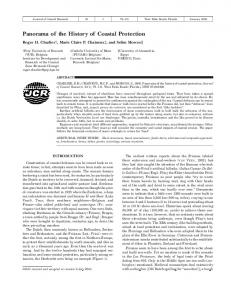
Fig. 2. Inset gives location of the study site relative to Lake Superior, Keweenaw Bay, and the Keweenaw Peninsula. The aerial photo shows the coastline of Grand Traverse Bay in 1998. Labels indicate local features, including the original tailings pile off Gay, the Coal Dock location, and the Traverse River Army Corps Seawall. The white dashed line represents the boundary of coastal stamp sands indicated on the original 1938 aerial image. The numbers represent the 2010 boundaries of the three coastal stamp sand sections: original stamp sand pile (#1), the Coal Dock region (#2), and the Traverse River section (#3). Note the difference between redeposited stamp sands (gray) and natural sands (white) along the beach stretch. Arrow shows the prevailing direction of alongshore currents.
23 June 2008, CHARTS aerial overflights of the Grand Traverse Bay coastline portion of Keweenaw Bay were carried out by the Joint Airborne LiDAR Bathymetry Technical Center of Expertise (JALBTCX). The pulse rates were 1 kilohertz (kHz) at 532 nm and 9 kHz at 1064 nm with a scan of 20° off nadir side to side from an altitude of 400 m. Using the GIS-referenced high-resolution LiDAR DEM data set, we constructed 2 m resolution LiDAR bathymetric maps down to the maximum penetration depth of 22 m. The CHARTS LiDAR had a vertical accuracy of ±30 cm. Simultaneously, the location and the orientation of the laser source were determined by the Global Positioning System (GPS) and Internal Navigation Units (INU), respectively. We used a Trimble (GeoXT) GPS unit to determine the true height of stamp sand bluffs in order to verify the LiDAR derived height estimates. The results were reasonably close (within ±0.4 m). We also used the NOAA (National Oceanic and Atmospheric Administration) 2010 Great Lakes Restoration Initiative (GLRI) bathymetric LiDAR data in our analysis. The data were collected between July and August by the Fugro LADS Mk II system along the Lake Superior coast of Minnesota, Wisconsin and Michigan. The 2008 LiDAR data were received in strip form. Each strip was taken during a single overpass. ENVI 4.7 was used for the entire image processing procedure. The strips were mosaicked and re-projected. The original coordinate system was Geographical Lat/Long, yet for further distance, aerial, and volume calculations the data were re-projected to a Universal Transverse Mercator (UTM; projection = WGS84, zone = 16) coordinate system. The raw mosaicked image needed to be assigned to values of depth, which was done by comparing the LiDAR derived image with a georeferenced aerial photo from 2008. The land–water interface was used as “zero” depth. The 2010 LiDAR data were downloaded from Digital Coast website (Digital Coast NOAA, 2010). The data were collected using the LADS Mk II bathymetric LiDAR survey system that acquires bathymetric/topographic data at 1 kHz. The original coordinated system for the received data was International Great Lakes Datum
85 (IGLD85), which measures the height above mean sea level. In order to distinguish between below water level and above water level, the water level elevation (183.2 m, Fugro LADS Mk II) was subtracted from the entire scene, which in return produced a topo/bathy map of the study site. Finally, the 2010 image was color-coded for 5 meter depth intervals to help identify underwater features more easily. Aerial photograph processing The original boundaries of the Gay, MI, tailings pile were determined from a georegistered 1938 aerial photo of the region. ArcMap 9.3 was used to digitize the tailings boundary (Jensen, 2005). Seven additional mosaicked aerial photos (taken between 1944 and 2008) were used as the baseline to determine stamp sand boundary changes through time (Fig. 3). The polygons were digitized and re-projected to UTM coordinate system for further geometrical measurements. Reconstructing the original pile dimensions and mass, and coastline losses underwater to the bay The Mohawk and Wolverine Mills were located at Gay, MI (Fig. 2). They were operated as twin mills with a single pumping plant and joint superintendent. Stamp rock was hauled from the mines to the stamping mills over a rail distance of 21–27 kilometers (km) (Clarke, 1978; Monette, 1992). Gay operations required construction of a Coal Dock (Fig. 2) and a short connecting rail line. The Coal Dock extended 100 m into Grand Traverse Bay and was 5.7 m deep at its end (Clarke, 1978). Both mills utilized Nordberg Stamps, Harding ball and Chilean mills to crush the amygdule basalt bedrock, releasing copper. By 1932 the two stamp mills sluiced a combined 22.8 Mt of stamp sand tailings onto one enormous pile that covered about 0.9 square kilometers (km2) (Kerfoot et al., 2009, 2012). To calculate the volume and mass of the original stamp sand pile, three estimates were needed: 1) the thickness of the original pile (the
Please cite this article as: Yousef, F., et al., Using LiDAR to reconstruct the history of a coastal environment influenced by legacy mining, J Great Lakes Res (2013), http://dx.doi.org/10.1016/j.jglr.2013.01.003
4
F. Yousef et al. / Journal of Great Lakes Research xxx (2013) xxx–xxx
Fig. 3. Erosion of the Gay tailings pile through time, starting with 1938. The extent of the tailings pile in each aerial photo is labeled with the date of image collection. The region labeled as 2008 represents the remaining pile.
total of below and above water portions), 2) the area of the original stamp sand pile, and 3) the average weight of stamp sand per unit of volume. The input for “area” came from aerial photos, whereas LiDAR provided estimates of “thickness”. A 1938 aerial photo provided details about the original extent of the stamp sand pile. An estimate of below-water mass was still required. To reconstruct the below-water portion of the original pile, the pile was separated into two regions. The two regions were the eroded section and the area under the existing stamp sand pile. The bathymetric LiDAR data were used to estimate the below-water depths of the eroded section (with an assumption of fairly constant water level; 183.3 m; Detroit District Corps). To estimate the depth of the stamp sand in the second region, currently covered by stamp sand, the slope change of bedrock from the LiDAR bathymetric map adjacent to the pile was used and the slope extrapolated under the existing pile. To reconstruct the above-water portion of the original stamp sand pile, we considered the same two regions, i.e., the portion that is currently covered with stamp sand and the eroded portion. The LiDAR DEM provided the height of the stamp sand pile in 2008. The elevation of the eroded portion was estimated via extending the height of known landmarks (remaining sluiceways) determined from the 2008 LiDAR DEM. The underwater volume was added based on estimated depth to bedrock. Landmark reconstruction allowed us to calculate the volume and mass of the pile in 1938. Procedures employed a pixel spatial resolution of 3 m and an area of 9 m2. Multiplying area by height gave an estimate of volume of stamp sand for each pixel. Integration provided an estimate of total volume in cubic meters. Moist bulk density of the Gay stamp sands soil was estimated at between 1.35 to 1.65 grams per cubic centimeter (g cm−3) or 1350 kg m−3 to 1650 kg m−3 [U.S. Department of Agriculture's Natural Resource Conservation Service (NRCS, 2010)]. Based on preliminary measurements, we decided to use the bulk density value of 1650 kg m−3, and calculated the mass for each eroded slice. Plots showed the erosion to be nonlinear, very close to an exponential decay curve. Because the function appeared proportional, values were converted into logarithms. Estimating pile erosion onto offshore vs. onshore (beach) locations It is possible that the Coal Dock (Fig. 2; southwestern extent of Region #2) served unintentionally as a groin during the 1932–1938 erosion of the main pile, accumulating migrating stamp sands. Further to the
south, after construction and lengthening, the Army Corps seawall (Fig. 2; southwestern extent of Region #3) on the Traverse River intentionally served as a barrier for migrating stamp sands, causing beach widening since the 1970s. Until recently (2010–11), the Traverse River Seawall prevented incursion of black sands onto the natural white sands of the lower bay. Now there is over-topping. Because of the migration barriers, we examined erosion/accretion patterns along the different shoreline regions. To estimate the amount of stamp sand lost underwater to Grand Traverse Bay, the mass of stamp sand accumulating along various coastal regions was subtracted from the total tailings discharge. The height of above water portion of the stamp sand was retrieved from the 2008 LiDAR DEM data. Underwater depth estimates along the coast came from a Lake Superior Coast Chart, No. 4 (soundings 1906) and were used to estimate stamp sand thickness below the water level. First, we digitized the 1906 near-shore contours to a series of polygons with different depths and then rasterized these polygons to the same pixel size as in the LiDAR derived images (3 m pixels). The product was a raster image with pixel values that were representing water depth in 1906. Total stamp sand thickness was then calculated by adding the under- and above-water thickness values for each pixel. To calculate the volume, each vertical column was multiplied by the area of the pixel (9 m2). For calculating the “total mass” layer of the entire coastal stamp sand, the volume layer was multiplied by the average weight of the stamp sand (1650 kg m−3; i.e. 1.65 metric tonnes m−3). Coastal stamp sand boundary polygons were divided into three sections (1 = original tailings pile, 2 = Coal Dock section, and 3 = Traverse River section; see Fig. 2). The mass of the stamp sand located inside the section boundary was extracted from the “total mass” raster layer. This process was repeated for every aerial photo polygon to calculate the mass of the stamp sand associated with each of these regions through time and finally these estimates were plotted against time. Onshore versus offshore dynamics To estimate the offshore versus onshore stamp sand deposition, we assumed that stamp sand eroded from the original pile was either deposited southwestward onto the shore along the Coal Dock or Traverse River stretches, or was dispersed out into Grand Traverse Bay. The total amount of stamp sand gain on the Coal Dock or Traverse River stretches (for the period between two aerial photos, Table 2) was subtracted from the mass eroded off the original pile (for the same period of time),
Please cite this article as: Yousef, F., et al., Using LiDAR to reconstruct the history of a coastal environment influenced by legacy mining, J Great Lakes Res (2013), http://dx.doi.org/10.1016/j.jglr.2013.01.003
F. Yousef et al. / Journal of Great Lakes Research xxx (2013) xxx–xxx
giving the amount of stamp sand lost to offshore bay waters. In other words, the portion of eroded stamp sand that was not deposited onto the shore was calculated by difference to be dispersed across the offshore underwater region of the bay. Finally, the calculated deposition values to both onshore and offshore regions were plotted and regressed against time. Mass of the underwater stamp sand bars and interpolation method Migrating underwater stamp sand bars were discovered in the 2008 LiDAR bathymetric scene, aerial photos, and ground-truth sampling. They are located just southwest of the original stamp sand pile at nearshore depths (shoreline to 10 m). In an attempt to determine the mass of these bars, we used a first order slope change analysis to generate the floor of the natural bottom depth beneath the bars. This layer was then subtracted from the height of the underwater bars (LiDAR bathymetric data), giving the volume of the bars, which was then converted into mass. The high resolution LiDAR bathymetric data provided us with surrounding “true depth” values that were used for interpolation. After tuning the ‘map prediction’ option under Geostatistical Analyst/Kriging methods in ArcGIS 9.3 (ESRI, 2010), the final predicted bottom map was produced and rasterized. Change detection map for underwater stamp sand bar profiles The change detection map is simply a difference map of the pixel values between 2008 and 2010 LiDAR-derived images that helps us to understand the possible movements, erosion, and also accretion on the underwater stamp sand bars. Prior to calculating the difference map, we tried to remove the false differences caused by errors in vertical georectifications. The two maps were regressed over areas that had not changed much during the period between 2008 and 2010. For this purpose, we used depth values over Buffalo Reef (Fig. 4), which we assumed had “zero” changes since 2008 (due to its rocky nature). The result (not presented here) showed a 0.53 meter background difference which later was subtracted from the 2008 LiDAR derived image. The Change Detection\Compute Difference Map module under basic tools of ENVI 4.7 (ENVI, 2011) was used for the entire processing operation. We also compared and graphed the selected 2008 and 2010 depth profiles of the underwater stamp sand bars. For calculations and figures, recall that LiDAR resolution was ±30 cm in the vertical and, with resampling, ±3 m in the horizontal. Results General Traverse Bay erosional features The Gay, MI, tailings discharges are superimposed on and interacting with coastal features indicative of post-glacial events, such as submersed erosional structures (river beds, narrow canyon cuts, reefs) and depositional features (Nipissing Beach ridges, natural sand fields). Several Table 2 Mass of the stamp sands (million metric tonnes, Mt) associated with different sections of the shoreline through time [sections: 1) original pile; 2) S. end of original pile to Coal Dock; 3) Coal Dock to Traverse River]. Estimated decimal places are set by the 95% C.L. around the respective regressions (i.e. 95% C.L. = ±0.3 Mt for the original pile regression; ±0.3 for the Coal Dock portion; and ±0.1 for the Traverse River portion). Year
Original pile
Coal Dock
Traverse River
1938 1944 1954 1964 1978 1986 1997 2008
17.8 16.0 12.3 11.2 8.2 6.7 5.2 3.7
1.6 1.8 2.3 2.6 2.6 3.1 3.5 4.5
0.2 0.3 0.8 1.0 1.7 1.9 2.2 2.6
5
long-term erosional features are evident in the above water and underwater 2010 NOAA LiDAR scenes (Figs. 4, 5). Grand Traverse Bay is underlain by late Precambrian to early Cambrian Jacobsville Sandstone (Martin, 1936) that is laid bare by coastal erosion along the shelf margin. The irregular bedding planes that mark the Jacobsville Sandstone bedrock formation are very evident in high resolution LiDAR imagery. Bedrock stretches are prominent along the northern coastal reaches and off Gay, MI, on the outer raised portions of Buffalo Reef, and at the extreme southern margin of the bay, where emerging rock bluffs are encountered. In Grand Traverse Bay, the coastal bedrock seems to be eroding from the northeastern bare rock regions and is being deposited along the southwestern basin as natural white beach sand. The coarsegrained, high albedo reflectance of the natural white beach sand suggests historical origin from eroding Jacobsville Sandstone (Fig. 2). Additional eroded Jacobsville Sandstone sediments are contributed by two rivers: the Tobacco River to the northeast and the Traverse River to the southwest. In the bay, there are two natural catchment areas for eroded sediments: 1) a 2–3 m deep, but broad, ‘trough’ (darkened in Fig. 4) that cuts across the bedrock northeast of Buffalo Reef, and 2) sand fields across the southwestern basin of the bay (Figs. 4, 5). The ‘trough’ appears to be a now-submersed riverbed cut through the bedrock in early post-glacial times, following a terrestrial channel evident across the Keweenaw Peninsula in detailed DEM studies. A second, smaller erosional feature is a narrow and steep canyon that cuts through Buffalo Reef to the south, apparently eroded along a small displacement fault (Fig. 5), as the canyon falls along a line of misalignment between the eastern and western sections of the reef. Before tailings were discharged into Grand Traverse Bay, wave action and southwestward-directed currents eroded sediment from the Jacobsville Sandstone coastal shelf. The sediments accumulated in the ‘trough’ and moved into the southwestern basin margin of the bay, adding onto a Nipissing series of coastal dunes (Fig. 2) that developed as water depths were dropping. The LiDAR derived images revealed previously unsuspected bay-wide details about past and present sediment movements. White sand has accumulated along the southwestern bay stretch as a long sandy beach (Figs. 4, 5). Underwater, the natural fine-grain sandy and silty sediments appear to be superimposed upon the broken Jacobsville Sandstone bedrock, appearing as a relatively thick smooth layer punctuated by numerous erosional channels alternating with modest rises. Ground-truth Ponar sampling of sediments showed that the smooth bottom sediments in the southwestern basin were almost exclusively naturally eroded materials, uncontaminated from anthropogenic stamp sands (Kerfoot et al., 2012). From the vertical perspective, the southwestern basin sediments give the appearance of a comb-like structure (Fig. 4). From an oblique perspective, we postulate that the sand and silt layers are moving out of the bay as if on a wide ‘conveyor belt’ (Fig. 5). To our knowledge, this type of progressive mass movement of natural sediments has not been previously described in the Great Lakes. We propose that all these general depositional features were fully developed before the anthropogenic tailings were deposited in Grand Traverse Bay. Primary tailings pile erosion The white sands in the southwestern portion of the bay, past the Traverse River break-wall, contrast with the almost gray to black low albedo reflectance of recently deposited “stamp sand” dunes, derived from copper ore tailings (Fig. 2; Kerfoot et al., 2012). In LiDAR derived coastal images, to the northeast and above water off the small town of Gay, MI, is the location of the original main tailings pile. At present, the pile remnants resemble a conical rim, as deep gouges in the middle mark stamp sand removal by the Keweenaw Road Commission (Fig. 4). Above the water surface and to the southwest of the pile are redeposited stamp sand beach stretches. These above-water environments contain depressions occupied by seepage ponds and show long dunes of stamp
Please cite this article as: Yousef, F., et al., Using LiDAR to reconstruct the history of a coastal environment influenced by legacy mining, J Great Lakes Res (2013), http://dx.doi.org/10.1016/j.jglr.2013.01.003
6
F. Yousef et al. / Journal of Great Lakes Research xxx (2013) xxx–xxx
Fig. 4. 2010 LiDAR bathymetric/topographic map of Grand Traverse Bay viewed from above (nadir). Superimposed red contour lines are at 5 m intervals. Note the underwater stamp sand bars moving across Jacobsville Sandstone bedrock on the coastal shelf. Darkened region marks the location of the ‘trough’, a relict riverbed, northeast of Buffalo Reef. Notice the “comb-like” raised ridges in broad natural sand stretches south of the Traverse River. Solid star symbols correspond to the location of underwater video camera pictures in Fig. 9.
sands either deposited in rows and/or drifting across the surface (Figs. 2, 4). Compilations from company records (Michigan Tech Archives) give an estimated 22.8 Mt discharge onto the pile from the two working stamp mills between 1900 and 1932 (Kerfoot et al., 2009, 2012). Our estimated amount on the pile in 1938, the time of the first aerial photograph, was around 18 Mt (Table 2).
Using a 1906 bathymetric map and 2008 LiDAR over-flight to estimate bottom contours, and seven aerial images to measure erosional slices across the pile through time (Fig. 3), we estimated that erosion of the Gay tailings pile was greatest early in the record and has declined recently. As mentioned in the Methods section, to handle the nonlinearity, we decided to log-transform (natural log, ln) the mass erosion
Fig. 5. 2010 LiDAR bathymetric/topographic map of Grand Traverse Bay from an oblique view. Notice the sharp underwater canyon (dark linear feature) that splits Buffalo Reef into two halves. In the southern portion of the bay, see the band of natural fine sediments hypothesized to be moving into deeper waters.
Please cite this article as: Yousef, F., et al., Using LiDAR to reconstruct the history of a coastal environment influenced by legacy mining, J Great Lakes Res (2013), http://dx.doi.org/10.1016/j.jglr.2013.01.003
F. Yousef et al. / Journal of Great Lakes Research xxx (2013) xxx–xxx
values. The resulting fit was exceptional (R 2 = 0.99). The regression fit to log-transformed data was plotted versus time and used to predict 1) the rate of erosion and 2) the ‘zero’ mass intercept date (Fig. 6a, Table 3). The predicted ‘zero’ mass date was 2062, with ±95% C.L. of 2054 and 2071. From the 2008 LiDAR derived image and 1906 bathymetry map (see Methods), we could also estimate the accumulation history of redeposited beach sands along various sections of the coast (Table 4). The entire mass of stamp sand redeposited along the coastline was estimated as 7.0 Mt, which amounts to 30.7% of the original mass of stamp sand discharged onto the pile (22.8 Mt). Given the LiDAR high resolution and the clear gouges left on the pile by the Road Commission, we could also estimate that winter road application and bed construction removed about 1.01 Mt of the Gay, MI, pile total mass (4.4%). So of the 22.8 Mt originally discharged onto the pile, 3.7 Mt (16.2%) remains on the pile, 7.0 Mt (30.7%) was redeposited along the shoreline, and 1.01 Mt (4.4%) was removed by the County Road Commission. By
7
difference, the remaining 11.1 Mt (48.7%) has moved out into Grand Traverse Bay, spreading across the underwater substrates. Contrasting various erosional patterns through time Given the excellent time resolution afforded by the combination of aerial and LiDAR imagery, we could also estimate beach stamp sand accumulation patterns and, by difference, examine how much has moved progressively underwater into the bay through time. Both the Coal Dock and Traverse Bay Seawall appear to have acted as groins, retaining migrating stamp sand on their upstream sides. Patterns of deposition along different stretches of the beach (original pile to Coal Dock section; Coal Dock to Traverse River sections) were compared to the erosion of the original tailings pile (Fig. 7). As mentioned earlier, the mass of the original tailings pile shows a nonlinear, proportional (exponential decay) loss of stamp sands through time. The historical erosion is pronounced enough, that now the mass of stamp sand in the original pile (3.7 Mt) is far less than the combined amount along the shoreline to the south of the pile (7.0 Mt). The Coal Dock stretch is holding 4.5 Mt of stamp sand. Along the shoreline beach, accumulation over time in the original pile-Coal Dock section appears to fit a linear function (Fig. 7; Table 3; R2 = 0.93). The mass of stamp sand in the Coal Dock to Traverse River sections (2.57 Mt; section 3) also shows an increasing linear trend with a time delay (Fig. 7; Table 3; R2 = 0.99). That the functions are positive should be no surprise, since the eroded stamp sands are pushed southwestward by a combination of strong southward-directed waves and currents. Both curves show simple (linear) trends with nearly identical slopes (Coal dock section slope = 0.034, S.E. = 0.003; Traverse River slope = 0.033, S.E. = 0.001). Using the combination of aerial photos and LiDAR derived images, we could also estimate the time course of loss into the bay by difference. Total redeposition onto the shoreline shows a linear, increasing trend (P b 0.05, Table 3), whereas erosion into offshore regions of Lake Superior from 1938 to 2008 shows an accumulation curve that reaches an asymptote (Fig. 8a; Table 3). Notice from both accumulation curves that more materials have moved into the bay than have accumulated along the beaches. Moreover, most of the eroded stamp sand from the original tailings pile is now being re-deposited and moved across the bay bottom. When treated as a series of two-point estimates, the declining rate for transfer of sediments into the bay is very evident (Fig. 7b). Presumably much of the declining rate is due to the dwindling amount at the source, i.e. the original tailings pile. One might argue that the original erosion of the tailings pile was heavily influenced by a combination of strong waves and offshore currents, whereas the movement along the beach was largely due to wave action aided by weaker long-shore currents. Migrating underwater stamp sand bars
Fig. 6. Erosion of the Gay tailings pile through time: a) Log-transformed mass remaining on the Gay tailings pile through time, starting with 1938. Notice that the regression (solid line) X-intercept is 2062, with ±95% confidence intervals; b) Mass dynamics on different coastal regions: squares document nonlinear erosion (loss) from Gay tailings pile through time; circles represent mass redeposited in the Coal Dock region; and triangles are the mass redeposited in the Traverse River region. The latter two regions conform closely to a linear accumulation of stamp sand mass through time. The numbers associated with each line represent the coastal stretch in Fig. 2.
LiDAR derived imagery also revealed intriguing details associated with stamp sand spread into the bay and along the coast towards Buffalo Reef. Underwater stamp sand bars off Gay (Figs. 4, 8) have a distinct appearance that can distinguish them from surrounding Jacobsville Sandstone bedrock. They have smooth slopes and rounded edges. LiDAR imagery revealed that underwater bars spread out from the original tailings pile and are aligned in a northeast to southwesterly direction, stretching out over the Jacobsville Sandstone shelf (Figs. 4, 5). These long bars have southwestern ends that appear to dump into the ‘trough’ north of Buffalo Reef. The migrating piles were confirmed as being composed of stamp sands by ground-truth Ponar samples (Kerfoot et al., 2012) and lie at water depths of 0 to 10 m. At present, the bars near the original tailings pile cover an area of about 1.08 km2 (more than the original pile) and are especially pronounced on the 2010 NOAA LiDAR derived images. After processing the imagery and recalculating the thickness of the underwater stamp sand, we estimated that the mass of stamp sand in the large
Please cite this article as: Yousef, F., et al., Using LiDAR to reconstruct the history of a coastal environment influenced by legacy mining, J Great Lakes Res (2013), http://dx.doi.org/10.1016/j.jglr.2013.01.003
8
F. Yousef et al. / Journal of Great Lakes Research xxx (2013) xxx–xxx
Table 3 Regression values for stamp sands eroded off of original pile (section 1) and deposition onto onshore/offshore locations (sections 2–3), including mass dynamics for erosion into bay (by difference). Fit type
No.
Regression
Y-intercept
Slope
R2
X-intercept
Lower limit
Upper limit
Linear
1 2 3 4 5 6
Ln of mass of original stamp sand pile loss (section 1) Mass deposited on Coal Dock region (section 2) Mass deposited on Traverse River region (section 3) Eroded from original pile onto onshore Eroded from original pile into offshore Eroded from original pile into offshore y = A + B*x + C*x^2 Equation y0
46.59 −66.17 −66.97 −157.19 −238.37 A = −6711
−0.023 0.035 0.035 0.08 0.12 B = 6.687 C = −0.001 t1
0.99 0.93 0.99 0.93 0.91 0.98
2062 – – – – –
2054 – – – – –
2071 – – – – –
Polynomial 2nd order Fit type
Source
Non-linear
Original pile mass (section 1)
y = A1 · e(−x/t1) + y0
−1.424
A1 7.65 × 10¹⁶
53.8197
R2
X-intercept
Lower limit
Upper limit
0.99
2073
2042
>2080
bars is about 0.6 (±0.1) Mt, about 6% of the total mass of stamp sand lost to the offshore region. Bars that are closer to the shoreline have steeper slopes compared to those that lie in deeper waters. The shallow-water stamp sand bars are also narrower (Fig. 8a). The results from the change detection analysis showed that underwater bars in the shallow regions move more than deeper bars, inching rapidly towards greater depths (Fig. 8b). The boundaries and overall shape of the large, deeper bars did not appear to change as much. However, the deeper, larger bars showed slight stamp sand accumulation between 2008 and 2010 and evidence for internal, lateral movement. In the deeper, larger bars, there appears to be a progressive creep from the northeast to southwest (loss, bright blue; deposition, bright red), especially evident along the southwestern ridges (Fig. 8a). Depth profiles (Fig. 8b) of stamp sand bars in 2008 and 2010 also confirm the overall pattern. The location of the depth transect is marked with a straight light line in Fig. 8a. The shallow water bars show more movement than the bars in deeper waters. Moreover, the deeper bars appear to remain in place and tend to accumulate stamp sand. Our general interpretation of these difference patterns is that they indicate that bars in shallow water are moved progressively into deeper waters, where they coalesce with the larger bars. On the other hand, the large bars show active lateral movement, as sands erode from northeasterly faces and are deposited onto southwesterly faces. Evidence whether the large bars eventually creep down over the Jacobsville Sandstone coastal shelf into deeper waters, or move laterally into the ‘trough’ near Buffalo Reef, will require longer-duration LiDAR monitoring.
Discussion In Grand Traverse Bay, LiDAR-based erosion and deposition calculations for stamp sand movement revealed some very interesting features and deposition patterns. The original stamp sand pile was sluiced into a historical erosional zone, whereas the Coal Dock and Traverse River stretches fell into historical depositional zones (Nipissing Beach deposits). Two prominent natural catchment regions for eroded sediments included an old eroded riverbed (the ‘trough’) northeast of a mid-bay reef (Buffalo Reef). The prominent reef and a groin-like anthropogenic Table 4 Estimated amount of stamp sand deposited on shoreline and offshore into Keweenaw Bay (by difference). Percentage is relative to amount originally discharged on Gay pile (22.8 Mt). Estimate of stamp sand
Mass (Mt)
%
Original discharged mass (1901–1932) Stamp sand removed by Road Commission Remaining stamp sand on Gay pile (year 2008) Stamp sand redeposited on beach Total shoreline (pile + beach, year 2008) Deposited in Keweenaw Bay (by difference)
22.8 1.0 3.7 7.0 10.8 11.1
100 4.4 16.2 30.7 47.4 48.7
Fig. 7. Total accumulative mass of stamp sand eroded to onshore and offshore regions between 1938 and 2008: a) offshore trends (circles) are fit with both linear (dotted line) and polynomial (solid line) functions, whereas the onshore (beach; solid triangles) accumulation is fit with a linear (dashed line) equation (Table 3). b) Running two-point estimate of % loss from the 1938 tailings pile total (18 Mt) to the bay; approximates the slope of the polynomial regression. That is, the percentage of mass lost to the bay from the remaining pile (total) is declining through time. The R2 values of various regressions are given next to the lines.
Please cite this article as: Yousef, F., et al., Using LiDAR to reconstruct the history of a coastal environment influenced by legacy mining, J Great Lakes Res (2013), http://dx.doi.org/10.1016/j.jglr.2013.01.003
F. Yousef et al. / Journal of Great Lakes Research xxx (2013) xxx–xxx
9
Fig. 8. Change detection maps of sand bar movement: a) Map represents changes in the erosion (loss; bright blue) and deposition (bright red) patterns between 2008 and 2010 LiDAR images at underwater region east of Coal Dock. The yellow line marks the transect line for detailed height measurements of individual bars. b) Along the transect, the black line represents the height of the selected profile in 2010, whereas the red line represents the height of the same profile in 2008. The green solid line represents the interpolated bottom. Note relative shifts in the dune positions. Recall that the vertical resolution is ±30 cm, whereas the horizontal resolution is ±3 m.
shoreline structure (the Coal Dock) served to capture migrating sands, diverting them into the ‘trough’. The small canyon in Buffalo Reef may have formed at the same low water stage when the ‘trough’ was cut. Similar channel cutting patterns near Thunder Bay (Boyd et al., 2010) suggest a drop of Lake Superior water levels during the Houghton Low (7900– 8100 years before present; yrs B.P.). Overflow from glacial Lakes Agassiz or Ojibway associated with retreat of the Laurentide Ice Sheet are suspected additional sources of water. After about 6400 yrs B.P., glacial rebound lifted the North Bay outlet sill above the Sault Ste. Marie sill and set about the onset of the Nipissing transgression. Regarding the Nipissing sequence, there is considerable debate about how the sequence relates to climate, with emerging evidence that the last 4000 yrs of water level fluctuations in Lake Superior have been influenced by wetter and drier periods (Booth et al., 2002; Brugam et al., 2004; Sharma et al., 2005). Johnston et al. (2000) found that the southwestern beach ridges in Grand Traverse Bay were deposited between 3800 and 900 yrs B.P. In the sequence, a single ridge formed every 36 years, with indications of changing rates of water lowering. The sequence indicates that relative lake levels lowered about 4.5 m between 3800 and 1200 yrs B.P., then actually increased 0.7 m between 1200 and 900 yrs B.P. Moreover, changes in mean grain-size in the
lake-ward ridges indicate larger wave action between 1200 and 900 yrs. B.P., suggesting a shift in the predominant wind direction after 1200 yrs B.P. (Johnston et al., 2000). In an earlier study, Rasmussen et al. (2002) pointed out that the natural beach breadth has increased along the redeposition region since 1938, but this is due almost exclusively to an accumulation of anthropogenic tailings (stamp sands) deposited on top of an existing natural beach, augmenting beach mass. The Traverse River Seawall has blocked further southward migration of stamp sand since the early 1970s, although recent overtopping (2010–2011) has finally breached this barrier. Our analysis of aerial photos between 1978 and 2008 shows an increased beach width of about 3 m per year. At present, the coastal mass of redeposited stamp sand in the Coal Dock region exceeds what is left at the original tailings pile site. Recall that the adjacent natural Nipissing beaches had a progradation rate of 0.7 ± 0.1 m per year (Johnston et al., 2000). So the accumulation of stamp sands today is almost 4.3 times faster than the natural past maximum sand accumulation on the Nippising beach ridges. Just by measuring stamp sand-traveling distance/year by regression studies, we were also able to predict the distance that stamp sand might have traveled in the absence of the Traverse River Seawall, i.e. about 1.5 km more to the south over natural sand beaches. Although the Army Corps
Please cite this article as: Yousef, F., et al., Using LiDAR to reconstruct the history of a coastal environment influenced by legacy mining, J Great Lakes Res (2013), http://dx.doi.org/10.1016/j.jglr.2013.01.003
10
F. Yousef et al. / Journal of Great Lakes Research xxx (2013) xxx–xxx
Traverse River Seawall caused an increase in the accumulation of stamp sand (increased beach width), it also proved an effective barrier, temporarily halting southward migration of stamp sand. Surface waves, nearshore and offshore currents, along with winter storms, are major factors reshaping shorelines all around the world (Dean and Darlymple, 1991; Oldale, 1999; Reed, 1989). The combination of LiDAR, aerial photography, and bathymetric maps permitted calculations of historic stamp sand mass deposition and erosion. Our observations document that the original tailings pile experienced an exponential decay in erosion through time (Fig. 6), with almost all of the mass traveling southwestward. We suggest that placement of the original tailings pile in deep water off Gay contributed to rapid initial erosion once operations ceased, since the pile was deeper along the offshore margin and exposed to maximum wave action and strong alongshore currents. Surface waves, alongshore currents, and winter ice all have created scour and moved materials in Grand Traverse Bay (Kerfoot et al., 2009, 2012; Weston, 2007). Prevailing currents along the eastern coastline of the Keweenaw Peninsula flow predominantly southward, parallel to isobaths (Chen et al., 2001; Sloss and Saylor, 1976; Zhu et al., 2001). Measurements by Sloss and Saylor (1976) documented periodically strong (1.0–5.0 cm/s−1) summer and fall southward alongshore flows. In other studies, Hawley (2000) and Churchill et al. (2004) found that surface wave currents had a seasonal component, strongest in Lake Superior during late autumn to winter. Churchill et al. (2004) also caution that high-frequency motions in internal waves could be of fundamental importance in generating bottom stress at locations where the seasonal thermocline intersects bottom strata. Clearly, winter shoreline wave action and ice also move stamp sands down-drift and out into the bay (Budd et al., 1999; Weston, 2007). During December to March, creation of a nearshore ice complex would seem to protect the coastline against wave erosion. However, during winter storms, sediments accumulate in layer-cake fashion on top of nearshore ice complexes, subsequently contributing to beach loading during spring melting (Budd et al., 1999). Salt-and-pepper deposition of stamp sands on top of fine deep-water sediments suggests recent ice rafting and deposition during spring melt (Kerfoot et al., 2012). Whether the latter pattern is due to progressive movement of stamp sands along the coast during winter storms or to changing patterns of ice drift is unclear. Concern about underwater stamp sand migration involves encroachment of stamp sands onto Buffalo Reef. Not only do stamp sands have high copper concentrations (1500–13,000 micrograms (μg) g−1; mean 2863 μg g−1; n = 274; MDEQ, 2006; Kerfoot et al., 2009, 2012), the Keweenaw Bay Tribal Community is concerned that stamp sands will fill in the scattered cobble fields that surround the reef, compromising depressions that normally shield eggs deposited by lake trout and lake whitefish (Chiriboga and Mattes, 2008). Evidence that both processes are of genuine concern come from underwater photos of moving stamp sands (Fig. 9; from Biberhofer and Procopec, 2008) and from prior toxicity tests of stamp sands (Lyttle, 1999; Malueg et al., 1984; Weston, 2007). The images depict 1) undisturbed fields of natural cobbles, 2) stamp sands moving over Jacobsville Sandstone bedrock, and 3) stamp sands invading cobble fields. In the detailed LiDAR-derived bottom surfaces of Grand Traverse Bay (Figs. 4, 5), stamp sands moving out of the ‘trough’ appear to be moving into the cobble fringe north of Buffalo Reef, creating a flatter area. Southwestward movement and deposition of stamp sands along the shoreline also increases the risk of encroachment onto Buffalo Reef during winter storms and extreme weather conditions. Change detection analysis showed that underwater stamp sand bars move towards the ‘trough’ and deposit stamp sands into that depression. Profiling the underwater bars also provide valuable information on the displacement of the bars between 2008 and 2010. As it is evident from the change detection map, the underwater stamp sand bars migrate into deeper waters where they coalesce into large bars that creep laterally, emptying into a
broad ‘trough’ northeast of Buffalo Reef. Preliminary calculations of ‘trough’ surface and volume give 1,275,400 m2 and 4,205,200 m3, respectively. If the remainder of the stamp sand pile is converted into cubic meters, it is around 2,120,000 m3, roughly half of the calculated volume of the trough. At the present rate of erosion, about 55,000 m3 of stamp sands is moving across bedrock towards the trough each year. From the LiDAR images, the shallow portion of the trough now seems full, with overtopping moving southwestward into some of the cobble fields around Buffalo Reef. In the past, the land-water interface has posed characterization problems. On the shoreline side, before the advent of the Global Positioning System (GPS) and LiDAR, shoreline position analysis and beach profiling were based largely on historical aerial photographs and topographic maps (Jensen, 2007; Kelmas, 2011; Morton and Miller, 2005). Along the nearshore water margin, traditional shipboard sonar survey methods encountered significant limitations, such as shallow-water hazards, shoals, currents, and marine tides (Guenther et al., 2000). However, high-resolution LiDAR has now become a preferred option, as it allows simultaneous mapping of nearshore bathymetry, navigational canals, remote and shallow harbors, wetlands, and shoreline erosion. In a single LiDAR survey (8 h), aircraft can cover a study area that would require a week or more for a vessel to survey. Also, when classifying the bottom, LiDAR amounted to 10% (or less) the cost for shipboard surveys (Brown et al., 2002). Here the ability of LiDAR to map topographic and bathymetric features simultaneously in fine details (spatial resolution 2–3 m and ±30 cm vertical accuracy; Quadros et al., 2008) was a significant advantage. Additional SONAR transects (NWRI; KBIC tribal projects) served as an important complement (Biberhofer and Procopec, 2008). Because the LiDAR depth-sounding technique depends upon laser penetration of waters, optical water clarity was the most critical property of Lake Superior waters, allowing 22 m depth penetration. River inflow, resuspended sediments, and air bubbles are a few factors that increase light attenuation in the water column and hinder maximum penetration (Kelmas, 2011). Fortunately, the low productivity of Lake Superior means that imagery is not as compromised by phytoplankton blooms, benthic periphyton films and aquatic macrophytes as are the coastal stretches of the lower Great Lakes.
Concluding remarks In Lake Superior, high water clarity allowed excellent high-resolution mapping of coastal bathymetric features to a depth of 22 m. We discovered several previously unrecognized post-Pleistocene erosional features (e.g., river bed channel, narrow canyon through Buffalo Reef) and revealed what appears to be a conveyor-belt movement of natural sediments out of the lower bay. Discharge of tailings onto the coastal shelf margin off Gay between 1900 and 1932 provided the opportunity to trace anthropogenic stamp sand movements in Grand Traverse Bay and to see how these migration patterns interacted with the postPleistocene features. Using a combination of aerial photographs and LiDAR derived imagery, we quantified an 80-year record of specific mass erosion and deposition dynamics. The fact that century-long estimates of pile erosion fit a simple exponential decay function and that sediment accumulation along two separate stretches of coastal beach fit a simple linear function is very intriguing. At present, progressive encroachment by stamp sands is threatening Buffalo Reef, a critical lake trout and whitefish breeding ground, by filling up a trough in front of the reef and spilling over into the cobble beds around the reef. With its great spatial resolution, LiDAR derived imagery is giving us a much better understanding of the fate of “legacy” mining discharges. Given that global climate change is modifying shoreline ice cover and storm frequency/magnitude patterns in the Great Lakes (Austin and Colman, 2007; Schwab et al., 2006), we would expect that these coastal erosion patterns will show departures in the near future.
Please cite this article as: Yousef, F., et al., Using LiDAR to reconstruct the history of a coastal environment influenced by legacy mining, J Great Lakes Res (2013), http://dx.doi.org/10.1016/j.jglr.2013.01.003
F. Yousef et al. / Journal of Great Lakes Research xxx (2013) xxx–xxx
11
Fig. 9. Underwater camera images of various bottom substrates in Grand Traverse Bay: 1) top left, natural cobble field, 2) top right, cobbles and boulders covered by natural sand, 3) bottom left, stamp sands creeping across natural Jacobsville Sandstone bedrock, and 4) bottom right, stamp sands moving into a cobble field. Encrypted data gives: date, time, station name and number, and the station geographical coordinate in UTM, Zone = 16. Sites of photos are shown in Fig. 4. Taken from Biberhofer and Procopec (2008).
Acknowledgments Primary funding came from the Army Corps of Engineers ERDC-EL laboratory and was provided by the System Wide Water Resources Program (Dr. Steve Ashby, program manager) at Vicksburg. Efforts were also aided by a National Science Foundation OCE 97-12872 grant to WCK, and a U.S. Environmental Protection Agency Region V Grant to the Baraga Tribal Council passed through to W.C.K. Support for the CHARTS flight and initial data processing was provided by the Corps National Coastal Mapping Program managed by Dr. Jennifer Wozencraft at the JALBTCX Center. We thank Dave Schwab, NOAA GLERL, Ann Arbor, for the assistance on the NOAA LiDAR series overflight and coastal forecast information. We also thank Esteban Chiriboga, and especially Hans Biberhofer for sharing details of the National Water Research Institute and Great Lakes Indian Fish and Wildlife Commission sonar mapping and sediment sampling efforts in Grand Traverse Bay. We also want to recognize the data processing support provided by Michael Sayers and Nathaniel Jessee at MTRI. Lucille Zelazny aided preparation of figures. References Austin, J.A., Colman, S.M., 2007. Lake Superior summer water temperatures are increasing more rapidly than regional air temperatures: a positive ice-albedo feedback. Geophys. Res. Lett. 34, L06604 http://dx.doi.org/10.1029/2006GL029021. Benedict, C.H., 1952. Red Metal: The Calumet and Hecla Story. University of Michigan Press, Ann Arbor, MI. Benedict, C.H., 1955. Lake Superior Milling Practice. Michigan College of Mining and Technology, Houghton. Biberhofer, J., Procopec, C.M., 2008. Delineation and characterization of aquatic substrate features on or adjacent to Buffalo Reef, Keweenaw Bay, Lake Superior. Environment Canada National Water Resource Institute (NWRI), Technical Note AERMB-TN06. Booth, R.K., Jackson, S.T., Thompson, T.A., 2002. Paleoecology of a northern Michigan lake and the relationship among climate, vegetation, and Great Lakes water levels. Q. Res. 57, 120–130. Bowen, Z.H., Waltermire, R.G., 2002. Evaluation of light distancing and ranging (LiDAR) for measuring river corridor topography. J. Am. Water Resour. Assoc. 38, 33–41. Boyd, M., Teller, J.T., Yang, Z., Kingsmill, L., Shultis, C., 2010. An 8,900-year-old forest drowned by Lake Superior: hydrological and paleoecological implications. J. Paleolimnol. http:// dx.doi.org/10.1007/s10933-010-9461-1. Brock, J., Wright, C., Sallenger, A., Krabill, W., Swift, R., 2002. Basis and methods of NASA airborne topographic mapper LiDAR surveys for coastal studies. J. Coast. Res. 18, 1–13.
Brock, J.C., Wright, C.W., Clayton, T.D., Nayegandhi, A., 2004. LIDAR optical rugosity of coral reefs in Biscayne National Park, Florida. Coral Reefs 23, 48–59. Brown, E.D., Churnside, J.H., Collins, R.L., Veenstra, T., Wilson, J.J., Abnett, K., 2002. Remote sensing of capelin and other biological features in the North Pacific using LiDAR and video technology. ICES J. Mar. Sci. 59, 1120–1130. Brugam, R.B., Owen, B., Kolesa, L., 2004. Continental-scale climate forcing factors and environmental change at Glimmerglass Lake in the Upper Peninsula of Michigan. Holocene 14 (6), 807–817. Budd, J., Kerfoot, W.C., Pilant, A., Jipping, L.M., 1999. The Keweenaw current and ice rafting: use of satellite imagery to investigate copper-rich particle dispersal. J. Great Lakes Res. 25, 642–661. Butler, B.S., Burbank, W.S., 1929. The copper deposits of Michigan. United States Geological Survey Professional Paper No. 144. Chen, C., Zhu, J., Ralph, E., Green, S.A., Wells Budd, J., Zhang, F.Y., 2001. Prognostic modeling studies of the Keweenaw Current in Lake Superior. Part I: formation and evolution. J. Phys. Oceanogr. 31, 379–395. Chiriboga, E.D., 2006. GLIFWC Buffalo Reef and stamp sand substrate mapping project. Abstract, Remote Sensing Across the Great Lakes: Observations, Monitoring and Action. April 4–6, Rochester, N.Y. Chiriboga, E.D., Mattes, W.P., 2008. Buffalo Reef and Substrate Mapping Project. Administrative Report 08–04. Great Lakes Indian Fish and Wildlife Indian Commission (GLIFWIC), P.O. Box 9, Odanah, WI 54861. Churchill, J.H., Williams, A.J., Ralph, E.A., 2004. Bottom stress generation and sediment transport over the shelf and slope off of Superior's Keweenaw Peninsula. J. Geophys. Res. 109, C10S04 http://dx.doi.org/10.1029/2003JC001997. Clarke, D.H., 1978. Copper Mines of Keweenaw, No. 12. Mohawk Mining Company, Lake Linden, Michigan. Dean, R.G., Darlymple, K.A., 1991. Water wave mechanics for engineers and scientist. 2nd Series of Ocean Engineering: World Scientific, vol. 2. Guenther, G.C., 1985. Airborne laser hydrography: system design and performance factors. National Oceanic and Atmospheric Administration Professional Paper Series, National Ocean Service, 1, p. 385. Guenther, G.C., 2007. HYPERLINK “http://www.jalbtcx.org/downloads/Publications/ DEM_Chapter08.pdf” Digital Elevation Model Technologies and Applications, The DEM user’s manual, 2nd edition. : In: Maune, D. (Ed.), American Society for Photogrammetry and Remote Sensing, Chapter 8: Airborne LIDAR Bathymetry, pp. 253–320. Guenther, G.C., Cunningham, A.G., LaRocque, P.E., Reid, D.J., 2000. Meeting the Accuracy Challenge in Airborne LiDAR Bathymetry. European Association of Remote Sensing Laboratories, Dresden. Hawley, N., 2000. Sediment suspension near the Keweenaw Peninsula, Lake Superior during the fall and winter 1990–1991. J. Great Lakes Res. 26, 495–505. Irish, J.L., McClung, J.K., Lillycrop, W.J., 2000. Airborne lidar bathymetry: the SHOALS system. PIANC Bull. 103, 43–53. Jensen, J.R., 2005. Introductory Digital Image Processing, 3rd ed. Prentice Hall, Upper Saddle River, NJ (526 pp.). Jensen, J.R., 2007. Remote Sensing of the Environment: An Earth Resource Perspective, 2nd ed. Prentice-Hall, Upper Saddle River, NJ (592 pp.).
Please cite this article as: Yousef, F., et al., Using LiDAR to reconstruct the history of a coastal environment influenced by legacy mining, J Great Lakes Res (2013), http://dx.doi.org/10.1016/j.jglr.2013.01.003
12
F. Yousef et al. / Journal of Great Lakes Research xxx (2013) xxx–xxx
Johnston, J.W., Thompson, T.A., Baedke, S.J., 2000. Preliminary report of Late Holocene lake-level variation in southern Lake Superior: part 1. Indiana Geological Survey, Open File Study 99–18.Indiana University, Indiana. Kelmas, V., 2011. Beach profiling and LIDAR bathymetry: an overview with case studies. J. Coast. Res. 27, 1019–1028. Kerfoot, W.C., Lauster, G., Robbins, J.A., 1994. Paleolimnological study of copper mining around Lake Superior: artificial varves from Portage Lake provide a high resolution record. Limnol. Oceanogr. 39, 649–669. Kerfoot, W.C., Jeong, J., Robbins, J.A., 2009. Lake Superior mining and the proposed mercury zero-discharge region. State of Lake Superior: In: Munawar, M. (Ed.), Ecovision World Monograph Series, pp. 153–216. Kerfoot, W.C., Yousef, F., Green, S.A., Regis, R., Shuchman, R., Brooks, C.N., Sayers, M., Sabol, B., Graves, M., 2012. LiDAR (light detection and ranging) and multispectral studies of disturbed Lake Superior coastal environments. Limnol. Oceanogr. 57 (3), 749–771. Kinzel, P.J., Wright, C.W., Nelson, J.M., Burman, A.R., 2007. Evaluation of an experimental LiDAR for surveying a shallow, braided, sand-bedded river. J. Hydraul. Eng. 133, 838–842. Kolak, J.J., Long, D.T., Kerfoot, W.C., Beals, T.M., Eisenreich, S.J., 1999. Nearshore versus offshore copper loading in Lake Superior sediments: implications for transport and cycling. J. Great Lakes Res. 25, 611–624. Kraft, K.J., 1979. Pontoporeia distribution along the Keweenaw shore of Lake Superior affected by copper tailings. J. Great Lakes Res. 7, 258–263. Kraft, K.J., Sypniewski, R.H., 1981. Effect of sediment copper on the distribution of benthic macroinvertebrates in the Keweenaw Waterway. J. Great Lakes Res. 7 (3), 258–263. LaRocque, P.E., West, G.R., 1990. Airborne laser hydrography: an introduction. ROPME/ PERSGA/IHB Workshop on Hydrographic Activities in the ROPME Sea Area and Red Sea (Kuwait City). Long, T.A., Angelo, J., Weishampel, J.F., 2011. LiDAR-derived measures of hurricane- and restoration-generated beach morphodynamics in relation to sea turtle nesting behaviour. Int. J. Remote Sens. 32 (1), 231–241. Lyttle, R.D., 1999. In situ copper toxicity tests: applying likelihood ratio tests to Daphnia pulex incubations in Keweenaw Peninsula waters. J. Great Lakes Res. 25, 744–759. Mackey, B.H., Roering, J.J., Lamb, M.P., 2011. Landslide-dammed paleolake perturbs marine sedimentation and drives genetic change in anadromous fish. Proc. Natl. Acad. Sci. U. S. A. http://dx.doi.org/10.1073/pnas.1110445108. Malueg, K.W., Schuytema, G.S., Krawczyk, D.F., Gakstatter, J.H., 1984. Laboratory sediment toxicity tests, sediment chemistry and distribution of benthic macroinvertebrates in sediments from the Keweenaw Waterway, Michigan. Environ. Toxicol. Chem. 3, 233–242. Martin, H.M., 1936. The centennial geological map of the northern peninsula of Michigan: Michigan Geological Survey, publication 39, geological series 33, scale: 1:5000,000. MDEQ, 2006. Toxicological Evaluation for the Gay, Michigan Stamp Sand. W.O. No 20083.032.00. Weston Solutions, Houghton, MI. Monette, C.J., 1992. Upper Peninsula's Wolverine (Lake Linden, MI). Morton, R.A., Miller, T.L., 2005. National assessment of shoreline changes: part 2. Historical shoreline changes and associated coastal land loss along the U.S. Southeast Atlantic Coast. USGS. Open-file report. 2005,1401:40. Murdoch, W.A., 1943. Boom Copper: The Story of the First United States Mining Boom. MacMillan. Nayegandhi, A., Brock, J.C., Wright, C.W., 2005. Classifying vegetation using NASA's Experimental Advanced Airborne Research Lidar (EAARL) at Assateague Island National Seashore. American Society of Photogrammetry and Remote Sensing 2005 Annual Conference. Baltimore, MD.
Nayegandhi, A., Brock, J.C., Wright, C.W., O'Connell, M.J., 2006. Evaluating a small footprint, waveform-resolving lidar over coastal vegetation communities. Photogramm. Eng. Remote Sens. 72, 1407–1417. Oldale, R.N., 1999. Coastal erosion on Cape Cod: some questions and answers. Cape Nat. 25, 70–76. Pe'eri, S., Long, B., 2011. Lidar technology applied in coastal studies and management. J. Coast. Res. 62, 1–5. Quadros, N.D., Collier, P.A., Fraser, C.S., 2008. Integration of bathymetric and topographic Lidar: a preliminary investigation. Int. Arch. Photogramm. Remote Sens. Spat. Inf. Sci. B8, 1299–1304. Rasmussen, T., Fraser, R., Lemberg, D.S., Regis, R., 2002. Mapping stamp sand dynamics: Gay, Michigan. J. Great Lakes Res. 28, 276–284. Reed, D.J., 1989. Patterns of sediment deposition in subsiding coastal salt marches, Terrebonne Bay, Louisiana: the role winter storms. Estuaries 12, 222–227. Schwab, D.J., Eadie, B.J., Assel, R.A., Roebber, P.J., 2006. Climatology of large sediment resuspension events in southern Lake Michigan. J. Great Lakes Res. 32, 50–62. Sharma, S., Mora, G., Johnston, J.W., Thompson, T.A., 2005. Stable isotope ratios in swale sequences of Lake Superior as indicators of climate and lake level fluctuations during the Late Holocene. Quatern. Sci. Rev. 24, 1941–1951. Sloss, P.W., Saylor, J.H., 1976. Large-scale current measurements in Lake Superior. NOAA Technical Report ERL 363-GLERL 8.Great Lakes Environmental Research Laboratory, Ann Arbor, MI. Walker, B.K., Lance, K.B., Spieler, R.E., 2009. Relationship of reef fish assemblages and topographic complexity on southeastern Florida coral reef habitats. J. Coast. Res. 53, 39–48. Weston Solution of Michigan, INC., 2007. Migrating stamp sand migration plan technical evaluation. Report Prepared for Michigan Department of Environmental Quality, Remediation and Redevelopment Division. (225 pp.). Wright, C.W., Brock, J.C., 2002. EAARL: a lidar for mapping shallow coral reefs and other coastal environments. Proceedings of the Seventh International Conference on Remote Sensing for Marine and Coastal Environments, Miami, FL, 20–22 May 2002, Veridian International Conferences, Unpaginated CD-ROM. Zhang, K., Whitman, D., Leatherman, S., Robertson, W., 2005. Quantification of beach changes caused by hurricane Floyd along Florida's Atlantic coast using airborne Laser surveys. J. Coast. Res. 211, 123–134. Zhu, J., Chen, C., Ralph, E., Green, S.A., Budd, J.W., Zhang, F.Y., 2001. Prognostic modeling studies of the Keweenaw Current in Lake Superior. Part II: simulation. J. Phys. Oceanogr. 31, 396–410.
Web references Digital Coast NOAA, 2010. HYPERLINK “http://csc-s-maps-q.csc.noaa.gov/dataviewer/ viewer.html?keyword=lidar”. http://csc-s-maps-q.csc.noaa.gov/dataviewer/viewer. html?keyword=lidar. ENVI, 2011. ENvironment for Visualizing Images. Visual Information Solutions. (HYPERLINK “http://www.exelisvis.com/ProductsServices/ENVI.aspx”). http://www. exelisvis.com/ProductsServices/ENVI.aspx. ESRI, 2010. Economic and Social Research Institute, ArcDesktop. http://www.esri.com/. NRCS, 2010. U.S. Department of Agriculture's Natural Resource Conservation Service (HYPERLINK “http://websoilsurvey.nrcs.usda.gov/app/HomePage.htm”). http:// websoilsurvey.nrcs.usda.gov/app/HomePage.htm.
Please cite this article as: Yousef, F., et al., Using LiDAR to reconstruct the history of a coastal environment influenced by legacy mining, J Great Lakes Res (2013), http://dx.doi.org/10.1016/j.jglr.2013.01.003