Using local node information in decision trees: coupling a local labeling rule with an off-centered entropy Nguyen-Khang Pham, Thanh-Nghi Do, Philippe Lenca, and St´ephane Lallich,
Abstract— Dealing with skewed class distribution and costsensitive data has been recognized as one of the 10 most challenging problems in data mining research. These problems have been reported to hinder the performance of classifiers, especially on the minority class. To deal with this problem in decision tree induction we proposed an off-centered entropy while other authors proposed an asymmetric entropy. Compared to Shannon’s entropy both of them take their maximum value for a distribution fixed by the user instead of an uniform distribution. We here also propose to use in each leaf of the tree a local class labeling rule instead of the classical majority rule that mechanically favors the majority class i.e. the negative one. In this paper we briefly present the concepts of the three entropies and the new class labeling rule. This allows us to propose an adaptive learning of decision trees. We then compare their effectiveness on 25 imbalanced data sets. All our experiments are founded on the C4.5 decision tree algorithm, in which only the function of entropy and class labeling rule are modified. The results are promising and show the interest of our proposal.
I. I NTRODUCTION Dealing with imbalanced and cost-sensitive data has recently been recognized as one of the 10 most challenging problems in data mining research [1]. In supervised learning, the data set is said imbalanced if the class prior probabilities are highly unequal. In the case of two-class problems (we will only consider binary classification in this paper), the larger class is called the majority class and the smaller the minority class. Such imbalanced data sets are thus an important problem from both real applications and research points of view. Firstly, real-life two-class problems have often minority class prior under 0.10 (e.g. fraud detection, medical diagnostic or credit scoring). Secondly, in such a case the performances of data mining algorithms are lowered, especially the error rate corresponding to the minority class. The main reason underlying is that most of data mining algorithm try to maximize the accuracy. What is more, it is the minority class that the practitioner is interested in i.e. the minority class corresponds to positive cases and the cost of misclassifying the positive examples is higher than the cost of misclassifying the negative examples. Nguyen-Khang Pham is with IRISA, Rennes, France (email:
[email protected]). Thanh-Nghi Do is with Cantho University, Vietnam (email:
[email protected]). Philippe Lenca is with the Institut TELECOM, TELECOM Bretagne, UMR 3192 LabSTICC, Brest, France (email:
[email protected]). St´ephane Lallich is with the University of Lyon, ERIC Laboratory, Lyon 2, France (email:
[email protected]).
This problem gave rise to many papers, from which one can cite papers from two workshops associated which AAAI and ICML conferences respectively [2] and [3] and a special issue of SIGKDD [4]. As summarized by the review papers of [5], [6] and [7] or by the very comprehensive papers of [8] and [9], solutions to the class imbalance problems were proposed both at the data and algorithmic level. At the data level, these solutions change the class distribution. They include different forms of sampling, such that over-sampling (which increases the number of minority class data points, [4], [10]) or under-sampling (which decreases the number of majority class data points, [11]) on a random or a directed way. [12] proposed two ways of class imbalance learning that are designed to utilize the major class examples ignored by under-sampling. For a recent and comprehensive study of sampling one may refer to [13]. At the algorithmic level, one solution is to re-balance the error rate by weighting each type of error with the corresponding cost [14]. A study of the consistency of the costs re-balancing, for misclassification costs and class imbalance, is presented in [15]. For a comparison of cost sensitive approach and sampling approach one can see for example [16] and [17]. We focus in this paper on decision tree induction, especially C4.5 [18]. In a simple way, one have thus to consider the sampling problem, the split function, the pruning scheme and the class labeling rule. A comparative study using C4.5 decision tree shown that under-sampling beat over-sampling [19]. [20] propose to use a criterion of minimal cost, while [21] explore efficient pre-pruning strategies for the costsensitive decision tree algorithm to avoid overfitting. Some algorithmic solutions consist in adjusting the probabilistic estimates at the tree leaf or adjusting the decision thresholds [22]. [23] studied the quality of probabilistic estimates, the pruning scheme and the effect of preprocessing the imbalanced data set concerning C4.5. We first proposed a method to off-center whichever kind of entropy [24]. The interest of the off-centered entropy for decision tree is that it could take its maximal value for the a priori distribution of the class in any considered node. We then defined an adaptive learning strategy which replace the usual entropy used in tree induction algorithms by an offcentered entropy [25]. Experiments with C4.5, using majority rule to label the leaves of the tree, led to promising results. These previous works are clearly at the algorithmic level as we only modified the split function used in decision tree induction. At the algorithmic level an another challenge concerns
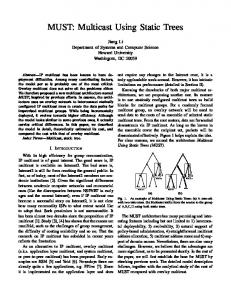
the labeling rule used in each leaf, specially in case of imbalanced data sets. Indeed the majority rule used in C4.5 is clearly not adapted and will mostly predict the majority class. In this paper we extend our previous considerations of using local information in each leave of the tree. We here consider the labeling rule in each leaf and propose to use a nearest neighbors approach. What is more one should notice that, even if the data are not initially imbalanced, a decision tree may process imbalanced data in any node. The rest of the paper is organized as follows. In section II, we first review splitting criterion based on Shannon’s entropies. We recall basic considerations on Shannon’s entropy and then briefly present our off-centered entropy and the asymmetric entropy proposed by [26]. In section III we present labeling strategies that could be applied in decision trees. Then, in section IV we compare the performances of different solutions based on the coupling of the three entropies used in this study and three labeling rules. These experiments are based on 25 imbalanced data sets and deliver interesting results. Finally, Section V draws conclusions and suggests future work. II. F ROM S HANNON ’ S ENTROPY TO NON - CENTERED ENTROPIES We first recall basic considerations on Shannon’s entropy and then present briefly two non-centered entropies in the boolean case and mention the results in the general case. A. Usual measures based on Shannon’s entropy Many induction tree algorithms on categorical variables use predictive association measures based on the entropy of Shannon [27]. Let us consider a class variable Y having q modalities, p = (p1 , . . . , pq ) being the vector of frequencies of Y , and a categorial predictor X having k modalities. The joint relative frequency of the couple (xi , yj ) is denoted pij , i = 1, P . . . k; j = 1, . . . q. What is more, we denote by q h(Y ) = − j=1 p.j log2 p.j the a priori Shannon’s entropy of Y and by h(Y /X) = E(h(Y /X = xi )) the conditional expectation of the entropy of Y with respect to X. Shannon’s entropy h(p), is a real positive function of p = (p1 , . . . , pq ) to [0..1], verifying notably interesting properties for machine learning purposes [28]: • h(p) is invariant by permutation of the modalities of Y ; • h(p) reaches its maximum log2 (q) when the distribution of Y is uniform (each modality of Y has a frequency of 1/q); • h(p) reaches its minimum 0 when the distribution of Y is sure (centered on one modality of Y and the others modalities being of null frequency); • h(p) is a strictly concave function. The behavior of Shannon’s entropy is illustrated in Fig. 1 in the boolean case. As example of measures based on Shannon’s entropy, one can mention: • the entropic gain h(Y ) − h(Y /X) [29]; h(Y )−h(Y /X) [30] which relates the en• the gain-ratio h(X) tropic gain of X to the entropy of X, rather than to the
a priori entropy of Y in order to discard the predictors having many modalities. For more measures and details one can refer to [31] and [32]. The particularity of these coefficients is that Shannon’s entropy of a distribution reaches its maximum when this distribution is uniform. That is to say that the reference value corresponds to the uniform distribution of classes. This characteristic could be a major problem especially in case of highly imbalanced classes, or when the classification costs differ largely. It would seem more logical to evaluate h(Y ) and h(Y /X = xi ) used in the above measures on a scale for which the reference value is centered on the independence situation i.e. on the a priori distribution of classes. B. Off-centered entropy The construction principle of an off-centered entropy is sketched out in the case of a class variable Y made of q = 2 modalities in [33] and [34]. The frequencies distribution of Y for the values 0 and 1 is noted (1 − p, p). This off-centered entropy associated with (1 − p, p) and noted ηθ (p) is maximal when p = θ, θ being fixed by the user and not necessarily equal to 0.5 (in the case of a uniform distribution). It is constructed with a simple transformation of the (1 − p, p) distribution into a (1 − π, π) distribution such that π increases from 0 to 1/2 when p increases from 0 to θ, and π increases from 1/2 to 1 when p increases from θ to 1. By looking for a linear expression of π as π = p−b a , on both intervals 0 ≤ p ≤ θ and θ ≤ p ≤ 1, we obtain: • •
π= π=
p 2θ if 0 ≤ p ≤ θ; p+1−2θ 2(1−θ) if θ ≤ p
≤ 1.
The off-centered entropy ηθ (p) is then defined as the entropy of (1 − π, π): ηθ (p) = −π log2 π − (1 − π) log2 (1 − π) . Note that the thus transformed frequency depends of θ and should be noted as πθ . We simply use π for clarity reasons. With respect to the distribution (1 − p, p), clearly ηθ (p) is not an entropy strictly speaking. Its properties must be studied considering the fact that ηθ (p) is the entropy of the transformed distribution (1 − π, π), i.e. ηθ (p) = h(π) and thus possesses such characteristics. Obviously invariance by permutation of modalities of Y is not more true and ηθ (p) is maximal for p = θ i.e. for π = 0.5. Proofs are given in detail in [35]. The behavior of this entropy is illustrated in Fig. 1 for θ = 0.2. Following a similar way as in the boolean case we extended the definition of the off-centered entropy to the case of a variable Y having q > 2 modalities and proposed a general decentring framework that can be applied to any measure of predictive association based on a gain of uncertainty [35], [24]. This allows to define a set of off-centered generalized entropies.
C. Asymmetric entropy Directly related to the construction of a predictive association measure, especially in the context of decision trees, [26] proposed an asymmetric entropy for a boolean class variable. This measure is asymmetric in the sense that one may choose the distribution for which it will reach its maximum. They preserve the strict concavity property but alter the maximality one in order to let the entropy reach its maximal value for a distribution chosen by the user (i.e. maximal for p = θ, where θ is fixed by the user). This implies revoking the invariance by permutation of modalities. They thus proposed: hθ (p) =
p(1 − p) (1 − 2θ)p + θ2
It can be noticed that for θ = 0.5, this asymmetric entropy corresponds to the quadratic entropy of Gini. The behavior of this entropy is illustrated in Fig. 1 for θ = 0.2. The authors extended also this approach in particular to the situation where the class variable has q > 2 modalities [36]. ×××× ××× ×××× ×× ×× ×××××××× ×× ×× ××× ×× ×× ×× ×× ×× ×× ×× ×× 0.8 ×× × ×× ×× ×× ×× ×× × × × × × 0.6 × × × × × × × × × × × × × × 0.4 × × × × × × × × × × × × 0.2 × Shannon × × × Asymmetric × × × × Off-centered × × × 0× 0 0.2 0.4 0.6 0.8 1 p
Entropies
1
Fig. 1.
Off-centered, asymmetric and Shannon’s entropies
III. T HE CLASS LABELING RULE The majority decision rule is by far the most commonly used labeling rule in tree induction. This can be explained by two reasons. Firstly, the majority rule exploits at best the intelligibility of decision trees. In particular, it is opposable; in the case of scoring, you can explain to a customer for which reason his credit demand is refused. Secondly, it is known that the majority rule is optimal in case of balanced classes and symmetrical costs of misclassification. Despite its popularity, the majority rule is particularly ill-suited to the case of imbalanced or cost-sensitive data. Indeed, consider the example of a cancer whose a priori probability is 0.02 for the individuals of a population. If in a leaf, the likelihood of cancer increases to 0.32, it means that the risk of cancer is multiplied by 16 for individuals of the leaf. Nevertheless, the application of majority rule remains insensitive to such a change. For each case of the leaf, the majority rule still predicts the absence of cancer. Among the different labeling rules, we distinguish between the global rules, the individualized rules and the aggregated rules. The global rules will assign the same class to all individual to be classified which belong to the same leaf. An
individualized rule uses further information to select the class to be attributed to each individual of the considered leaf. An aggregated rule will consider a combination of rules issued from multiple classifiers. An individual rule is well suited to imbalanced data, but the intelligibility of the rules is lost, even if the intelligibility of the tree is preserved. In the case of aggregated rules, both the tree and the rules intelligibility are lost. When using a global rule one choose the same class for all individuals from the same leaf on the basis of a rule which may be different from the majority rule. [37] have proposed two different labeling rules. The first one uses an implication index where the chosen class is the one which maximizes the index of the rule ”if the leaf is F then the class is Ci ”. The second one is the contribution to the entropy: the chosen modality is the one for which the contribution to the entropy of the leaf is the lowest among the modalities for which there are more cases than expected by chance. The main feature of this type of rule is to favor the minority class accuracy in the trade off between minority class and majority class. Beyond the majority rule (denoted by MR in the tables), another rule is known, the proportional random rule, which is naturally associated with the normalized gain of quadratic entropy [38]. The principle of this rule is to attribute the class at random, while respecting the distribution of the class in the considered leaf. This kind of rule is known for providing as good results as those offered by the majority rule, but it has the advantage of being less affected than the majority rule in case of imbalanced data. To settle the class labeling problem, we propose an individualized rule (denoted by k-NN-rule). The class assigned to an individual is the majority class among its k-nearest neighbors in the corresponding leaf. The nearest neighbors are based on the variables that have not yet been used to construct the leaf. If the topology induced by these variables adds some information about the class, the proposed rule is a kind of proportional rule which chooses the class better than chance. Otherwise, the proposed rule is confused with the rule of proportional allocation at random. We here introduce a specific bias in favor of rare class. As pointed out by [39] if a general bias is good for common cases, it is not appropriate for rare cases and may even cause rare cases to be totally ignored. These problems were also previously discussed by [40]. A final way to fight against the crushing effect of the majority rule is to generate a large diversity of situations by using a set of trees and to aggregate their results, i.e decision tree bagging [41]. IV. E XPERIMENTS We have empirically studied behaviors of decision tree algorithms using our proposed off-centered entropy [24] to classify imbalanced data sets. We are also interested in the comparison of performances with state-of-the-art entropies including Shannon’s entropy [27] and asymmetric entropy [26]. Due to the evaluation we have added the off-centered
and asymmetric entropies to the publicly available decision tree algorithm, C4.5 [30]. The experimental setup used the twenty five data sets described in Table I including seventeen first ones from the UCI repository [42], six next ones from the Statlog repository [43], an another one from the DELVE repository (http://www.cs.toronto.edu/∼delve/) and a last one from [44]. In order to evaluate performances for classification tasks of imbalanced data sets, we pre-processed multi-class (more than two classes) data sets as two-class problems. The columns 5 and 6 in table I show how we convert multiclass to minority and majority classes, for example with the OpticDigits data set, the digit ”0” is mapped to the minority class (Class min: 10%) and the remaining data are considered as the majority class (Class maj: 90%). We will denote by (***) significant result at 1/1000 level, (**) at 1/100, (*) at 5/100 and (0 ) when results are not significant. TABLE I DATA BASES n◦ 1 2 3 4 5 6 7 8 9 10 11 12 13 14 15 16 17 18 19 20 21 22 23 24 25
Base Opticdigits Tictactoe Wine Adult 20-newsgrp Breast Letters Yeast Connect-4 Glass Spambase Ecoli Abalone Pendigits Car Bupa Page blocks Pima German Shuttle Segment Satimage Vehicle Splice ALL-AML
Nb. cases 5620 958 178 48842 20000 569 20000 1484 67557 214 4601 336 4177 10992 1728 345 5473 768 1000 58000 2310 6435 846 3190 72
Nb. dim 64 9 13 14 500 30 16 8 42 9 57 7 8 16 6 6 10 8 20 9 19 36 18 60 7129
Class min 10%(0) 35%(1) 27%(3) 24%(1) 5%(1) 35%(M) 4%(A) 31%(CYT) 10%(draw) 33%(1) 40%(spam) 15%(pp) 9%(15-29) 10%(9) 8%(g, vg) 42%(1) 10%(rest) 35%(1) 30%(1) 20%(rest) 14%(1) 24%(1) 24%(van) 25%(EI) 35% (AML)
Class maj 90%(rest) 65%(2) 73%(rest) 76%(2) 95%(rest) 65%(B) 96%(rest) 69%(rest) 90%(rest) 67%(rest) 60%(rest) 85%(rest) 91%(rest) 90%(rest) 92%(rest) 58%(2) 90%(text) 65%(2) 70%(2) 80%(1) 86%(rest) 90%(rest) 76%(rest) 75%(rest) 65%(ALL)
Validation trn-tst 10-fold loo trn-tst 3-fold 10-fold 3-fold 10-fold 3-fold loo 10-fold 10-fold 10-fold trn-tst 10-fold 10-fold 10-fold 10-fold 10-fold trn-tst 10-fold trn-tst 10-fold 10-fold loo
TABLE II OCE VS . SE WITHOUT BAGGING
avg. std. dev. Student ratio p-value OCE
= SE
p-value
TS -7.28 26.55 -1.37 0.1831 6 4 15 0.0784
Acc 0.76 1.91 2.00 0.0574 21 1 3 0.0003
Amin 1.98 2.13 4.65 0.0001 23 1 1 0.0000
Amaj 0.58 2.32 1.26 0.2215 12 5 8 0.5034
TABLE III AE VS . SE WITHOUT BAGGING
avg. std. dev. Student ratio p-value AE
= SE
p-value
TS 0.44 31.81 0.07 0.945 12 2 11 1.000
Acc 0.34 0.89 1.92 0.067 18 1 6 0.023
Amin 1.44 1.87 3.85 0.001 20 1 4 0.002
Amaj 0.29 1.84 0.79 0.436 10 6 9 1.000
(***). Amaj is not significantly improved (0.58), but the global accuracy Acc is improved 21 times out of 25, against 3 decrease and 1 tie (***), while the average corresponding gain is equal to 0.76. Moreover, the trees provided by the offcentered entropy are often of a more reduced size, without this reduction being significant. The asymmetric entropy gives results slightly less significant when compared to Shannon entropy. It improves Amin 20 times out of 25 (***), with an average gain close to 1.44 (***). However, the improvement of Amaj is only of 0.29, which is not significant. Furthermore, Amaj is improved only 10 times out of 25, with 6 ties. As a result, the small increase of Acc (0.34) is not entirely significant (p-value = 0.067), corresponding to 18 wins out of 25 and 1 tie (*). There is no significant difference for the size of the tree. If the two non centered entropies OCE and AE are compared, one can observe a slight but not significant superiority of OCE for each criterion, in particular a gain of 0.54 for Amin, and 0.42 for Acc.
A. Comparison of the three entropies two by two, using majority rule For this first comparison published in [25], the majority rule is applied. The results of the different entropies are compared in terms of the length of the produced tree, of error rate on the minority class and the majority class, as well as the global error rate (tables II, III, IV). The main result of the carried out experiments is that our strategy of adaptive learning, using the non-centered entropies, particularly the off-centered entropy, outperform the Shannon entropy. These both entropies significantly improve Amin, the minority class accuracy, without penalizing Amaj, the majority class accuracy and TS, the tree size. Indeed, facing the Shannon entropy (SE), the off-centered entropy (OCE) improves Amin 23 times out of 25, with 1 defeat and 1 tie, which corresponds to a p-value of 0.000. The corresponding average gain is 1.98 points of percent
TABLE IV OCE VS . AE WITHOUT BAGGING
avg. std. dev. Student ratio p-value OCE
= AE
p-value
TS -7.72 21.91 -1.76 0.0908 9 6 10 1.0000
Acc 0.42 1.56 1.34 0.1917 14 5 6 0.1153
Amin 0.54 2.18 1.25 0.2243 13 3 9 0.5235
Amaj 0.29 1.92 0.76 0.4551 12 4 9 0.6636
B. Comparison of the different entropies two by two using majority decision rule and bagged decision trees In the second run of experimentations, bagged decision trees are performed, using each of the three entropies,
TABLE V
TABLE VIII MR FOR SE
OCE VS . SE WITH BAGGING
avg. std. dev. Student ratio p-value OCE
= SE
p-value
Acc 0.75 1.22 3.11 0.0048 23 2 0 0.0000
Amin 1.47 1.58 4.66 0.0001 21 2 2 0.0001
K -NN- RULE VS .
Amaj 0.65 2.93 1.11 0.2786 17 2 6 0.0347
TABLE VI
SE
avg. std. dev. Student ratio p-value result k-NN-rule wins = MR wins p-value (sign test) result
Acc -0,10 1,08 -0,46 0,648 lost 14 1 10 0,541 gain
Amin 1,66 2,83 2,94 0,007 gain 19 0 6 0,015 gain
Amaj -0,48 1,74 -1,38 0,180 lost 9 2 14 0,405 lost
AE VS . SE WITH BAGGING
avg. std. dev. Student ratio p-value AE
= SE
p-value
Acc 0.39 0.79 2.45 0.0218 16 4 5 0.027
Amin 0.51 1.59 1.61 0.1214 14 3 8 0.286
Amaj 0.50 1.58 1.59 0.1249 13 4 8 0.383
associated with the majority rule. The corresponding results are synthesized in tables V, VI and VII. In comparison with SE, improvements due to OCE are very highly significant, both for the frequency of improvement in the accuracy and the gain precision. Accuracy has been increased 21 times against 2 (***) on the minority class, 17 times (*) against 6 on the majority class and 23 times (***) against 0 globally. The average gain is 0.65 for Amaj (0 ), 1.47 for Amin (***), and 0.75 for Acc (**). The superiority of AE against SE is slightly modified. For Amin, the average gain of AE compared to SE is no more significant with bagging, only 0.51 instead of 1.44 without bagging. On the other hand, the average gain for Amaj is slightly increased (0.50 instead of 0.29) while the gain for Acc (0.44 instead 0.39) becomes significant (*). The superiority of OCE against AE becomes significant for both Amin and Acc. Compared with AE, OCE improves Amin 16 times against 5 (*), with an average gain of 0.96 (**). By the same way, OCE improves Acc 17 times against 3 (**), with an average gain of 0.37 (*).
TABLE IX K -NN- RULE VS . OCE
avg. std. dev. Student ratio p-value result k-NN-rule wins = MR wins p-value (sign test) result
TABLE VII
avg. std. dev. Student ratio p-value OCE
= AE
p-value
Acc 0.37 0.72 2.55 0.0174 17 5 3 0.0026
Amin 0.96 1.47 3.26 0.0033 16 4 5 0.0266
Amaj 0.15 1.68 0.44 0.6625 11 6 8 0.6476
C. Comparison of the k-NN-rule with the majority rule, for each entropy For each entropy, we examine whether the k-NN-rule (k = 3 in our experiments) gives better results than the majority
Amin 1,05 3,81 1,38 0,181 gain 18 0 7 0,043 gain
Amaj -0,52 1,71 -1,54 0,137 lost 8 2 15 0,210 lost
rule (tables VIII, IX and X). Generally speaking, whatever the entropy, the use of local rule significantly increases the value of Amin, but slightly reduces the values of Amaj and Acc. More specifically, in the case of Shannon entropy, the average gain on Amin due to k-NN-rule is 1.7 (**) corresponding to 19 wins against 6 defeats (*). The drops in Amaj (0.5) and Acc (0.1) are not significant. Regarding OCE , the average gain on Amin (1.1) was not significant, but the k-NN-rule prevailed 18 times out of 25, which was significant (*). For AE, the average gain on Amin (1.1) was not entirely significant, but drops in Amaj (0.8) and Acc (0.3) owed to the k-NN-rule are significant.
TABLE X MR FOR AE
K -NN- RULE VS . AE
OCE VS . AE WITH BAGGING
MR FOR OCE
Acc -0,25 0,73 -1,74 0,094 lost 12 0 13 1,000 lost
avg. std. dev. Student ratio p-value result k-NN-rule wins = MR wins p-value (sign test) result
Acc -0,32 0,70 -2,26 0,033 lost 12 0 13 1,000 lost
Amin 1,10 3,18 1,74 0,095 gain 16 2 7 0,093 gain
Amaj -0,78 1,52 -2,56 0,017 lost 7 2 16 0,093 lost
D. Comparison of the different entropies two by two, when using local rule In this new series of experiments, we compare two by two the results obtained with the three entropies, when using the k-NN-rule (tables XI, XII and XIII). The best outcome
TABLE XI
10
OCE VS . SE WITH K -NN- RULE
avg. std. dev. Student ratio p-value result OCE wins = SE wins p-value (sign test) result
Acc 0,61 0,93 3,25 0,003 gain 21 3 1 0,000 gain
Amin 1,37 2,37 2,88 0,008 gain 18 5 2 0,000 gain
Amaj 0,54 1,84 1,46 0,158 gain 13 7 5 0,096 gain
Differences on Amin
OCE - SE
4
8
avg. std. dev. Student ratio p-value result AE wins = SE wins p-value (sign test) result
Amin 0.88 2,33 1,88 0,072 gain 16 5 4 0,012 gain
+
+ +4 4
4
+
4 4+ +
2 0
4 +
+ 4
4 +
+ 4
4
4 +
4 +
4
+ 4 + +44 + 4 4 +
4 +
20
25
+ -2
+
4
-4
+ +
-6
AE-k-NN-rule OCE -k-NN-rule
+ 4
4
-8 5
10
15 Datasets
TABLE XII AE VS . SE WITH K -NN- RULE Acc 0.13 1,03 0,61 0,549 gain 15 4 6 0,078 gain
44
+ + 4 +
6
0
AE- SE
4
Fig. 2. Amaj -0.01 1,29 -0,04 0,972 lost 11 5 9 0,824 gain
TABLE XIII
Gain of OCE/k-NN-rule and AE/k-NN-rule against SE/MR
TABLE XIV N ON - CENTERED ENTROPIES WITH K -NN- RULE VS . SE WITH MR AE/k-NN-rule
avg. gain std. dev. Student ratio p-value result AE / OCE (k-NN-rule) wins = SE (MR) wins p-value (sign test) result
Acc 0,03 1,01 0,13 0,900 gain 17 0 8 0,108 gain
Amin 2,54 3,46 3,67 0,001 gain 21 0 4 0,001 gain
vs.
SE /MR
Amaj -0,49 2,25 -1,09 0,288 lost 9 2 14 0,405 gain
OCE/k-NN-rule
vs.
Acc 0,51 1,74 1,45 0,159 gain 19 0 6 0,015 gain
Amaj 0,06 ,08 0,09 0,926 gain 10 2 13 0,678 gain
Amin 3,03 4,05 3,74 0,001 gain 23 0 2 0,000 gain
SE /MR
OCE VS . AE WITH K -NN- RULE OCE - AE avg. std. dev. Student ratio p-value result OCE wins = AE wins p-value (sign test) result
Acc 0,48 1,53 1,57 0,129 gain 13 4 8 0,383 gain
Amin 0,49 1,95 1,26 0,219 gain 14 3 8 0,286 gain
Amaj 0,55 1,84 1,48 0,151 gain 12 7 6 0,238 gain
is clearly that achieved by OCE. In fact, OCE significantly surpasses SE, increasing on average of 1.4 point for Amin (**), 0.5 for Amaj (0 ) and 0.6 for Acc (**). The sign test confirms the significance of this superiority, since OCE is defeated by SE only 2 times out of 25 for Amin (***), and 1 time out of 25 for Acc (***). The comparison of OCE with AE shows that empirically OCE has better results than AE, but improvements are too small to be significant. AE also prevails on SE, though giving less significant results than OCE. The sole significant result concerns Amin. AE gets the better of SE 16 times out of 25 (**), but the average improvement on Amin (0.9) is not significant. The changes in Amaj and Acc are very small. E. Comparison of OCE and AE using k-NN-rule with SE using the majority rule The last type of experiments compares the results obtained when using usual strategy (SE + MR) with those issued from the proposed adaptive learning strategy (OCE or AE) associated with k-NN-rule. Figure 2 illustrates the gain of accuracy on Amin for each data base when using AE or OCE with k-NN-rule instead of SE with MR. From results
presented in Table XIV it is clear that the proposed adaptive learning strategy associated with the k-NN-rule outperforms very significantly the usual strategy. The most conclusive results are obtained with OCE. Indeed, using OCE and the k-NN-rule, the average gain in Amin is equal to 3,0 percent points (***), corresponding to 23 wins and 2 defeats (***), while maintaining Amaj, which gives an average improvement of 0.5 for Acc, corresponding to 19 wins against 6 defeats (**). Using AE in association with the k-NN-rule, also improves the results of the usual strategy. In average, the increase on Amin worth 2.5 (***), corresponding to 21 wins against 4 defeats (***), but the overall accuracy is not improved, as there is a loss of about 0.5 on Amaj. V. C ONCLUSION Standard decision trees like C4.5 perform poorly on imbalanced data sets. To settle this problem, solutions can be proposed at different levels: resampling methods, split function, pruning-scheme, labeling rule. Previously, we defined an off centered entropy named OCE, which takes its maximum value for the a priori distribution of the class in the considered node. Others authors have proposed an asymmetrical entropy AE which has the same property. In this paper we suggest and test two propositions at the labeling level. The first one consists in using bagged decision trees while the second one lies in the individualization of the labeling rule inside each leaf. The class assigned to an individual is the majority class among the k nearest neighbors of the considered individual inside the leaf (k-NN-rule). We then present several experiments regarding the different strategies that we could apply. The experiments show that
in case of bagging, our off-centered entropy OCE outperforms very significantly Shannon entropy SE (Amin, Amaj and Acc are all the three very significantly increased (respectively 1.5, 0.7 and 0.8 points of percent). The comparison of our strategy (OCE + k-NN-rule) with the usual strategy (SE + majority rule) is in favor of (OCE + k-NN-rule). The experiments show that the average gain is 3.0 for Amin and 0.5 for Acc. Using AE in place of OCE leads to similar result but slightly less significant. Overall, these results show the relevance of the adaptive learning strategy that we propose to deal with imbalanced data sets when performing decision trees. In the future, we intend to experiment other labeling rules. Furthermore, we want associate to our strategy a pruning procedure well suited to imbalanced data sets. In addition the use of measures which synthesize both the minority and majority class performance like the area under the ROC curve or the F-measure should be considered. R EFERENCES [1] Q. Yang and X. Wu, “10 challenging problems in data mining research,” International Journal of Information Technology & Decision Making, vol. 5, no. 4, pp. 597–604, 2006. [2] N. Japkowicz, Ed., AAAI’Workshop on Learning from Imbalanced Data Sets, ser. AAAI Tech Report, no. WS-00-05, 2000. [3] N. Chawla, N. Japkowicz, and A. Kolcz, Eds., ICML’Workshop on Learning from Imbalanced Data Sets, 2003. [4] ——, Special Issue on Class Imbalances, ser. SIGKDD Explorations, vol. 6, 2004. [5] N. Japkowicz, “The class imbalance problem: Significance and strategies,” in International Conference on Artificial Intelligence, vol. 1, 2000, pp. 111–117. [6] N. Japkowicz and S. Stephen, “The class imbalance problem: A systematic study,” Intelligent Data Analysis, vol. 6, no. 5, pp. 429– 450, 2002. [7] S. Visa and A. Ralescu, “Issues in mining imbalanced data sets - A review paper,” in Midwest Artificial Intelligence and Cognitive Science Conf., Dayton, USA, 2005, pp. 67–73. [8] G. M. Weiss and F. Provost, “The effect of class distribution on classifier learning,” TR ML-TR 43, Department of Computer Science, Rutgers University, 2001. [9] ——, “Learning when training data are costly: The effect of class distribution on tree induction,” J. of Artificial Intelligence Research, vol. 19, pp. 315–354, 2003. [10] A. Liu, J. Ghosh, and C. Martin, “Generative oversampling for mining imbalanced datasets,” in International Conference on Data Mining, R. Stahlbock, S. F. Crone, and S. Lessmann, Eds. Las Vegas, Nevada, USA: CSREA Press, 2007, pp. 66–72. [11] M. Kubat and S. Matwin, “Addressing the curse of imbalanced data sets: One-sided sampling,” in International Conference on Machine Learning, 1997, pp. 179–186. [12] X.-Y. Liu, J. Wu, and Z.-H. Zhou, “Exploratory under-sampling for class-imbalance learning,” in IEEE International Conference on Data Mining. Hong Kong, China: IEEE Computer Society, 2006, pp. 965– 969. [13] J. Van Hulse, T. M. Khoshgoftaar, and A. Napolitano, “Experimental perspectives on learning from imbalanced data,” in International Conference on Machine Learning, 2007, pp. 935–942. [14] P. Domingos, “Metacost: A general method for making classifiers cost sensitive,” in Int. Conf. on Knowledge Discovery and Data Mining, 1999, pp. 155–164. [15] Z.-H. Zhou and X.-Y. Liu, “On multi-class cost-sensitive learning,” in 21st National Conference on Artificial Intelligence, Boston, MA, USA, 2006, pp. 567–572. [16] X.-Y. Liu and Z.-H. Zhou, “The influence of class imbalance on costsensitive learning: An empirical study,” in 6th IEEE International Conference on Data Mining. Hong Kong, China: IEEE Computer Society, 2006, pp. 970–974.
[17] G. M. Weiss, K. McCarthy, and B. Zabar, “Cost-sensitive learning vs. sampling: Which is best for handling unbalanced classes with unequal error costs?” in International Conference on Data Mining, R. Stahlbock, S. F. Crone, and S. Lessmann, Eds. Las Vegas, Nevada, USA: CSREA Press, 2007, pp. 35–41. [18] J. R. Quinlan, C4.5: Programs for Machine Learning. San Mateo, CA: Morgan Kaufmann, 1993. [19] C. Drummond and R. Holte, “C4.5, class imbalance, and cost sensitivity: Why under-sampling beats over-sampling,” in ICML’Workshop on Learning from Imbalanced Data Sets, 2003. [20] C. X. Ling, Q. Yang, J. Wang, and S. Zhang, “Decision trees with minimal costs,” in International Conference on Machine Learning, Banff, Canada, 2004. [21] J. Du, Z. Cai, and C. X. Ling, “Cost-sensitive decision trees with pre-pruning,” in Canadian Conference on Artificial Intelligence, ser. LNAI, Z. Kobti and D. Wu, Eds., vol. 4509. Springer-Verlag Berlin Heidelberg, 2007, pp. 171–179. [22] C. Elkan, “The foundations of cost-sensitive learning,” in International Joint Conference on Artificial Intelligence, B. Nebel, Ed. Seattle, WA, USA: Morgan Kaufmann, 2001, pp. 973–978. [23] N. Chawla, “C4.5 and imbalanced datasets: Investigating the effect of sampling method, probalistic estimate, and decision tree structure,” in ICML’Workshop on Learning from Imbalanced Data Sets, 2003. [24] S. Lallich, P. Lenca, and B. Vaillant, “Construction of an off-centered entropy for supervised learning,” in ASMDA, 2007, 8 p. [25] P. Lenca, S. Lallich, T.-N. Do, and N.-K. Pham, “A comparison of different off-centered entropies to deal with class imbalance for decision trees,” in Pacific-Asia Conference on Knowledge Discovery and Data Mining, Osaka, Japan, 2008. [26] S. Marcellin, D. A. Zighed, and G. Ritschard, “An asymmetric entropy measure for decision trees,” in IPMU, 2006, pp. 1292–1299. [27] C. E. Shannon, “A mathematical theory of communication,” Bell System Technological Journal, no. 27, pp. 379–423, 623–656, July and October 1948. [28] D. A. Zighed and R. Rakotomalala, Graphes d’Induction – Apprentissage et Data Mining. Hermes, 2000. [29] J. R. Quinlan, “Induction of decision trees,” Machine Learning, vol. 1, no. 1, pp. 81–106, 1986. [30] ——, C4.5: Programs for Machine Learning. Morgan Kaufmann, 1993. [31] L. Wehenkel, “On uncertainty measures used for decision tree induction,” in IPMU, 1996, pp. 413–418. [32] W.-Y. Loh and Y.-S. Shih, “Split selection methods for classification trees,” Statistica Sinica, vol. 7, pp. 815–840, 1997. [33] S. Lallich, B. Vaillant, and P. Lenca, “Parametrised measures for the evaluation of association rule interestingness,” in ASMDA, 2005, pp. 220–229. [34] ——, “A probabilistic framework towards the parameterization of association rule interestingness measures,” Methodology and Computing in Applied Probability, vol. 9, pp. 447–463, 2007. [35] ——, “Construction d’une entropie d´ecentr´ee pour l’apprentissage supervis´e,” in QDC/EGC 2007, 2007, pp. 45–54. [36] D. A. Zighed, S. Marcellin, and G. Ritschard, “Mesure d’entropie asym´etrique et consistante,” in EGC, 2007, pp. 81–86. [37] G. Ritschard, D. A. Zighed, and S. Marcellin, “Donn´ees d´es´equilibr´ees, entropie d´ecentr´ee et indice dimplication,” in Rencontres Internationales Analyse Statistique Implicative, Castell´on, Spain, 2007, pp. 315–327. [38] L. A. Goodman and W. H. Kruskal, “Measures of association for cross classifications, i,” JASA, vol. I, no. 49, pp. 732–764, 1954. [39] G. M. Weiss, “Mining with rarity: A unifying framework,” SIGKDD Explorations, vol. 6, no. 1, pp. 7–19, 2004. [40] R. C. Holte, L. Acker, and B. W. Porter, “Concept learning and the problem of small disjuncts,” in International Joint Conference on Artificial Intelligence. Detroit, MI, USA: Morgan Kaufmann, 1989, pp. 813–818. [41] L. Breiman, “Bagging predictors,” Machine Learning, vol. 24, no. 2, pp. 123–140, 1996. [42] C. L. Blake and C. J. Merz, “UCI repository of machine learning databases,” 1998. [43] D. Michie, D. J. Spiegelhalter, and C. C. Taylor, Eds., Machine Learning, Neural and Statistical Classification. Ellis Horwood, 1994. [44] L. Jinyan and L. Huiqing, “Kent ridge bio-medical data set repository,” Tech. Rep., 2002.