7/2/2003
Using Maps and Landmarks for Navigation between Closed and Open Corpus Hyperspace in Web-based Education Peter Brusilovsky School of Information Sciences, University of Pittsburgh N. Bellefield St., Pittsburgh PA 15260, USA Phone: +1 412 624 9404 Fax: +1 412 624 2788
[email protected]
Riccardo Rizzo Institute for Educational and Training Technologies Italian National Research Council via Ugo La Malfa 153,90146 Palermo, Italy Phone: +39 (091) 6809207
[email protected]
Abstract: This paper focuses on the problem of building links from closed to open corpus Web pages in the context of Web-based education. As a possible solution it introduces landmark-based navigation using semantic information space maps - an approach that we are currently investigating. The technical part of the paper presents a system Knowledge Sea that implements this approach, describes the mechanism behind the system, and reports some results of a classroom evaluation of this system.
Keywords: Open corpus, closed corpus, Web-based education, courseware, hypertext map, SOM, artificial neural network, landmark, mediated navigation.
1 Introduction: The Challenge of the Open Corpus Hyperspace The Web becoming a de-facto standard platform for providing various kinds of educational material to support teaching in a university or a technical training company. One of the greatest benefits of the Web is that the course material created to support a specific course no longer remains the only educational material that the students can use during the course (as it used to be at the time of “standalone” and CD ROM-based course materials). For almost any subject area a large variety of relevant educational material can now be found on the Web. This material ranges from free tutorials on different subjects to case studies to simulations and animations. Unlike well-structured homogeneous closed corpus course material, the open corpus Web material is very heterogeneous and never structured to meet the needs of a particular course. The challenge the “Web age” courseware authors is to let the students of their courses to benefit from the availability of open corpus material by building “bridges” from closed to open corpus material. Unfortunately, modern courseware authoring tools such as provided by Blackboard (1), WebCT (20) and other courseware management systems offer little support for including open corpus educational material into the course content. The only function that is supported by the majority of modern courseware management systems is the ability to create a named link from a specific node in the closed corpus hyperspace (usually known as “External links” page) to most relevant points in the open corpus hyperspace. This can hardly be considered as an adequate level of support and we had a very good chance to learn it ourselves. While creating Web-based course material for a course on Programming and Data Structures based on C programming language we put special efforts on bringing free high-quality Web open corpus
1 of 16
7/2/2003
material closer to the students. We have found about 10 good C language tutorials on the Web – all of them well organized as hierarchical “hyper-textbooks”. Different tutorials used different presentation styles and championed different aspects of the course. It was quite clear for us that these free tutorials provide an excellent complement for the rather expensive course C book, often presenting some features of the language better than the book or in a way more suitable for some subclass of the students. Using Blackboard “external links” tool, we have provided links to the root nodes of all these tutorials from one of the top pages in our hypertextual learning material. These tutorials were also recommended several times during the lectures. To see which tutorial the students most often visited we used an option to trace the usage of the links to the tutorials provided by Blackboard system. To our greatest surprise, an analysis of user navigation logs provided by Blackboard showed a stunning thing – the users were not using these tutorials at all. Indeed, the free tutorials included very helpful information, but the path to this information in the hyperspace is clearly too complicated for the students. For example, a student who was not completely happy with our learning material on while loops may benefit from a different presentation of this concept in one of the Web tutorials. To get to the right page, the user need to navigate from the current page to the page with roots of all tutorials (a few clicks), then descend down the tutorial hierarchy (a few more clicks and some tough decisions to make in choosing the proper link). To check helpful pages in several tutorials, this process has to be repeated several times. None of the students in our class was able or willing to do it. This discovery provided a motivation and a research challenge for the work presented in this paper. Our goal was to provide a better bridge from closed corpus to open corpus educational material than is offered by existing Web-based educational systems. We wanted to make the path from a close corpus page to relevant open corpus pages as short as possible while avoiding manual linking. It was clear that manual linking approaches could hardly help a single teacher to provide links to hundreds of relevant open corpus pages. In our earlier work (5; 18) we have explored several ways of non-manual linking in the context of educational hypertext. Our paper (4) provides a comprehensive analysis of existing linking approaches such as dynamic linking, automated linking, similarity-based navigation, and concept-based navigation and suggests a new map-based navigation approach. A map-based approach provides the power of mediated navigation similarly to concept-based navigation (5) while excluding manual authoring as in automatic linking (18). While working on the map-based approach, we have explored the use of landmarks in map-based navigation and realized that the proper use of landmarks in the context of information maps can provide a good solution to the problem of supporting closed to open corpus navigation. This paper investigates the use of information maps and landmarks to bridge the gap between closed and open corpus educational hypermedia. We start with examining a real world scenario of solving navigation problems using maps and landmarks. This scenario served as a motivation for our work. The core part of the paper presents the Knowledge Sea system that implements landmark-based navigation an approach to support closed to open corpus navigation that we have developed. After that, we describe briefly the mechanism behind this approach. At the end we analyze results of a classroom study of Knowledge Sea system and discuss similar and future work.
2 Bridging the Gap Between Closed and Open Corpus Hyperspace Using Maps and Landmarks The situation of navigation from known to unknown objects is not completely unique for Web-based education. It occurs quite often in a real world. Imagine the following scenario. You have one free day after a conference in London. Your plan is to spend several hours in one of the famous London art museums, have a nice lunch, and then embark on a double-decker bus tour. As an art lover, you know several London’s art museums and have probably already chosen the one to visit. The problem now is to locate a reasonable restaurant nearby. What kind of navigation tools you will use if you are not familiar with local restaurants? A typical tool that you can find in a number of guidebooks is a long list of restaurants with addresses and brief descriptions. The best guidebooks will have this list hierarchically organized by the kind of food and by city area and even extended with some additional “metadata” (price range, rating). However, even the best guidebook alone is not a very good navigation tool for
2 of 16
7/2/2003
your task because it is hard for a casual visitor to figure out how close to a museum of your choice each listed restaurant is located. The proper tool is a typical tourist map where famous museums and other objects of interests are shown as iconic landmarks and restaurants are shown as numbered bullets of some shape and color. These numbers corresponds to restaurant names provided on the back of the map or in a separate booklet. Since the map places museums and restaurants in the same 2-dimensional space, it is very easy to find 4-5 restaurants that are located close to the museum, check their descriptions in the guidebook, and make a choice. Moreover, if you will find two equally attractive places to eat, you may use a map to choose one that is located on the way to your next destination - the nearest stop of a double-decker tour bus (these stops are probably also shown as landmarks on your map). In more general terms, in this example, you were able to navigate successfully from a known closed corpus object (museum) to a relevant “nearby” object from an unknown open corpus group (restaurants). Instead of using a hierarchical navigational structure (guidebook) to examine open corpus objects one by one, you have used a 2-dimensional map. The map naturally placed geographically close open and closed corpus objects together and provided additional navigation support by showing closed corpus objects as landmarks. The “London” scenario provides a good metaphor for our key idea of connecting closed corpus educational material with open corpus material using maps and landmarks. It is quite common in Information Science to consider documents as objects in information space where spatial distance between objects represents their semantic similarity. In this information space, known closed corpus objects (for example, handouts for different lectures) are similar to art museums in the London scenario. They work as landmarks and serve as starting points for navigation. Unknown open corpus pages (such as multiple tutorial pages from external sites) are similar to restaurants and serve as targets of navigation. The goal is also similar – find tutorial pages that are semantically close to a particular lecture. While in each particular tutorial the pages are typically organized in a navigational hierarchy, this organization is no more helpful for locating relevant tutorial pages than the listing of restaurants is helpful in the London scenario for locating a nearby restaurant. What can really help; is a 2dimensional semantic map of the information space that places lecture handouts and tutorial pages on the same plane so that semantically similar objects are located close to each other. With the help of the map and lecture landmarks, tutorial pages similar to the selected lecture can be located almost instantly. The key idea of our work presented in this paper to apply a navigation approach that human use so successfully in real world spatial navigation to the case of closed to open corpus information space navigation. We attempted to replace an inefficient “list-based” navigation with a landmark-based navigation using a 2-dimensional semantic map of the information space. The key challenge for implementing this idea was to find a technology that can create a 2-dimensional spatial map of information space placing similar documents close to each other on a map. This technology should be able to process at least several thousands of open and closed corpus documents relatively fast with minimal or no manual processing of the open corpus documents. Two relevant technologies that are most popular in Information Retrieval are spring-embedding visualization (10) and self-organized maps (11), however, none of them provides a perfect solution. The former has problems with processing large number of documents and the latter has lower precision since it can only produce grid-level maps. For our work we have selected the self-organized maps (SOM) technology since the ability to process large number of documents was more important than precision. In addition, we already had a positive experience with this technology. SOM is a system where simple processing units (the neurons) are organized in a lattice. The SOM "learns" how to organize a set of documents during the so-called learning stage and then it is ready to automatically sort any number new documents. In our Knowledge Sea system introduced in the next section, the SOM was trained using pages from three C tutorials and then used to automatically place the landmarks (closed corpus documents) and pages from the remaining tutorials (open corpus documents) on the map.
3 Navigating the Knowledge Sea Knowledge Sea is a system that implements landmark-based navigation approach in a mixed corpus educational hypermedia using semantic maps. Mixed corpus educational hypermedia includes some traditional closed corpus educational hypermedia material that was specially designed for the needs of a particular course and large portions of an open corpus Web material that is relevant for the course, but
3 of 16
7/2/2003
was not designed for it. The challenge is to provide navigation links from closed corpus pages to relevant open corpus pages, as well as between different open corpus pages. We have investigated the problem in the context of creating a supportive Web resource for a typical university class on C programming. In this context, the most often used closed corpus Web-based resource is simply a set of lecture slides – one stack for every lecture. The most easily available open corpus resources are hypertextual C tutorials. As we have mentioned, hierarchical navigation in this context does not work: it was useless just to point the users to the roots of these tutorials. We have developed Knowledge Sea system to help the user to navigate from lectures to relevant tutorial pages and between them.
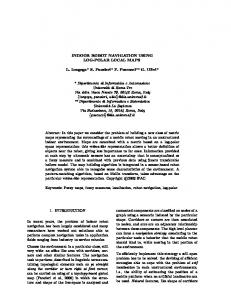
Figure 1: Components of the Knowledge Sea interface. From the semantic map (top) the user could navigate to a landmark object (lecture slides, bottom right) or choose to explore non-landmark objects located in a particular cell (list of links to relevant tutorial pages, bottom left). The core of the Knowledge Sea is a two-dimensional semantic map of educational resources (Figure 1, top). Each cell of the map hosts a set of educational resources. As required by our landmark-based navigation approach, the map is organized in a way that resources that are semantically related are close to each other on the map. Resources located in the same cell are considered very similar. Resources located in directly connected cells are reasonably similar and so on. The map is built using a neural network technology described in the next section. Each cell displays a set of keywords describing the area covered by the cell and landmarks situated in this cell. Landmarks are shown as recognizable links to landmark objects. For the case of lecture-to-tutorial navigation, landmarks are lectures and a landmark link brings the user to the slides of the corresponding lecture (Figure 1, right). Following the case of real maps, non-landmark resources are not explicitly shown on the map, but their presence in the cell is clearly indicated. On real maps these resources are shown as properly
4 of 16
7/2/2003
positioned bullets with “links” (i.e., numbers) to their description usually provided on the back of the map. This way allows the user to see the presence of objects in a particular area, their density, and relative position in the area. For maps built with SOM we can’t use the same approach because SOM does not position a resource within a cell. Still, we wanted to show the presence and the density of objects in the area of each cell. To show a presence of non-landmark resources in the cell, the map shows a red bullet on the cell surface. To show the density of open corpus resources in the cell, we use a different metaphor also borrowed from “real world” maps. Geographic maps commonly show the depth of the ocean in a particular point (i.e., the amount of water under the ocean surface) by using several shades of blue. Following this metaphor, we treat the number of resource pages lying "under" the cell as the "depth of the information sea" at this point and use four shades of blue to show it. The cell with minimum number Rmin of resources is shown in the lightest blue color. The cell with maximum number Rmax of resources is shown in the darkest blue color. For the rest of the cells, the interval between Rmin and Rmax is split into 4 subintervals and one of the four shades of blue is selected according to the interval the number of resources in the call falls in. The resulting map represents a variable depth of the information sea in different areas of the map. To promote the “sea” metaphor, we named the system Knowledge Sea.
Figure 2: The Knowledge Sea map serves as a mediator to help the user navigate from recognizable closed corpus resources to similar open corpus resources. The whole set of resources "under" the cell can be observed by zooming in (we call it "diving"). A click on the red dot opens a cell content window (bottom left on Figure 1) that provides a list of links to all resources (tutorial pages) located in this cell. A click on any of these links will open a resourcebrowsing window with the selected relevant tutorial page. This page is loaded "as is" from its original URL. It is visualized in another window in order to allow the user to navigate within the tutorial and easily go back to the map. A user can browse this page and use it as a starting point to navigate area of interest in the tutorial. The map serves as a mediator to help the user navigate from recognizable closed corpus resources to similar open corpus resources (Figure 2) in a way that is quite similar to our real life London scenario.
5 of 16
7/2/2003
Imagine, for example, that the user is interested to find some additional information on the topic of lecture 14 (devoted to pointers). On the semantic map this material should be located close to the area indicated by the lecture 14 landmark. The first place to look is the “close neighborhood”: the cell where the landmark is located. Additional material can be found in the nearby cells. Moreover, topological features of our semantic map can help the user to find material that can enhance the topic of the lecture in some particular direction: the cells that are close to the original cell provide several possible directions to deviate. For example the material related to memory usage in the context of pointers is located underneath of the cell with L14 mark. The links to other critical resources shown on the map can help to select the right direction for deviation. For example, a good place to look for a material that can connect the content of lectures 14 and 16 (devoted to structures) is a cell between cells where L14 and L16 landmarks are shown. This is very similar to the case of selecting a restaurant on the way from the visited museum to the nearest stop of the tour bus. This is a strong benefit of a mediated navigation with a map that preserves the topology of the mapped space (both geographic maps and SOM maps preserve the topology). Instead of navigating from one page directly to another page, the user moves from a page to a mediator – the semantic map – that helps the user to select the page related to the original in the “right” sense (Figure 2). We expect that our semantic map can help the user to navigate as any regular map, enabling the user to involve spatial orientation and visual memory. On the surface of the map, the keywords work as legend and the links to recognizable closed corpus resources work as landmarks providing both orientation support and navigation support. Together, keywords, landmarks, and resource indicators give an idea of the material organized by the map and help the user to locate the relevant area of the map. To better accommodate to different information needs of the users (i.e., understanding of the information space organization or search for a particular resource) we have provided several versions of information space maps that differ in the level of details. The version shown on Figure 1 is the most concise and the smallest one: only two keywords of each cell is shown and only the lecture number identifies the link to lecture slides. The more detailed map contains six keywords and the number of the lecture, the most detailed shows five keywords and the full title of the lecture. This is also similar to the practice of real world map where the same area can be represented by an overview map that shows minimal legend and detailed maps that provide space to show all relevant legend, but are harder to “grasp”. Having maps of different levels of details also helps us to accommodate to computer platforms with different screen sizes. This also has a parallel with real world maps. An overview map can be easily shown on a page of the tour book, while detailed maps are usually printed on larger sheets of paper. In our case the most compact map can be used successfully on small handheld Hewlett-Packard Jornada organizers (3). The most detailed map can be browsed comfortably only on relatively large screens.
4 The Knowledge Sea Internal Mechanism The Knowledge Sea map that is shown on the background of Figure 1 is the final result of a set of processing steps that can be divided into three main phases. The first phase is necessary to obtain the document representations for all the documents in the open and the closed corpus. On the second phase the SOM neural network is trained and used to organize documents. On the third phase the interface of the system (i.e. the set of pages that are shown to the user) is generated. In the following sections these three phases are described in details. The first subsection explains the document representation, the second reports the mechanism of the SOM and its learning algorithm in details, the third describes the set of programs that were used to generate HTML pages to be presented to the user. This whole section is quite technical and is provided for the readers who are interested to learn all details about the technical side of the system. We recommend those who are interested in user interface aspects of the system to move directly to the user evaluation part presented in section 6.
6 of 16
7/2/2003
4.1 Document Representation To train the SOM neural network it is necessary to represent the inputs using a set of vectors. To obtain a corresponding vector for each document from each document set (the closed corpus and the open corpus) we applied the Vector Space Representation (VSR) (19). Using the VSR, each document is represented as a vector where each element (dimension) corresponds to a different word. The component value depends on the frequency of occurrence of the word in the document weighted by the frequency of occurrence in the whole set of documents. Assuming a set of keywords V={ti, i=1,2,..., n} used to represent the documents (i.e. a dictionary), each document dj in a document set D= {dj, j=1,2,..., m } can be represented as a vector vj where the element vi j is the weight of the word ti for that document. In the so-called TF*IDF representation these weights are calculated balancing two different aspects of the keywords frequency: the within-document term frequency f ij that indicates how many times the term ti appears in the document dj and the number of documents tdj that contain the keyword ti; The weight vij can be expressed by the following formula:
Ê mˆ vij = fij*logÁÁ 1 + ˜˜ tdi ¯ Ë The calculation of the TF*IDF representation often includes a normalization factor that is used to obtain a representation vector that is independent from the text length.
4.2 Self Organizing Maps Artificial neural networks are processing algorithms that are inspired by the mechanism of the brain cells and are constituted by a set of simple processing units (neurons) that work in parallel and exchange signals using a large number of weighted connections. Many artificial neural networks are used in a three-stage procedure. On the first learning stage, the network learns the characteristics of the input, e.g. for a clustering task the network extracts the common features of the input set, for a function approximation task the network learns the relation between input and desired output. On the second test stage, the outputs of the neural networks are checked using a set of test input-output couples in order to understand if the learning stage succeed. On the third working stage the neural network is ready to work. In a special form of artificial neural network known Self-Organizing Feature Map (SOM, sometimes referred as Kohonen map's) (11) neurons are organized in a lattice, usually a one or two-dimensional array, which is placed in the input space and is spanned over the input vectors distribution. Using a twodimensional SOM network it is possible to obtain a map of input space where closeness between units or clusters in the map represents closeness of the input vectors. Recently this network has been used to organize documents into "information maps". An information map is a two-dimensional representation of a document set. The documents on the map are grouped in clusters where similar documents either belong to the same cluster (cell) or to the clusters that are close to each other on the map. The SOM algorithm principle can be explained in an abstract system without reference to any biological structure. The algorithm defines a sort of elastic lattice of simple processing units that are organized in order to fit a set of input points in a high-dimensional input space and to approximate their density function. Each processing unit is associated with a “weight” vector that belongs to the same space as the input vectors. Using the weights of each processing unit as a set of coordinates the lattice can be positioned in the input space. During the learning stage the weights of the units change their position and "move" towards the input points, as shown in Figure 3. The amount of movement is modulated by a neighborhood function, a smoothing kernel defined over the lattice points. This "movement" becomes slower and at the end of the learning stage the network is "frozen" in the input space. After the learning stage, the inputs can be associated to the nearest network unit. The main application of the SOM is the visualization of high-dimensional data in a two-dimensional space, as well as the creation of abstractions like in many clustering techniques (12).
7 of 16
7/2/2003
Figure 3: A representation of the SOM learning algorithm. The gray area is the neighboring of the best matching unit that is defined by the neighborhood function Each unit of the SOM map identifies an area of the information space, a set of points in the vector space, and will group together all the documents that are represented with a vector that belongs to that area. An advantage of using the SOM map is that the structure created in the information space after the training stage can be reused to organize new information. If a new set of documents is submitted to the trained map it will organize the new information using its knowledge on the information domain. This creates a volatile link structure that depends on the information space, not on the set of documents and can continue to exist if all the documents are removed from the map. This characteristic allows us to develop a scalable system in which new information can be added and old one erased without loosing the spatial organization created. In the current version of Knowledge Sea the map was trained using a subset set of tutorials downloaded from the Internet. During the learning stage the map constructed its own representation of this space. After that several other tutorials and a set of text surrogates extracted from lecture slides were submitted to the map and classified according to the knowledge of the map. While original training of the map takes some reasonable time, new open corpus documents can be classified very fast.
4.3 User Interface Generation The user interface part of the Knowledge Sea system is currently implemented as a set of dynamic HTML pages with embedded JavaScript fragments. As shown on Figure 4, these pages are automatically generated by the following system components: • a set of Perl programs that preprocess the source documents and create the vector space representation for the learning phase of the SOM map; • the SOM program, the SOM-PAK simulator available over the Internet at http://www.cis.hut.fi/research/som-research/nnrc-programs.shtml • a Perl program that creates a set of HTML pages with embedded JavaScript fragments that constitutes the interface of the system In addition the suit of Knowledge Sea components includes a protocol logging server – a simple CGI script that receives information about user actions in Knowledge Sea in the form of structured HTTP GET messages and dumps then into a textual log file. Next section explains in more details how Knowledge Sea is able to log in individual traces for every user.
8 of 16
7/2/2003
Figure 4: The components of the Knowledge Sea system
4.4
Knowledge Sea as a Component of KnowledgeTree Learning Portal
Knowledge Sea was used in the context of the course not as an independent program, but as one of the navigation components of our KnowledgeTree learning portal. The goal of KnowledgeTree portal is to serve an integrator of all computerized student activities. KnowledgeTree portal allows a teacher to create a course support Web site that can use course materials distributed among different servers. The KnowledgeTree course site for our C programming course was organized around lectures and integrated hierarchically all closed corpus material available for each lecture – slides, examples, questions, simulation, etc. This organization matches perfectly the lecture-to-tutorial navigation support provided by Knowledge Sea. For the purpose of this paper, an important point is that KnowledgeTree is specially designed to integrate distributed personalized services that require student identification. The architecture allows students to login once to the KnowledgeTree portal. After that, the system passes user information to any service that is called from the portal. The transfer to any of these services (i.e., quiz server, animation server, etc) is transparent for the students. While Knowledge Sea is not yet a personalized or adaptive service, it takes advantage of the KnowledgeTree architecture to collect a separate protocol of work of every student. The implementation of this feature is not straightforward since the current version of Knowledge Sea is not a server-based application but simply a set of HTML pages with embedded JavaScript. The key idea is that JavaScript fragments embedded into the Knowledge Sea HTML pages send information about every student click to a small logging server using HTTP GET protocol. The information about the student received from the portal is used to associate the student name with any action of the student logged by the logging server.
5 A Classroom Study of Knowledge Sea The problem of evaluating an educational navigation support system like Knowledge Sea is not an easy one. A traditional way of evaluation by measuring performance using "with or without" approach and a control group was not really relevant. The goal of Knowledge Sea was to encourage the students to use open corpus material and, specifically, to help them to finding open corpus material that is similar to the items in the traditionally used closed corpus material. This may or may not result in improvement of their knowledge - depending of the relevance and quality of the open corpus material. Providing access to additional materials gives a chance to increase knowledge, but does not guarantee it. One may expect and measure the increase of knowledge in an adaptive hypermedia system like InterBook (2) that attempt to steer the students to most relevant or top-rated material. However, the current version of Knowledge See provides no adaptive navigation support.
9 of 16
7/2/2003
To evaluate whether Knowledge Sea provides a good way to access additional open corpus educational material we can use an objective and a subjective way. An objective one would be inform two groups of users about two different ways to access open corpus material and check the amount and the relevance of open corpus links explored. This can be an ultimate proof and a reasonable way to do summative evaluation, but this way has value in the middle of the project. Besides, using "Blackboard links without Knowledge Sea" group as control would not be fair since this group was not accessing open corpus material at all. A subjective evaluation can measure user opinion about the system as a whole and its different aspects. If the opinion is positive, we may expect the students will be using the system. This is not an ultimate proof, but a great source of data for improving the system. Unfortunately the two approaches tend to be mutually exclusive. To use an objective approach we should not specially encourage the user to use the system, but expect that it will happen naturally. In contrast, the only way to administer a subjective evaluation is to encourage groups of students to use the system for some reasonable amount of time. It was quite natural for us to choose a subjective approach to performed a combination of formative and subjective evaluation of Knowledge Sea Table 1: The aspects that the questionnaire attempted to assess in each category. See Appendix 1 for the full set of questions and answers
Performance
Content
Interface
Overall Idea Overall feeling
Question To what extent the system achieved this goal help the student to access free online tutorials A on C Language? B How useful the system is in the context of a C programming course? Were the overall idea and purpose of the map (spread the universe of C knowledge over the 8X8 map, attaching resources to cells, and showing were the lectures belong to) easy to C grasp? D How good was the overall interface? How good was the idea of using several degrees of blue to show how many tutorial pages are E available under each cell? F G
How good was the content of the C tutorial pages?
How similar was the content of the tutorial pages located in a cell with a lecture name and around this cell to the content of the lecture?
H How similar were the tutorial pages connected to a pair of neighboring cells? I
How similar were the tutorial pages connected to the same cell of the map?
All subjects in our study were students of an undergraduate course on Programming and Data Structures at the University of Pittsburgh. The study was formally announced to the students about 2 week before the final exam. Knowledge Sea was presented as a tool that can help the students to find additional material on the topics involved into the final exam and thus achieve a better level of understanding. The tool was available to all 39 students of the class. Right before the final exam, the students who used the tool for at least 20-30 minutes were asked to fill in a non-mandatory on-line questionnaire to collect their opinion about different aspects of the system. Twenty-one students choose to participate. They received 2 extra credit points for this extra-curricular work. Of 13 total questions presented in the questionnaire, 10 are relevant to the focus of this paper. Table 1 provides a summary of aspects we were trying to evaluate. The questions were designed in a Likert 4point style where answer 1 always corresponded to a very positive opinion, answer 2 to a positive,
10 of 16
7/2/2003
answer 3 to neutral or light negative, and answer 4 to negative. To the purposes of the following discussion it is important to stress that positive answers are labeled with a lower number. Note also that instead of Likert classic homogenous scale, we choose to provide a separate set of four answers for every question. The full set of questions and answers is provided in Appendix 1. For the purpose of the presentation, similar questions scattered across the questionnaire were grouped in 5 classes. The questions A and B are aimed at understanding the general judgment (overall feeling) about the system. Question C regards the judgment about the idea of an information map as a tool that collects external resources and lesson handouts. The questions D and E are related to the interface of the system. Question F is related to the quality of the open corpus tutorial pages used to build the system. The effectiveness of the clustering and information organization is assessed using the questions G, H, I. Figure 5 provides an overview of student answers for multiple-choice questions in graphical format. It is easy to notice that the student overall opinion of the system was quite positive. For every evaluated aspect the majority of the students (more than 60%) have chosen either strongly positive or positive answers. Below we will analyze this statistics category by category. Overall feeling and overall idea. Figure 5 clearly shows that more than 60% of students (13 of 21) think that the system has achieved its goal at least “quite well” (A) and that it is at least “very helpful” (B) in the context of the course. The clearness of overall idea of the system (C) was evaluated even more positively. Still, 1/3 of students selected light negative answers like “not quite well” or “not very straightforward”. It means that further investigations are required to understand how the system can be improved..
Figure 5: The percentage of different answers grouped by question category Interface and content. The interface of the system seems not to be the major problem. The overall feelings about interface issues were even a bit more positive then about the system as a whole (Figure 5). At the same time, the question D about interface brought the most diverse answers. It was also the only question that received 5 strongly negative answers. A few students in the space for free-form comments have admitted that the interface was "a little confusing". The innovative idea of using shades of blue for showing the “depth of the information sea” was received more positively than the overall interface – only one answer was strongly negative. The content of the tutorials was also not the major problem – the opinion of the content was also slightly better than the overall feelings about the system. SOM performance. The clear champion in this survey was the performance of the SOM mapping procedure. We knew that it’s the property of SOM that it clusters similar documents in the same cell
11 of 16
7/2/2003
while preserving the topology of the information space, but we need to know to what extent this aspect was appreciated by the students. As it visible on Figure 5, the student opinion about SOM performance was much more positive than their opinion about other aspects. The percentage of positive and strongly positive answers to questions G, H, and I was always above 80% and there are no negative answers at all. The system ability to group similar tutorial pages into the same cell (Question I) was evaluated most positively. Second best is the ability to place similar pages into connected cells. The least positive of the three, but still very positive was the student evaluation of the system’s ability to place relevant tutorial pages in the same or connected cells with the “lecture cell”. Given that the textual presentation of each lecture was produced simply by extracting all text entries from the lecture slides, it looks remarkable that the SOM was able to place the lecture landmarks so well. 17 of 21 students gave at least positive answer to the question about relevance between lecture content and tutorial pages around the lecture landmark. This is yet another evidence that SOM is a relevant tool for building information space maps for navigation. While the students evaluated all aspects of the system quite positively, there is a visible space for improvement. Our hypothesis was that the system served better to some categories of the students. It may be an issue of Web experience, cognitive style, knowledge of the subject, etc. Unfortunately, we have not administered any demographics questionnaire to investigate these aspects. The only aspect we were able to test is the correlation between the student’s knowledge of the subject and their opinion about Knowledge Sea. We have decided to consider student’s final course grade as a measure of their knowledge of the subject. We have divided the students into three groups – A-level students (that includes A+, A, and A-), B-level students (B+, B, and B-) and C-D level students. To start with, just from the pattern of student participation we can notice clear that the better is the grade, the more excited were the students about the system. 8 of 11 A-level students, 10 of 17 B-level students and only 3 of 11 students with lower grades choose to take the questionnaire. The same trend is reflected by the profile of student answers. (Figure 6). For all questions the opinion of the A-level students was quite more positive than the opinion of B-level students. It is also almost always more positive than the opinion of C-level students, but we have not expected to see any consistent pattern in the C-D group since this group includes only 3 students. Note that the student positive opinion was not influenced by their grade. The study was completed before the students took the final exam. The positive correlation between the student knowledge and their opinion about the system is an interesting finding of the study, though we do not have enough data to provide a definite explanation. One of the hypothesis that we need to evaluate in the future studies is that the system was simply more helpful for the students with better knowledge of the subject resulting in their higher level of satisfaction. The correlation between student level of knowledge and their satisfaction is not an unexpected finding. A number of studies have shown that various advanced hypertext navigation tools are mostly helpful for the students with better knowledge of the subject. We have experienced this trend ourselves in out past work on evaluation of adaptive navigation support (2). The issue here is how can we make the system more helpful for the students with lower level of knowledge. A possible way to achieve this goal is to introduce the system much earlier in the course giving the student more time to get used to it. Two students have clearly requested it in their free-form comments. We are planning to do it in the future studies. One interesting fact to notice is that there is one question where the opinion of the students with different grades is about the same. This is the question B that asked the students to isolate a bit from their personal feelings and answer how relevant will be the system for the class as a whole. As we see, the students were quite consistent in thinking “for the whole class”. The feedback of C and B-level students was a bit more positive than their feedback on similar questions A and C and, vice versa, the opinion of A-level students was a bit less positive. It was looking like students themselves were able to understand that the system was really more suitable for the students with better knowledge of the subject.
12 of 16
7/2/2003
3
Overall
Overall Idea
Interfac
Content
Performance A Grade Students B Grade Students C,D Grade Students
Average Answers
2.5
2
1.5 A
B
C
D
E
F
G
H
I
Questions
Figure 6: Student rating of the system aspects split by student knowledge of the subject (final course grade).
6 Spatial Maps for Browsing and Retrieval The approach presented in this paper is based on four major principles: • Placing open and closed corpus documents on the same 2-dimensional map so that semantically similar document are located close to each other • Using SOM to build the 2-dimensional map of information space with required properties • Showing meaningful to the user closed corpus documents as landmarks on the map while also indicating the presence of open corpus documents in the area of landmarks • Using this map and landmarks to navigate from closed corpus documents to similar open corpus documents Generally, there is a large body of work on using maps for browsing and retrieval (especially in the Web context). However, most of the known works are not relevant to our approach since they use links between documents to build different kinds of maps, not their semantic similarity. Form another side, the use of document maps is common in the field of spatial hypertext (15), however, these maps are build manually, while we were concerned with an automatic approach. In this section we mention a few works that are most relevant to our approach. Following (9) we distinguish two kinds of maps: graph-based structures, in which links are used to build a graphical representation and spatial structures, in which distances between documents are used to build a two-dimensional map. A good example of using a graph-based approach is described in (6). This system uses three different similarity measures: one is based on the hypertext linking structure, one is based on the content similarity (calculated using the Vector Space Representation of the text inside the document), and the last one in based on the collaborative navigation patterns. The similarity between two documents is based of these three quantities and the map was built as a graph using the pathfinder algorithm (8). Among works that use spatial maps, most interesting in our context are those using geographical maps as the main metaphor. A system that tries to integrate different similarity
13 of 16
7/2/2003
measurements in the same spatial map is described in (21). This work uses a more traditional clustering technology showing clusters of documents as regions or cities depending on the scale and links between cities as roads. The system presented in (16) organizes documents from many digital libraries on a geographical map based on their topics so that the location of a document communicates an information about its topic. A number of works explore the use of information space maps build with the Self-Organizing Map technology. Several pioneer examples were provided by the developers of SOM technology (12; 13). Most interesting in our context are works that explore the effectiveness of the SOM as a tool to develop information maps that place similar documents close to each other. (7) has validated the proximity hypothesis for which related topics are clustered closely on the map. The associations made by the SOM they were compared to maps generated at random that produce region association created by chance without the treatment of the learning algorithm. An interesting user study was conducted by Lin et al. (14) in order to validate the SOM clustering results and in particular this proximity hypothesis. (17) has explored the use of SOM as an automatic linking engine. A map was trained using nodes of a manually linked hypertext. The nodes in the same unit or in units connected by the rectangular lattice were considered linked each other. This automatically built link structure was compared to the link structure imposed by the author to evaluate the quality of linking.
7 Summary and Future Work This paper presents an approach and a system Knowledge Sea that attempts to solve the problem of navigation from closed to open corpus hypermedia in the context of Web-based education. The approach is based on the use of landmarks and information space maps – a way that humans use quite successfully for solving real world navigation tasks. The 2-dimensional map of the information space in our approach was built using Self-Organized Maps. The classroom evaluation demonstrated that the approach itself and, in particular the performance of the map-building part were positively evaluated by the students. Additional analysis showed that students with better knowledge of the subject (measured by their course grade) are consistently more positive in evaluating the system and its features. The hypothesis (that we want to check in our future research) is that, similarly to other advanced navigation tools, the Knowledge Sea is most helpful for students with better knowledge of the subject. In our future work, we intend to enhance this approach in several ways. On the technical side we want to use dynamic landmarks that can better adapt to the current needs of the students. On the application side, we are interested to apply the approach to non-educational domains such as medical literature search. On the research side we intend to investigate the use of adaptive navigation support techniques in the context of an information space map. At the same time, we plan more serious user studies of our existing system. We want to discover the factors that help all students to benefit more from the use of Knowledge Sea. In particular, encouraged by some results in the field of adaptive hypermedia (2) we want to investigate the role of experience in using the Knowledge Sea approach. We hope that this paper will convince other researchers that maps and landmarks provide a good way to navigate in open corpus hypermedia and encourage others to join us in our quest to make an enormous amount of information accumulated in open corpus Web hypermedia closer to end users.
References 1. 2.
3.
BLACKBOARD!INC. BLACKBOARD COURSE MANAGEMENT SYSTEM HTTP://WWW.BLACKBOARD.COM/ BRUSILOVSKY, P. and EKLUND, J. A study of user-model based link annotation in educational hypermedia. Journal of Universal Computer Science 4(4), 1998, 429-448. Available at http://www.iicm.edu/jucs_4_4/a_study_of_user. BRUSILOVSKY, P. and RIZZO, R. Map-based access to multiple educational on-line resources from mobile wireless devices. In: Paternò, F., ed. Mobile Human-Computer Interaction. Berlin: Springer-Verlag, 2002, 404-408.
14 of 16
7/2/2003
4.
5.
6. 7. 8. 9.
10. 11. 12. 13.
14.
15. 16. 17.
18.
19. 20. 21.
BRUSILOVSKY, P. and RIZZO, R. Map-based horizontal navigation in educational hypertext. Journal of Digital Information 3(1), 2002. Available at http://jodi.ecs.soton.ac.uk/Articles/v03/i01/Brusilovsky/. BRUSILOVSKY, P. and SCHWARZ, E. Concept-based navigation in educational hypermedia and its implementation on WWW. Proceedings of ED-MEDIA/ED-TELECOM'97 - World Conference on Educational Multimedia/Hypermedia and World Conference on Educational Telecommunications Calgary, Canada, 1997, 112-117. CHEN, C. Structuring and visualizing the WWW by generalised similarity analysis. Proceedings of Eight ACM International Hypertext Conference (Hypertext'97) Southampton, UK, 1997, 177-186. CHEN, H., J. NUNAMAKER, J., ORWIG, R., and TITKOVA, O. Information visualization for collaborative computing. IEEE Computer (August), 1998, 75-82. COOKE, N.J., NEVILLE, K.J., and ROWE, A.L. Procedural network representation of sequential data. Human-Computer Interaction 11(1), 1996, 29-68. DURANT, D. and KAHN, P. MAPA™: A system for inducing and visualizing hierarchies in websites. Proceedings of Ninth ACM International Hypertext Conference (Hypertext'98) Pittsburgh, USA, 1998, 66-76. FRUCHTERMAN, T.M.J. and REINGOLD, E.M. Graph drawing by force-directed placement. Software practice and experience 21(11), 1991, 1129–1164. KOHONEN, T. Self-Organizing Maps. Springer Verlag, Berlin, 1995. KOHONEN, T., KASKI, S., LAGUS, K., and HONKELA, T. Very Large Two-Level SOM for the Browsing of the Newsgroups. Proceedings of ICANN'96 Berlin, 1996, 269-274. LAGUS, K., HONKELA, T., KASKI, S., and KOHONEN, T. Self-organizing maps of document collections: a new approach to interactive exploration. Proceedings of Second International Conference on Knowledge Discovery and Data Mining1996, LIN, C., CHEN, H., and NUNAMAKER, J.F. Verifying the proximity hypothesis for selforganizing maps. Proceedings of The 32nd Hawaii International Conference on System Sciences1999, MARSHALL, C.C. and SHIPMAN III, F.M. Spatial hypertext: Designing for change. Communications of the ACM 38(8), 1995. ORENDORF, J. and KACMAR, C. A spatial approach to organizing and locating digital libraries and their content. Proceedings of Digital Libraries'96 Bethesda, MD, 1996, 83-89. RIZZO, R., ALLEGRA, M., and FULANTELLI, G. Hypertext-like structures through a SOM network. Proceedings of Tenth ACM Conference on Hypertext and hypermedia (Hypertext'99) Darmstadt, Germany, 1999, RIZZO, R., FULANTELLI, G., and ALLEGRA, M. Browsing a document collection as an hypertext. Proceedings of WebNet'2000, World Conference of the WWW and Internet San Antonio, TX, 2000, 454-458. VAN RIJSBERGEN, C.J. Information Retrieval (Second ed.). Butterworths, 1979. WEBCT WebCT Course Management System http://www.webct.com ZIZI, M. and BEAUDOUIN-LAFON, M. Accessing hyperdocuments through interactive dynamic maps. Proceedings of ACM European Conference on Hypermedia Technology1994, 126-135.
Appendix
15 of 16