Using mathematical models to predict annoyance from combined noise sources in the city of Dubai Hussein M ELMEHDI1 1
Applied Physics Department, University of Sharjah, Sharjah, United Arab Emirates
ABSTRACT Residents of major cities of the United Arab Emirates are exposed to multiple noise sources originating from road traffic, aircraft flyovers and various industrial activities. Predicting the contribution of each of these sources to public annoyance, and hence relating it to health effects on residents of these cities, is not an easy task because of the complex nature of these sources and their subjective contribution to community annoyance. In this paper, we report preliminary results of applying mathematical models to assess annoyance due to combined sources using data obtained from noise level measurements in combination with social surveys conducted near the selected sites. The models are based on the 24-h average sound levels LAeq, 24h and the measured annoyance scores for aircraft, road traffic, and combined noise. Models are based on the assumption that the annoyance caused by combined noise sources can be predicted by the total energy and separate sources make independent contributions to the total annoyance. Our results show that annoyance due to aircraft noise was slightly modified by additional road traffic noise. The results also indicate that road traffic noise exposure and annoyance were more dominant than those of aircraft noise at most sites. Keywords: Annoyance, Multiple Sources, Mathematical Models I-INCE Classification of Subjects Number(s): 52.2, 52.3, 76.1
1. INTRODUCTION Annoyance is a term used to express the overall negative effects felt by residents due to continuous exposure to noises of different levels. These negative effects include discomfort, displeasure, unhappiness, uneasiness, disturbance, discontent, and vulnerability, due to unwanted noise coming from various sources. These effects have proven to leads to adverse health effects such as anxiety and stress, which is considered as a symptom of potential more serious health problems [1]. In addition, annoyance levels are used as an indicator of somatic damage, loss of control and orientation, negative assessment of the noise source and high sound levels [2]. Road traffic noise is considered to be one of the major causes of noise annoyance in the urban communities [3]. Although, the quantification of exposure to noise can be assessed with physical measures using advanced technological devices, noise annoyance is a subjective measure, which may vary from one person to another and depends on several factors, most of which are related to the person him/herself [3]. However, exposure to noise at various levels is a fact of life in residential suburban communities, where residents are exposed to multiple noise sources, which result in interference among these various noise sources. In major urban communities, such as Dubai and Sharjah, the main noise sources include transportation noises (mainly due to flow of vehicles), flyovers and in addition to noise coming from railways (only in some parts of Dubai) and nearby industrial sites. As mentioned above, it is widely accepted thatassessing the effect of noise and its perceptions by residents depends not only on its loudness, but also on its components, the source characteristics, and oftentimes varies great deal from one person to another.The study of Miedema and Vos [4,5], whostudied annoyance as a function of noise exposure to data from a very large set of social surveys conducted on different types of noise sources (aircraft, road traffic and railways). Their result showed that aircraft noise is more annoying than road traffic noise, which in turn was found to be more annoying than railway noise, for a given noise level. Recent studies in the vicinity of Zurich Airport on the environmental effects of noise originating 1
[email protected]
Inter-noise 2014
Page 1of 5
Page 2 of 5
Inter-noise 2014
from combined effects (mainly road traffic and aircraft sources) have been conducted using the data from two separate social surveys on aircraft noise annoyance and physical measurements of noise levels [6]. These and other studies have further confirmed that aircraft noise annoyance was slightly modified by additional noise sources such as road traffic and railway noises [6]. In the case of aircraft noise, it was also reported that exposure-effect curves for road traffic noise annoyance became flatter as aircraft noise exposure increased, and the trend was negative when aircraft noise exposure was more than 56.7 dB LA eq . In an attempt to gain better understanding of the effects of noise arising from combined sources on annoyance in urban communities, several authors have used mathematical models to predict the total annoyance felt by residents of these communities. Two of the comprehensive studies include the pioneering paper of Taylor [7], which was conducted in the vicinity of Toronto International Airport and the resent papers of Nguyen [7,8], which were conducted in the vicinity of major airports in Vietnam. The authors used several mathematical approaches (models) to predict the dependence of total annoyance on mixed in Toronto and Vietnam. Their findings reported in these papers confirmed the importance of absolute level differences between sources, with differences in the predicted results from different models. Our goal in this paper is to apply these models to the data we have previously published on annoyance in various UAE cities to predict the annoyance level from combined/mixed noise sources. 1.1 Mathematical Models In this study, we will use two models that are previously used by other researchers to predict the annoyance due to the combination of aircraft and road traffic noises. The first model is the energy summation model, whereby the total annoyance is predicted from the total noise level calculated as an energy sum of the separate sources. The second is the independent effects model, in which the separate sources are assumed to make independent contributions to the total annoyance. In the energy summation model, the total annoyance is expressed as:
A = f ( LT )
(1)
Where A is the annoyance response to the combined sources, and L T is the total noise level calculated as an energy sum of separate sources L i . n
LT = 10 log ∑10 Li /10
(2)
i=1
This model is based on the assumption that the annoyance caused by combined noise sources can be predicted by the total energy. The second model investigated here is the independent effects model, the total annoyance is expressed as: A = f1 ( L1 ) + f1 ( L1 ) + f1 ( L1 ) (3) Where A is the annoyance response to the combined sources, while L 1 , L 2 , . . . , L n are separate source LA eq values and f 1 (L 1 ), . . . , f n (L n ) are functions determined for each source. This model is based on the assumption that the separate sources make independent contributions to the total annoyance.
2. DATA COLLECTION The data used in the two models includes physical onsite noise level measurements and social surveys conducted in selected sites near Dubai International Airport, which is considered as one of the busiest airports in the world. The number of air passengers is predicted to grow by 4.3% until the year 2015 [9]. As a result the number of flights continues to increase especially in developing areas such as the city of Dubai, United Arab Emirates (UAE), which airport is considered as the second fastest growing airport in the world. The airport handles close to 1000 daily events, including take off and landing [9], with approximately the same number of landings and takeoffs. Such high volume
Page 2 of 5
Inter-noise 2014
Inter-noise 2014
Page 3 of 5
of events, consequently led to an increase in the noise pollution in the vicinity of the airport. In addition to this high air traffic volume, road traffic in the city of Dubai is considered high [10]. In our previous reports, annoyance levels due to aircraft and road traffic were reported separately. In this paper, we use the same data to predict the contribution of the combined noise to the total annoyance in selected sites near Dubai International Airport. 2.1 Noise Measurements Noise levels in the selected sites were assessed using a precision portable sound level meter Nor140 (made by Norsonic, Norway). The meter is a device that responds to sound similar to that of the human ear, and provides reproducible measurements of sound levels. It consists of a microphone and electronics, which is fitted with three sound weightings A, B and C. The meter detects sounds and converts them into an electrical signal via electronic circuits, from which the meter displays a digital reading for sound levels in any of the mentioned weighted scales [9]. The A-weighting, which is characterized by major discrimination against very low frequency sounds, was used because it closely simulates the perception of the human ear.The meter was mounted on a tripod 1.5 m above the ground level and at least 3 meters away from any reflecting surfaces. Community response to noise was assessed using the Weighted Equivalent Continuous Perceived Noise Level (WECPNL), which is given by the following expression: WECPNL = [dB(A)]ave + 10 log10 ( N ) − 27
(4)
Where [dB(A)] ave stands for the energy mean of all peak levels of any day, and N = N 2 + 3N 3 + 10(N 1 + N 4 ), where N 1 is the sum of the number of aircraft between 0:00 a.m. and 7:00 a.m.; N 2 is the number of aircraft between 7:00 a.m. and 7:00 p.m.; N 3 is the number of aircraft between 7:00 p.m. and 10:00 p.m.; and N 4 is the number of aircraft number between 10:00 p.m. and 12:00 p.m. In addition to WECPNL, we have also calculated the Day-Night Average Sound Level (L dn ), which is given by the expression [see for example 13,14], 9 ⎡ 15 0.1× Lday 0.1×( Lnight +10) ⎤ Ldn = 10 log ⎢ × 10 + × 10 ⎥ 24 14 ⎣ ⎦
(5)
L dn represents the average noise level over a 24 hour period, with a 10 dB "penalty" in the night time hours (10 p.m. to 7 a.m.) to account for the fact that people typically find noise more disturbing at night while they are trying to sleep. The L dn descriptor is useful for measuring the impacts that road noise might have on a use that may be constantly occupied such as a home. Both WECPNL and L dn were used to assess the relationship between annoyance and public response. 2.2 Social Survey As reported previously, an average of 23 surveys were collected from residences living within 100-150 meters from the site. In addition to demographic questions, the questionnaire included questions on noise annoyance, interference with daily activities and psychological as well as physiological health related problems, and general reaction to aircraft noise. We have sued the scale developed by ISO/TS 15666, 2003 questionnaire [10], which used a scale from 0 to 10, ranging from “Not annoyed at all”, Slightly annoyed, Moderately annoyed, Very annoyed or “Extremely annoyed”. The questionnaire was available in both Arabic and English. It should be noted that subjects were chosen randomly with no prior knowledge of the questionnaire. Subjects must have lived in their property for at least 12 months. The selected sites for this study are located within proximity of the airport. In addition, it should be pointed out that the subjects interviewed were all residents of the UAE who have lived near the airport for an extended period of time (at least 12 months) in the UAE and very familiar with cultural and social values.
3. RESULTS AND DISCUSSION The annoyance at each of the seven sites investigated near Dubai International Airport was calculatedfrom the mean of the individual annoyance scores. The24-h average sound level LA eq ,24h
Inter-noise 2014
Page 3 of 5
Page 4 of 5
Inter-noise 2014
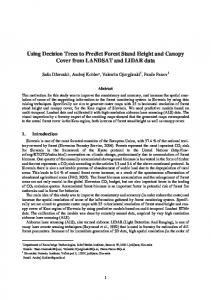
and he average annoyance scoresfor aircraft, road traffic, and combined noise that were obtainedfrom the surveys in these sites are summarizedin Figure 1.
Figure 1 – Noise exposure and annoyancefor the seven sites investigated near Dubai International Figure 1 shows that exposure ranged from 55.6 to 71.3 dB for aircraft while road traffic noiseexposure ranged from 67.2 to 71.1 dB. The associated annoyancescores for both sources ranged from 2.9 to 5.6 and from 4.0 to 9.1 respectively.For the combined sources, exposure ranged from 69.6 to 74.7 dB with the associated annoyance ranging from 4.6 to 9.1. These values are comparable to those reported by Taylor [7] andNguyen et al [8]. As stated in the introduction section, our goal in this paper is to apply well-established mathematical models to the collected data near Dubai International Airport to predict the annoyance level from combined noise sources. Two regression analysis models examined were calculatedby fitting a model to the data such that the sum of thesquared differences between the fitted line and the data points isminimized. The coefficient of determination R 2 indicates the percentageto which the model accounts for the variability in the totalnoise annoyance. The standard error of the estimate is the amountof variability in the points around the regression line.The results of the fits to our data for both models are presented in Table 1. Table 1 – Regression equations for multiple regression models calculated using combined noise from two sources near Dubai International Airport Model Energy Summation Independent Effects
Regression Equation
R2
Standard Errors
AT = 0.1615LT - 5.2204
0.31
1.32
AT = 0.113 LAC+ 0.200 LRT–13.9
0.45
1.51
T = Overall annoyance rating, AC = aircraft, RT = road traffic The regression equations for the two models presented in Table 1 were calculated by fitting the
Page 4 of 5
Inter-noise 2014
Inter-noise 2014
Page 5 of 5
model to the data such that the square of the differences between the fitted line and the data is minimized. The coefficient of determination R 2 indicates the percentage to which the model accounts for the variability in the total annoyance, while the standard errors estimates the amount of variability in the points around the line. The determination R 2 of the regressions in Table 6 indicates that the independent model estimated the total annoyance better than the energy summation model. This result is consistent with the studiesconducted by Taylor [4] andNguyen et al [5,6], confirming theimportance of absolute level differences between sources in theireffects on total annoyance. The authors discuss other models such as response summation model, summation and inhibition model, annoyance equivalent model, dominant model and energy difference model. Due to time constraints, the results of fitting these models to our data is underway and will be reported in future publications. This is important to present a comprehensive numerical prediction of noise annoyance and contribution/dominance of each of the noise sources.
4. CONCLUSIONS Our preliminary results indicated that the use of models that account for the independent contributions of different noise sources (independent model) to predict annoyance reactions to noise in a mixed sources environment is important. This is due to the fact that the energy summation model does not account for the absolute noise levels of the sources contributing to the total level. Several additional models need to be examined in order to predict the contribution of the sources to the total annoyance in the cities of Sharjah and Dubai. Current field measurements (both noise and annoyance surveys) are underway to increase the number of sites and respondents in each site to help achieve this goal.
ACKNOWLEDGEMENTS The author is grateful for the financial support provided by the Colleges of Sciences and of Graduate Studies and Research at the University of Sharjah. The author is also grateful for the assistance of Lect. Omara Adwan for assistance with data collection and analysis. The author is also grateful to Lect. Nawal Nayfeh for translating the survey to Arabic.
REFERENCES 1. G. H. Pandya. “Assessment of Traffic noise and its impact on the community”. J. Environ. Studies 2003: 60(6): 595–602. 2. Ohrstrom E, Skanberg A, Svensson H, Gidlof-Gunnarsson A. Effects of road traffic noise and the benefit of access to quietness. J Sound Vib 2006;295:40-59. 3. Jarup et. al. (The HYENA Team). “Hypertension and Exposure to Noise Near Airports: the HYENA Study”. Environmental Health Perspectives. 2008;116(3): 329-333. 4. Miedema HME. Relationship between exposure to multiple noise sources and noise annoyance. J Acoust Soc Am 2004;116:949-57. 5. Vos J. Annoyance caused by simultaneous impulse, road-traffic, and aircraft sounds: A quantitative model. J Acoust Soc Am 1992;91:3330-45. 6. Brink M, Lercher P. The effect of noise from combined traffic noise sources on annoyance. The interaction between aircraft and road traffic noise. In:Proceedings of Internoise 2007. Istanbul, Turkey; 2007. 7. Taylor SM. A comparison of models to predict annoyance reactions to noise from mixed sources. J Sound Vib. 1982;81:123-38 8. Nguyen TL, Yano T, Nguyen HQ, Nishimura T, Fukushima H, Sato T, et al. Community response to aircraft noise in Ho Chi Minh City and Hanoi. Appl Acoust 2011;72:814–22. 9. Elmehdi, HM and Nayfeh, N. “Noise Levels near Roads of Major Cities of the United Arab Emirates Noise Levels near Roads of Major Cities of the United Arab Emirates”, The 19th International Congress on Acoustics - ICA07MADRID, Spain, 2-5 September (2007). 10. H.M. Elmehdi. The relationship between civil aircraft noise and community annoyance near Dubai International Airport (UAE). Acoustic Sciences and Technology. Acoustics Sciences and Technology 2012;33(1): 6-10.
Inter-noise 2014
Page 5 of 5