Master of Science in Medical Physics .... 3.4 Other Components of a Proton
Therapy Nozzle . ... CHAPTER 4: MCNPX MODEL OF PROTON BEAM
THERAPY .
USING MCNPX TO CALCULATE PRIMARY AND SECONDARY DOSE IN PROTON THERAPY A Thesis Presented to The Academic Faculty By Jeffrey M. Ryckman In Partial Fulfillment Of the Requirements for the Degree Master of Science in Medical Physics Georgia Institute of Technology May, 2011
USING MCNPX TO CALCULATE PRIMARY AND SECONDARY DOSE IN PROTON THERAPY
Approved by: Dr. Bojan Petrovic, Advisor School of Mechanical Engineering Georgia Institute of Technology Dr. Chris Wang School of Mechanical Engineering Georgia Institute of Technology Dr. Eric Elder Medical Physicist Emory University Hospital Date Approved: 1/19/2011
ACKNOWLEDGEMENTS I would like to especially thank my mother and father, without whose guidance and support I would not be here. Additionally, I would like to thank Dr. Bojan Petrovic. Without his guidance, this work would not be possible.
iii
TABLE OF CONTENTS Page ACKNOWLEDGEMENTS ......................................................................................................................................... iii LIST OF TABLES ........................................................................................................................................................ vi LIST OF FIGURES ...................................................................................................................................................... vii LIST OF SYMBOLS AND ABBREVIATIONS ..................................................................................................... ix SUMMARY ..................................................................................................................................................................... x CHAPTER 1: INTRODUCTION ............................................................................................................................... 1 CHAPTER 2: OBJECTIVE OF THIS WORK ........................................................................................................ 3 CHAPTER 3: OVERVIEW OF PROTON THERAPY SYSTEM CHARACTERISTICS ............................. 7 3.1 Basic Physics of Protons .......................................................................................................................... 7 3.1.1 Stopping .............................................................................................................................................. 7 3.1.2 Scattering ........................................................................................................................................... 8 3.1.3 Nuclear Reactions ........................................................................................................................... 9 3.2 Facility Design .............................................................................................................................................. 9 3.3 Nozzle ........................................................................................................................................................... 10 3.3.1 The History and Development of the Double-‐Scattering Design ............................ 11 3.4 Other Components of a Proton Therapy Nozzle ........................................................................ 16 3.5 Impacts of Different Nozzle Designs ............................................................................................... 17 CHAPTER 4: MCNPX MODEL OF PROTON BEAM THERAPY ............................................................... 18 4.1 Nozzle ........................................................................................................................................................... 18 4.2 Proton beam .............................................................................................................................................. 18 4.3 Components of Nozzle ........................................................................................................................... 20 4.3.1 Double scattering system ......................................................................................................... 20 4.3.2 Collimators ..................................................................................................................................... 23 4.3.3 Snout ................................................................................................................................................. 24 4.3.4 Final aperture ................................................................................................................................ 24 4.4 Primary and Secondary Dose Calculation in MCNPX ............................................................... 24 4.4.1 Calculation of Primary Dose: The F6 Tally ....................................................................... 25 4.4.2 Calculation of Secondary Dose: Neutron Dose Equivalent ........................................ 26 4.4.3 Visualization of Dose: Mesh Tallies ...................................................................................... 28 CHAPTER 5: MONTE CARLO SIMULATIONS, Results and Discussion ............................................. 30 5.1 Simple Water Phantom Setup ............................................................................................................ 30 5.1.1 Proton Depth-‐Dose Distribution: Ensuring a Flat Region of Maximum Dose ... 31 5.1.2 Useful Radius: Ensuring Cross-‐Sectional Uniformity of Dose .................................. 33 5.1.3 Discussion of Useful Radius Results .................................................................................... 34 5.2 Neutron Dose Equivalent Setup ........................................................................................................ 35
iv
5.2.2 Results .............................................................................................................................................. 39 5.3 The MIRD Phantom Setup ................................................................................................................... 40 5.3.1 Problem Setup ............................................................................................................................... 41 5.3.2 Results of MIRD Problem ......................................................................................................... 45 CHAPTER 6: CONCLUSIONS/FUTURE WORK ............................................................................................ 48 6.1 Summary and Conclusions .................................................................................................................. 48 6.2 Recommended Future Work .............................................................................................................. 49 APPENDIX A: USEFUL DATA .............................................................................................................................. 51 A.1 NEU Input Deck: Double Scattering System and Beam Data ................................................ 51 APPENDIX B: MCNPX INPUT DECKS .............................................................................................................. 57 B.1 MCNPX Input Deck for Proton and Neutron CAX Dose & Useful Radius ......................... 57 B.2 MCNPX Input Deck: The NDE Problem .......................................................................................... 65 B.3 MCNPX Input Deck: The MIRD Problem ....................................................................................... 74 REFERENCES ............................................................................................................................................................ 91
v
LIST OF TABLES Page Table 1: Proton Beam Data ............................................................................................................................. 19 Table 2: RMW Data ......................................................................................................................................... 21 Table 3: H/D Values for .................................................................................................................................... 39 Table 4: Comparison of NDE results ........................................................................................................... 40 Table 5: Tabulation of Primary and Secondary Dose .......................................................................... 45 Table 6: Calculated NDE for the Whole Brain and Spine ................................................................... 45
vi
LIST OF FIGURES Page Figure 1: Characteristics of Bragg’s Peak ........................................................................................................ 3 Figure 2: The Effect of Varying Energy on Depth of Bragg’s Peak ........................................................ 8 Figure 3: Loma Linda Proton Treatment Center Floor Plan ................................................................ 10 Figure 4: Single Scatterer .................................................................................................................................... 12 Figure 5: A compensated upstream modulator, or Range Modulation Wheel ............................. 13 Figure 6: RMW: Generation of SOBP .............................................................................................................. 15 Figure 7: Double-‐Scattering Design ................................................................................................................ 16 Figure 8: The Nozzle .............................................................................................................................................. 18 Figure 9: MCNPX Source Definition Input cards ....................................................................................... 20 Figure 10: Bragg’s Peak from Steps of RMW ............................................................................................... 21 Figure 11: SOBP ....................................................................................................................................................... 22 Figure 12: Range Compensated Scatterer: S2 ............................................................................................ 23 Figure 13: Calculation of Primary Dose in MCNPX ................................................................................... 25 Figure 14: Calculation of Secondary Dose in MCNPX .............................................................................. 27 Figure 15: Mesh Tally Input Deck .................................................................................................................... 28 Figure 16: Results of Type 1 Proton Flux Mesh Tally ............................................................................. 29 Figure 17: Simple Phantom Setup ................................................................................................................... 30 Figure 18: Proton Depth vs. Dose Curve ....................................................................................................... 31 Figure 19: Neutron Depth vs. Dose Curve .................................................................................................... 32 Figure 20: Useful Beam Radius ......................................................................................................................... 34 Figure 21: NDE Problem Setup ......................................................................................................................... 35 Figure 22: SOBP for NDE Calculations ........................................................................................................... 36 Figure 23: Verification of Dose Delivered to Tumor Region ................................................................ 38
vii
Figure 24: Problem Setup with the ORNL Age 10 MIRD Phantom .................................................... 41 Figure 25: The ORNL Age 10 MIRD Phantom ............................................................................................. 42 Figure 26: MIRD Phantom: Proton Dose in Tumor Region .................................................................. 44 Figure 27: MIRD Phantom: Proton Dose in Tumor Region (Zoomed in) ........................................ 46
viii
LIST OF SYMBOLS AND ABBREVIATIONS FWHM MCNPX PTV SOBP RMW MSA S1 S2 NEU SRIM Gy Sv RBE QF LET NDE φE hϕ H H/D NCRP ICRP CAX MIRD
Full-‐Width Half Maximum Monte Carlo N-‐Particle eXtended Planned Treatment Volume Spread Out Braggs Peak Range Modulation Wheel Multiple Scattering Angle First Scatterer Second Scatterer Nozzle Everything Upstream Stopping Ranges in Matter Grey Sieverts Relative Biological Effectiveness Quality Factor Linear Energy Transfer Neutron Dose Equivalent Neutron Spectral Fluence Fluence-‐to-‐Dose Equivalent Conversion Coefficients Dose Equivalent (for neutrons) Neutron Dose Equivalent to Therapeutic Absorbed Dose National Council on Radiation Protection and Measurements International Commission on Radiation Protection Central Axis Medical Internal Radiation Dose
ix
SUMMARY Proton therapy is a relatively new treatment modality for cancer, having recently been incorporated into hospitals in the last two decades. Although proton therapy has much higher start up and treatment costs than traditional methods of radiotherapy, it continues to expand in use today. One reason for this is that proton therapy has the advantage of a more precise localization of dose compared to traditional radiotherapy. Other proposed advantages of proton therapy in the treatment of cancer may lead to a faster expanse in its use if proven to be more effective than traditional radiotherapy. Therefore, much research must be done to investigate the possible negative and positive effects of using proton therapy as a treatment modality. In proton therapy, protons do account for the vast majority of dose. However, when protons travel through matter, secondary particles are created by the interactions of protons and matter en route to and within the patient. It is believed that secondary dose can lead to secondary cancer, especially in pediatric cases. Therefore, the focus of this work is determining both primary and secondary dose. In order to develop relevant simulations, the specifications of the treatment room and beam were based on real-‐world facilities as closely as possible. Using available data from proton accelerators and clinical facilities, an accurate proton therapy nozzle was designed. Dose calculations were performed by MCNPX using a simple water phantom, and then beam characteristics were investigated to ensure the accuracy of the model. After validation of the beam nozzle, primary and secondary dose values were tabulated and discussed. By demonstrating the method of these calculations, the purpose of this work is to serve as a guide into the relatively recent field of Monte Carlo methods in proton therapy.
x
CHAPTER 1: INTRODUCTION The characteristics surrounding proton therapy beams are well established. However, there are still questions that arise on the clinical effectiveness of such an expensive treatment modality when compared to traditional radiotherapy. Since the discovery of the clinical usefulness of protons by Robert R. Wilson in 1946 (Wilson, 1946), over 50,000 patients have been treated with protons worldwide (Delaney & Kooy, 2008), and the number of clinical proton therapy facilities is increasing. Currently, there are seven active facilities, four under construction, and two facilities undergoing development planning in the United States alone (Artz, 2010). It is known that proton therapy has many advantages, in particular the ability of better dose conformation to the tumor as well as the majority of energy being deposited at the end of the proton’s track in what is known as Bragg’s Peak (Figure 1a).
Dose
Bragg's Peak
Depth (cm) Figure 1a: Bragg’s Peak
1
Monoenergetic proton beams have a depth-‐wise Full Width at Half Maximum (FWHM) smaller than a typical treatment tumor volume (Delaney & Kooy, 2008). In order to treat patients, the incoming beam must be spread both laterally and depth-‐wise (Figure 1b) to provide the ability to treat the various depths and dimensions of each case. In most modern clinical facilities in use today, this is accomplished by the use of a double-‐scattering system that involves placing materials into the beam path. However, by introducing material into the beam line, secondary particles such as gammas and neutrons in particular are created (Polf & Newhauser, 2005). It is known that there are potential issues with secondary doses due to neutrons (Mesoloras G, 2006). Although small compared to the proton dose, secondary neutron dose is especially of concern in pediatric cases, where children are more susceptible to radiation-‐induced tumors than are adults (Hall, 2009). Therefore, it is important to investigate all contributions to total dose, including gammas, protons, and neutrons.
Figure 1b: Energy deposition profile in Proton Therapy
2
Due to the patient-‐specific treatment plans that are developed for cancers, significant computational resources when using Monte Carlo methods are required for each and every patient. An accurate nozzle model representing a clinical proton therapy facility has been constructed and used to perform dose calculations using Monte Carlo N-‐Particle eXtended (MCNPX) code (Water, 2002). MCNPX is a modern, general-‐purpose Monte Carlo code developed at Los Alamos National Laboratory and is capable of supporting thirty-‐four particle types, utilizing updated cross section libraries and using physics models where cross section libraries are not available (Pelowitz, 2005). Many simulations have been performed to ensure validity of the beam delivery model. After verification of the initial setup, this beam was implemented in several problems where primary and secondary dose calculations were performed and discussed. Thus, the thesis is organized as follows: Chapter 2 presents the background and objective of this work. Chapter 3 provides the groundwork necessary to understand a proton therapy nozzle by discussing proton therapy system characteristics, beginning with the physics of protons and then moving into an overview of the components commonly found in proton therapy nozzles. Chapter 4 discusses each component of the nozzle design as accomplished by MCNPX, and also provides an overview of primary and secondary dose calculation methods. Chapter 5 presents the various geometrical setups and types of calculations in this work. This includes problems with a simple water phantom, a patient phantom, and their accompanying primary and secondary dose calculations. Chapter 6 is a discussion of the results generated by the problems presented in Chapter 5. Finally, Chapter 7 provides a conclusion as well as ideas for future work.
3
CHAPTER 2: BACKGROUND AND OBJECTIVE OF THIS WORK Due to the increased cost and the relatively recent clinical utilization of proton therapy, much research must be done to explore the potential advantages of proton therapy and justify its use over the comparatively inexpensive and traditional methods of photon and electron radiotherapy. Authors such as Newhauser, Polk, Fontenot, Zheng, Titt, and various other contributors have devised benchmark problems that have laid out the groundwork in this field, in particular Monte Carlo methods in proton therapy (Polf & Newhauser, 2005) (Newhauser, et al., 2007) (Titt, Zheng, Vassiliev, & Newhauser, 2007) (Newhauser, Koch, Hummel, Ziegler, & Titt, 2005) (Zheng, Newhauser, Fontenot, Taddei, & Mohan, 2007). Given the physical property of protons and their vastly different response in mediums of different densities (Section 3.1: Basic Physics of Protons), there is marked difference in dose distribution with charged-‐particle beams in heterogeneous density mediums (Goiten, 1984). Therefore, it is important for a dose calculation algorithm to be able to model complex, heterogeneous density mediums when calculating primary and secondary dose. The ability of MCNPX to model complex, heterogeneous density mediums make it ideal for use in primary and secondary dose calculations, further demonstrating the usefulness of MCNPX in this work. In addition, Monte Carlo methods of using realistic models may account for all of the important physical processes undergone by protons in matter (Newhauser, Koch, Hummel, Ziegler, & Titt, 2005). Additionally, unlike the alternative analytical approaches, Monte Carlo programs such as MCNPX have the ability to input the lattice geometry required for simulating patient treatments based on CT data sets, demonstrating the flexibility and a key advantage of Monte Carlo techniques over analytical techniques (Siebers, 2000).
4
Like other general-‐purpose Monte Carlo codes, MCNPX was developed for high-‐ energy physics simulations, not necessarily optimized for clinical use. While MCNPX is fully capable to perform therapy-‐planning calculations, currently it is too time consuming to be used for routine patient planning (Siebers, 2000). However, in recent years, the increasing efficiency of Monte Carlo algorithms over other methods as well as increased computational power have made modeling proton therapy facilities and performing dose calculations using Monte Carlo methods increasingly practical. As seen with both photons and electrons in radiotherapy, there is a strong move towards Monte Carlo-‐based dose calculation engines (Tourovsky, Lomax, Schneider, & Pedroni, 2005). With this evidence, it has been established that Monte Carlo techniques provide an accurate method for performing dose calculations. In a proton therapy nozzle, the incoming beam must be modified to be spread out laterally and depth wise to conform to a tumor volume. However, material in the beam such as nozzle components and patient tissue can lead to a fraction of the protons to undergo nuclear reactions that release stray radiation such as neutrons, thereby contributing to the overall dose. This secondary dose is unwanted radiation that has no known beneficial effect and also is believed to increase the risk of secondary cancers (Zheng, Newhauser, Fontenot, Taddei, & Mohan, 2007). Therefore, it is important to account for secondary dose when performing dose calculations. The accuracy with which dose calculations are performed is a vital component of any legitimate radiotherapy method. The focus of this work is to evaluate the use of MCNPX to perform dose calculations of a representative proton therapy facility and establish baseline for effective simulations. In order to develop an accurate simulation methodology, the specifications of the treatment room and beam were based on real-‐world facilities as closely as possible. Using the geometrical setup of clinical facility, an efficient model for calculating primary and secondary dose has been implemented. In addition, the intention of
5
this work is to serve as a guide for the new user into the relatively recent field of Monte Carlo methods in proton therapy.
6
CHAPTER 3: OVERVIEW OF PROTON THERAPY SYSTEM CHARACTERISTICS The purpose of proton therapy facilities is to administer the dose prescribed by the radiation oncology team to unhealthy tissue as accurately and efficiently as possible. In order to be relevant, simulations in this research were based on existing clinical facilities. In this section, facility design, proton physics, and the physics behind the development of the double-‐scattering system are first discussed in order to preface the specific problem geometry of the proton therapy model, as discussed in Chapter 4. 3.1 Basic Physics of Protons Before going into the different components and their roles in proton therapy facilities, it is important to understand the physics of protons when traveling through matter. There are three types of basic interactions that protons undergo in matter: stopping, scattering, and nuclear reactions. What follows will be a short review of the physics concerning heavy charged particles in matter, protons in particular. For an elaborate description on the physics of proton therapy, refer to (Gottschalk B. , 2004).
3.1.1 Stopping Charged particles, including protons, move through matter and lose energy by undergoing interactions with the electrons of atoms in the material. The “Bethe-‐Bloch” theory of slowing down and stopping of protons was invented to describe these processes in the 1930s and has been refined since its inception (Berger, Inokuti, Andersen, & al, 1993). This theory predicts the rate of slowing down, or energy loss, as a function of energy of the particle and the composition of the stopping material. Therefore, a proton of a given energy traveling through a material with known properties can have its mean range predicted with 1% to 2% accuracy. The reason for this uncertainty is that each proton goes through
7
thousands of collisions with atomic electrons, thereby leading to varying outcomes due to statistical fluctuations. Protons lose energy faster as they slow down, eventually depositing the greatest amount of dose just before they stop in what is known as Bragg’s Peak. In Figure 2 below, the effects of a high energy vs. a low energy proton beam are demonstrated. As energy increases, the depth of the Bragg’s Peak increases proportionally as well.
The Effect of Varying Energy on Depth of Bragg's Peak Low-‐Energy Protons
Dose
High-‐Energy Protons
Depth (cm)
Figure 2: The Effect of Varying Energy on Depth of Bragg’s Peak
3.1.2 Scattering Although protons travel a relatively straight line through tissue (Wilson, 1946), they do undergo some degree of scattering when traveling through matter. A spread in angular distribution is created through thousands of small electrostatic deflections by atomic nuclei through what is known as multiple coulomb scattering. The result of this effect is a multiple scattering angle, with an approximately Gaussian distribution. Molière’s theory allows us to
8
calculate for any given case the width of the Gaussian created. By using this theory, the materials necessary to create a Bragg’s peak of a certain depth and size from an incoming beam can be calculated.
3.1.3 Nuclear Reactions Besides stopping and scattering, protons also undergo collisions with atomic nuclei, which is known as nuclear reactions. Nuclear reactions are relatively rare; approximately 20% of 160 MeV protons suffer just one collision, compared with the thousands of stopping and scattering interactions as they slow down and stop in matter (Delaney & Kooy, 2008). These nuclear reactions create secondary particles such as secondary neutrons and protons, and also less frequently, heavy charged particles such as α particles. Due to the low probability, it is very hard to obtain good statistical precision for these events in Monte Carlo simulations. 3.2 Facility Design A typical proton therapy facility is outlined in Figure 3. The cyclotron, or proton beam accelerator, is larger and much more expensive than a traditional electron linear accelerator. Therefore, it is economically efficient to have multiple treatment rooms set up to work from one incoming beam. The proton beam exits the cyclotron and travels through a beam transport system, which divides the incoming beam into multiple treatment rooms. A rotating gantry or a fixed beam setup provides the exit for the beam in the treatment room. In either case, upon exiting the transport system, the beam is shaped to cover a Planned Treatment Volume (PTV) through a series of components in what is known as the ‘nozzle’. For a more in-‐depth overview of the nozzle, see Section 3.3. The treatment room also has a table and other patient positioning hardware required for stabilization of the patient, which is crucial for accurate tumor irradiation. For quality assurance, water
9
Figure 3: Loma Linda Proton Treatment Center Floor Plan (Arzt, 2009) phantoms are used because of their ease in setting up, as well as the ease in which monitor chambers can be freely moved through the water to measure the characteristics of a certain beam setup. In this model, a cylindrical water phantom was used due to its similar properties to human tissue. 3.3 Nozzle As discussed in the Section 3.2, the beam is generated by a cyclotron and must be carried by a beam transport system to the treatment room where the patient is held. Upon exiting the system, the proton beam size is on the order of millimeters, and hence must be spread out to treat any typically sized tumor. One of the necessary functions of the nozzle is to spread the small beam out laterally and depth wise to cover the extent of the PTV. There are two methods to accomplish this spreading out of the beam. Scanning uses deflecting magnets to scan the beam over the PTV. Scattering or Passive techniques use arrangements of scatterers and degraders. Passive scattering techniques dominate clinical use, but more
10
complex scanning techniques can do better in principle and the trend is towards complex scanning techniques. However, the focus of this work will be on passive techniques because of its more prevalent use in the clinical world today (Delaney & Kooy, 2008). In 1977, Koehler et al. introduced a commonly used passive technique by the concept of double-‐ scattering system, which uses a tandem set of scattering foils to efficiently produce a uniform, large area proton treatment beam. This passive type of a double-‐scattering system is still in frequent use today (Fontenot, Newhauser, & Titt, 2005). Because of the use of the double-‐scattering system in many clinical facilities today along with design programs available to the public, the double-‐scattering passive technique was used in this thesis to spread out the incoming proton beam to a uniform treatment field. Section 3.3.1 is a brief overview of the history and development of the double-‐scattering system.
3.3.1 The History and Development of the Double-‐Scattering System Recall that stopping power for protons and all charged particles depends on interactions with atomic electrons and scattering arises from interactions with atomic nuclei. Since the effect of each of these different interactions depend on the target material that is used, high-‐ Z and low-‐Z materials act differently. Because of this, low-‐Z materials are more effective in slowing protons down, or ‘degrading’, whereas high-‐Z materials scatter much more strongly (Delaney & Kooy, 2008). It is important to note that there is no such thing as a perfect scatterer or degrader. In other words, while high-‐Z materials such as lead are meant to scatter, they also degrade the energy of the beam. Also, while low-‐Z materials such as Lexan are meant to degrade, they also scatter the beam. The properties that different high-‐Z and low-‐Z materials have when interacting with proton beam are essential into understanding the double-‐scattering system, which is used in this work to model the proton therapy nozzle.
11
Figure 4: Single Scatterer (Gottschalk D. B., 2007)
3.3.1.1 Single Scattering As seen above in Figure 4, in a single scattering system, a high-‐Z material such as lead is used to spread the raw beam into a broader cylindrical gaussian distribution. In order to be useful in proton therapy, a treatment field must be uniform within plus or minus 2.5% (Delaney & Kooy, 2008). As a property of cylindrical Gaussians, the fraction of protons that fall within this acceptable uniformity is only about 5%. The efficiency associated with using a single scatterer (~5%) is quite low when compared to the efficiency of a double-‐scattering system, which can be on the magnitude of around ~40%. Recall that lead or any material used for scattering also leads to energy degradation. In addition, the single scatterer only smears the Bragg peak to a small extent, leading to a depth-‐wise extent of the Bragg peak to around 0.6 cm (Delaney & Kooy, 2008). This is much less than the size of a tumor, making the single scatterer only useful for tumors with little extent in depth. These issues with efficiency, energy degradation, and the small area of energy deposition can be corrected by the use of a double scatterer, as discussed in the following sections.
3.3.1.2 Range Modulation Creating a wider region of maximum dose is necessary for any proton therapy center. Recall from 3.3.1.1 that the width of the Bragg peak of a monoenergetic proton beam is on the
12
order of 0.6cm, therefore a singular Bragg’s peak is not suitable to treat a wide variety of tumor sizes. The purpose of range modulation in proton therapy is to spread out this narrow dose distribution into a wider region of maximum dose by creating what is known as a Spread Out Braggs Peak (SOBP). This allows treatment facilities to treat a variety of tumor shapes and sizes. The hardware that accomplishes this is known as the Range Modulation Wheel (RMW), as seen in Figure 5. For the purposes of this thesis, only upstream modulators will be discussed, where the modulator is placed as the first scatterer in the beam line’s path through the nozzle.
Figure 5: A compensated upstream modulator, or Range Modulation Wheel (Gottschalk B. , 2004) As seen in Figure 5, the range modulator is typically a fan or wheel-‐shaped object that rotates in the beam path, accomplishing two main objectives. Firstly, it creates the SOBP by using many ‘steps’ with varying thicknesses of Lexan, which is a material that acts as an energy degrader for protons. Recall that lower energy proton beams lead to a
13
shallower Bragg’s Peak. So, the portions of the RMW with thicker amounts of clear Lexan as seen in Figure 5 lead to the shallower portion of the maximum dose distribution of the SOBP in Figure 6. Secondly, but no less importantly, the RMW must create an identical Multiple Scattering Angle (MSA) for each step. Since energy degraders such as Lexan also scatter the proton beam, all Lexan steps must be ‘compensated’ with a scattering material such as lead so that all steps of the RMW produces a uniform MSA. In other words, a uniform MSA means the Gaussian distribution across all steps is identical. Ensuring that the RMW creates a uniform Gaussian is essential for the second scatterer in a double scattering system to work correctly. The thickness of Lead and Lexan in each ‘blade’ or ‘step’ along with the weighted time spent in the beam must be carefully calculated in order to create a uniform MSA across all steps of the RMW. The individual depth dose profile generated by ten ‘steps’ from a RMW is shown below in Figure 6. The All Steps graph demonstrates the overall shape of the SOBP, which was created by summing the results of the ten individual steps. The data used in the input as well as a description of the problem setup used to generate Figure 6 are described in Chapter 4, more specifically, 4.3.1.1.
14
Figure 6: RMW: Generation of SOBP
3.3.1.3 Double-‐Scattering In the double-‐scatterer used in this work, the RMW is placed upstream. So, it is known as the first scatterer, or S1. Like single scattering, the RMW produces a Gaussian shape, and as discussed in the previous section, the polyenergetic proton beam emerging from the RMW is of a uniformly shaped Gaussian distribution. The second scatterer (S2) is placed downstream of S1, and S2 must be non-‐uniform in some way to flatten out the Gaussian distribution. As seen in Figure 7b, the center of S2 uses a scattering material (Lead) to spread out the central intensity of the incoming Gaussian beam. Also, the edges are compensated with Lexan, a low-‐Z degrader, which decreases the energy of the more lateral protons to create a cross-‐sectionally uniform Bragg’s Peak inside of the patient. By increasing the proportion of protons that fall within the useful radius, the efficiency of a given nozzle increases. For instance, the efficiency is around 40% for a double-‐scattering system versus only 5% for single scattering systems (Delaney & Kooy, 2008). The program
15
Nozzle Everything Upstream (NEU) was used in this work to create an efficient double-‐ scattering system.
Figure 7: Double-‐Scattering Design
(Gottschalk B. , 2004) These three figures from Nozzle Everything Upstream (NEU) show a) a 2D view of the RMW, with a lead strip on the left acting as a compensator and Lexan on the right side acting as an energy degrader b) the non-‐uniform second scatterer, composed of lead in the middle to spread out the gaussian and a low-‐Z material in the peripheral regions to ensure a flat distribution and c) the resulting SOBP
3.4 Other Components of a Proton Therapy Nozzle When all of the steps of the RMW are used to create a SOBP, it is defined as fully modulated, which means that it is the longest depth-‐wise SOBP capable of being created for that particular step size. By using a technique known as intensity modulation, the beam can be set to only pass through certain steps of the RMW, creating a thinner SOBP. Also, range shifters, which could be an adjustable column of water within the nozzle, can be used to shift the peak to a more shallow depth. Proton therapy nozzles that use the passive scattering technique commonly have various RMWs. By using the different RMW’s built into the treatment head in combination with range shifters, any extent of tumor size and depth can be treated in each unique clinical case (Delaney & Kooy, 2008).
16
3.5 Impacts of Different Nozzle Designs The scattering system and overall design of nozzles varies from facility to facility. The various designs of nozzle components such as collimators and scattering systems are not universal. This is important to note when discussing Monte Carlo calculations, as the differences in nozzle design will render results from one facility not useful for any other facility. It is also important to note that the secondary neutron dose to a patient is primarily contributed from the nozzle design, and not from the patient (Polf & Newhauser, 2005).
17
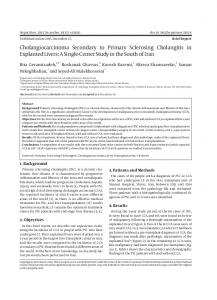
CHAPTER 4: MCNPX MODEL OF PROTON BEAM THERAPY This chapter describes a treatment room model containing a fixed nozzle and discusses tests performed to meet the basic quality control standards of field uniformity and symmetry. 4.1 Nozzle The nozzle set up created in MCNPX (Figure 8) consists of the (A) incoming proton pencil beam, which is in a vacuum. Next, the double-‐scattering system made of components (B) and (C) serves to spread out the incoming pencil beam to a wider radius in order to be useful for a variety of tumor shapes and sizes. A mid-‐base plate (D) and pre-‐collimator (E) serve to eliminate outscattered protons, also providing support for the nozzle casing (F). Finally, the final aperture, or snout, is composed of components (G), (H), and (I), which all serve to determine the final cross-‐sectional shape of the field at the treatment isocenter. This nozzle design remained the same for the problems computed in this work.
Figure 8: The Nozzle View of the proton therapy nozzle as designed in MCNPX, showing the following components: (A) The incoming proton beam in a vacuum, B) the Range Modulation Wheel, (C) a Range-‐compensated scatterer, (D) A mid-‐base plate, (E) the Pre-‐collimator, F) Nozzle Casing, (G) Snout base-‐plate, (H) Snout, and (I) Final aperture. 4.2 Proton beam The proton beam is based on data from clinical proton therapy facilities, most specifically, the data made available in the program Nozzle Everything Upstream (NEU) by Dr.
18
Gottschalk of Harvard University (Gottschalk B. , 2009). Table 1 displays the section from the NEU input file that pertains to the proton beam, and the original input deck can be found in Appendix B.1.
Table 1: Proton Beam Data =============================================================== Measurements at IBA on March 1997: E = 231.0 MeV, DE/E = .26%, rms = .07% 300. cm from source to Bragg peak (wild guess: BG 13OCT03) 34 .10000E+31 .00000E+00 # pts, yp1, ypn 3.3900 6.4900 9.3900 12.3800 15.4800 18.5900 21.5900 cm H2O 24.3800 27.2900 29.5900 30.8800 31.5900 31.8900 32.1900 32.3900 32.6900 32.8900 32.9900 33.0900 33.1900 33.3900 33.5900 33.7900 33.9900 34.1900 34.3900 34.5900 34.7900 34.9900 35.1900 35.3900 35.5900 35.7900 35.9900 .2565 .2715 .2802 .2879 .2963 .3073 .3224 rel dose .3444 .3849 .4533 .5412 .6464 .7294 .8582 .9521 .9786 .8316 .7233 .5914 .4424 .2001 .0698 .0180 .0037 .0015 .0004 .0000 .0000 .0000 .0000 .0000 .0000 .0000 .0000 =============================================================== (Gottschalk B. , 2009) The mean energy of the beam was set to 231.0 MeV, with a relative energy spread of .26%, or .6006 MeV according to the data in Table 1. The incoming beam should have a positional FWHM on the order of millimeters to around one centimeter (Titt, Zheng, Vassiliev, & Newhauser, 2007) (Zheng, Newhauser, Fontenot, Taddei, & Mohan, 2007). However, the source was modeled as a directional point source in a vacuum, as NEU assumes that the incoming beam is an ideal pencil beam (Gottschalk B. , 2009). The beam source was created in vacuum (Figure 8) to maintain both the energy and positional spread of the incoming beam. Figure 9 below shows the input deck used in MCNPX to define the proton source.
19
sdef axs 0 0 1 dir 1 par=h vec 0 0 1 erg=d1 x=0 y=0 z=-‐249 sp1 -‐4 .6006 231 Figure 9: MCNPX Source Definition Input cards
4.3 Components of Nozzle
4.3.1 Double scattering system The double-‐scattering system is shown in Figure 8 denoted as (B) and (C). It was designed using a program called Nozzle Everything Upstream (NEU), which accurately designs passive scattering systems to meet clinical specifications (Gottschalk B. , 2009). This program designs a double scattering system around user-‐defined machine parameters to produce a desired field radius, depth, and modulation. The goal of the double-‐scattering system is to create a field wide enough to treat most tumor sizes. The protocol requires that this spread out proton field be cross-‐sectionally uniform along the extent of the SOBP to within 5% (Delaney & Kooy, 2008). Appendix A.1 shows the output file generated by NEU that was used to define the specifications for the double-‐scattering system in this thesis.
4.3.1.1 Range Modulation Wheel (RMW) One ‘step’ of the RMW is seen in Figure 8 as component (B). The RMW is used to modulate the penetration depth, and it is also referred to as a scattering-‐power-‐compensated RMW. For a more detailed discussion on range modulation wheels, the reader is referred to Section 3.3.1.2 or (Chu, Ludewigt, & Renner, 1993). Since MCNPX is incapable of moving geometry, all twenty-‐five steps had to be modeled and run individually. Each step was individually weighted according to data given in NEU that would result in a flat dose along the SOBP region of maximum dose. Results from all steps were compiled, thereby simulating the overall effect of the RMW and creating a uniform SOBP. The data from NEU used for all twenty-‐five steps are shown below in Table 2. The complete original input deck from NEU is provided in Appendix A.1 (Gottschalk D. B., 2007).
20
Table 2:
RMW Data
Figure 10: Bragg’s Peak from Steps of RMW
21
-"!!#'&(%
,"!!#'&(%
!"#$%&'()%
+"!!#'&(%
*"!!#'&(%
("!!#'&(%
)"!!#'&(%
&"!!#'&(%
!"!!#$!!% !%
+!%
&!!%
&+!%
)!!%
)+!%
(!!%
!$*+,%&--)%
Figure 11: SOBP The depth dose profile generated by each of the twenty-‐five steps of the RMW is shown in Figure 10. Summing the results of the individual steps of Figure 10 creates Figure 11. It is important to note that the thickest step degrades the energy of the beam and produces the proximal portion of the maximum dose region of the SOBP, which is approximately at a depth of 60mm.
4.3.1.2 Range Compensated Scatterer: S2 The incoming proton beam on S2 is of uniform Gaussian shape, and S2 is used to spread out the gaussian distribution of the proton beam to create a uniform and symmetric field of protons at the isocenter. S2 must be non-‐uniform in some way in order to create a flat beam energy and positional profile from the incoming beam’s Gaussian distribution of protons. In Figure 12, which depicts component (B) from Figure 8, the incoming Gaussian proton beam is moving from left to right. The blue region in the center of Figure 12 is composed of lead, a high-‐Z scattering material, and serves to scatter out the high intensity central region of the incoming Gaussian beam, whereas the red region in the periphery is composed of Lexan, an
22
energy degrading material, which ensures the uniformity and symmetry of the proton field when it reaches the isocenter.
Figure 12: Range Compensated Scatterer: S2 A close-‐up of the range compensated scatterer from Figure 8, component (B)
4.3.2 Collimators Due to its use in clinical applications, brass was selected as the substance of choice for collimators. In clinical practice, proton therapy nozzles accept from one to four final collimator plates, each 2 cm thick, where the appropriate number of plates is based on the impinging proton range (Delaney & Kooy, 2008). In this setup, the proton beam has a nominal energy of 230 MeV at the nozzle exit with a maximum range of 25.8 cm in water. The corresponding range of this beam in solid brass of density ρ= 8.49 g cm3 was calculated to be 5.91 cm using the Stopping Range of Ions in Matter (SRIM) program (Ziegler, 2010). Hence, a collimator thickness of 6 cm is necessary. However, for good measure, all collimators were set to be 8 cm thick. Collimators are seen in Figure 8 as (D) and (E).
23
4.3.3 Snout The snout serves to support the final aperture and also is designed to block unwanted protons that would fall outside of the PTV. The snout is seen in Figure 8 as components (F) and (G).
4.3.4 Final aperture The final aperture, composed of brass, serves to eliminate protons heading outside of the PTV. Also, a range compensator can be used along with the final aperture to tailor the dose in depth by shifting more or less proton range depending on what part of the PTV a particular proton beam is aimed at (Delaney & Kooy, 2008). The final aperture is seen in Figure 8 as component (H). 4.4 Primary and Secondary Dose Calculation in MCNPX Tallies in MCNPX can be utilized in different ways to generate various quantities of interest for a given problem. In this work, the focus of tally use lies in the calculation of primary and secondary dose. Dose is defined as energy absorbed per unit mass and its units are in Grays (Gy). In this work, proton dose is quantified in Gy. On the other hand, Dose equivalent is given in units of Sieverts (Sv), which differ from Grays by the inclusion of the biological effects that certain particles of varying kinetic energy have when they impart their energy on tissue, otherwise known as a particles Relative Biological Effectiveness (RBE). Dose equivalent is commonly used with particles that possess a varying RBE over a range of energies, typically neutrons and photons. For each segment of energies with the same RBE, a Quality Factor (QF) is assigned in order to calculate Sieverts. The conversion between Grays and Sieverts is:
Grays x Quality Factor = Sieverts.
At this time, there is enough evidence to suggest that the RBE for protons remains virtually independent of incident proton energy. In fact, most treatment facilities have
24
adopted a quality factor of 1.1 for all energies, tissues, dose levels, and positions within the SOBP (Delaney & Kooy, 2008). Due to the uncertainties of QF values for protons of varying energies, proton dose equivalent has not been calculated in this work and instead proton dose was tabulated in units of Grays. However, for neutrons, these QF’s are well established and are used in dose calculations. When calculating secondary dose, it is necessary to include the various QF’s to account for the RBE of different energy neutrons. It should be noted that in proton therapy, photons account for an additional 10% of secondary dose not included in neutron dose calculations (Agosteo, Birattari, Caravaggio, Silari, & Tosi, 1998). However, in this work, only neutrons were taken into account. If one wanted to calculate photon dose, the method as described in 4.4.2 could be utilized. The following sections discuss the methods for primary dose calculations from the incident protons as well as secondary dose calculations from neutrons.
4.4.1 Calculation of Primary Dose: The F6 Tally Primary dose, or dose due to protons, is quantified in units of Gy by the use of the F6 tally in MCNPX. The F6 tally calculates the absorbed dose averaged over a cell and gives results in energy absorbed per unit mass, or MeV/g/s/starting particle. For protons, a conversion factor of 1MeV /g= 1.602E-‐10 J/kg is used to convert the F6 tally results from MeV/g/s/starting particle to the conventional units of absorbed dose in J/kg/starting particle, known more commonly as Grays (Gy) per starting particle. Figure 13 shows the portion of the MCNPX input deck that pertains to calculation of Primary Dose. F6:h 21 $ proton energy deposition FM6 1.602e-‐10 $ Gy*g/MeV
Figure 13: Calculation of Primary Dose in MCNPX
25
In Figure 13, cell 21 was defined to be the tumor volume. This portion of the input deck is setting up an F6 tally and also using the conversion factor, thereby giving results in Gy/s/source particle.
4.4.2 Calculation of Secondary Dose: Neutron Dose Equivalent Neutron Dose Equivalent (NDE) was found to be the defining measure for secondary dose in benchmark works in proton therapy dose calculations (Zheng, Newhauser, Fontenot, Taddei, & Mohan, 2007) (Polf & Newhauser, 2005) (Mesoloras G, 2006) (Tayama, Fujita, Tadokoro, Fujimaki, Sakae, & Terunuma, 2006) (Titt, Zheng, Vassiliev, & Newhauser, 2007). NDE, also referred to as H, is given in units of Sieverts (Sv). The equation for the calculation of NDE is as follows: NDE = H = ! E ! h! , where φE is the neutron spectral fluence per incident proton and hϕ is the fluence-‐to-‐dose equivalent conversion coefficient as a function of neutron incident energy. It is important to note that hϕ accounts for the QF of various neutrons. Another common defining measure for secondary dose in benchmark calculations is Neutron Dose Equivalent per Therapeutic Absorbed Dose, or simply H/D. The therapeutic absorbed dose, D, is the dose delivered by protons to the tumor volume, and is given in units of Grays (Gy), also Joules/kilogram, which is energy deposited per unit mass. Therefore, H/D is given in the base units of Sv/Gy (neutron Sieverts per proton Grays). For a detailed review on the methodology of NDE and H/D dose calculations, refer to (Zheng, Newhauser, Fontenot, Taddei, & Mohan, 2007).
4.4.2.1 Neutron Dose Equivalent: The F4 Tally and Converting Flux to Dose NDE is the dose equivalent of neutrons at a in a tissue weighted by a distribution of quality factors related to the Linear Energy Transfer (LET) distribution of radiation at that point (Pelowitz, 2005). For neutrons, the F6 tally is of no use to calculate dose equivalent unless the quality factors are incorporated. Fortunately, in MCNPX, a built in dose function includes
26
these factors in NDE calculations automatically by the use of flux-‐to-‐dose conversion coefficients. The built-‐in flux-‐to-‐dose conversion coefficients in MCNPX can be found in National Council on Radiation Protection’s NCRP-‐38 and the International Council of Radiation Protection’s ICRP-‐21 publications. By using a flux tally along with this dose function, MCNPX can calculate neutron dose equivalent over the volume of a cell of interest at any given point. In MCNPX, the flux volume tally is defined as F4. An example of a neutron tally is shown in Figure 13. Ideally, NDE can be calculated at any point within the patient or in the treatment room and is used to quantify the total negative effect of a treatment, as secondary neutron dose is believed to increase the risk of secondary cancers. Regardless of location, in order to calculate NDE, a surface delimiting the volume of interest is defined and used in the MCNPX input deck for neutron dose calculation, as seen in Appendix B.1. This location could be inside or outside of the patient. For locations outside of the patient but in the air of the treatment room, simple ‘neutron detectors’ were set up as spherical regions with identical tissue composition as the target tissue and the flux-‐to-‐dose tallies were used to estimate NDE at locations at various angles with respect to the isocenter. F14:n 1010 FC14 neutron flux averaged over whole phantom DF14 IU=2 IC=20 Fm14 2.7778E-‐4 F24:n 21 FC24 neutron flux averaged over tumor DF24 IU=2 IC=20 Fm24 2.7778E-‐4
Figure 14: Calculation of Secondary Dose in MCNPX In Figure 14, tallies 14 and 24 are type 4 flux tallies. The DF card specifies a dose function, instructing MCNPX to bin neutrons according to their spectral fluence, φE, and MCNPX automatically multiplies the neutron spectral fluence the fluence-‐to-‐dose equivalent
27
conversion coefficients, hϕ, defined by the IC card. With IU=2, the units are set to international, or Sv/h/source particle and IC=20 tells MCNPX to use the NCRP-‐38 values for flux-‐to-‐dose conversion coefficients. The Fm card is a tally multiplier that gives results in Sv/s/source particle for a direct comparison to proton tally results, which have units of Gy/s/source particle.
4.4.3 Visualization of Dose: Mesh Tallies Mesh tallies can be used to compare different particles contribution to overall results. Mesh tallies are also useful for visualizing tally results such as particle tracks and energy deposition throughout the problem geometry. An example of a mesh tally input deck is seen in Figure 13. tmesh rmesh1:h cora1 -‐25 25i 25 corb1 -‐25 25i 25 corc1 -‐250 140i -‐30 c Proton flux throughout problem endmd Figure 15: Mesh Tally Input Deck The rmesh card specifies a Type 1 tally with rectangular coordinates, where its default is a flux-‐based tally, which gives results in purely flux, or number of particles/cm2/second per source particle. The cora and corb cards define the mesh that is to be created on the x and y-‐axis, respectively. The corc card completes the voxels to be tallied by defining three surfaces in the z direction. When the PEDEP option is used after the rmesh card, it creates a type of tally analogous to the energy deposition, or F6 normal tally, with units as MeV/cm3/source particle. One usually does not desire to calculate dose from mesh tallies, however, it is a useful mechanism in visualizing results and comparing energy
28
deposition from different types of particles. There is a trade-‐off between local details and statistical uncertainty, as standard deviation values increase as the mesh size decreases. A Type 2 tally allows for the calculation of weights of a source, and is also known as a source mesh tally. Figure 16 shows the results of the tally from Figure 13. The entire input deck used in this problem is provided in Appendix B.2
Figure 16: Results of Type 1 Proton Flux Mesh Tally
29
CHAPTER 5: MONTE CARLO SIMULATIONS, RESULTS AND DISCUSSION MCNPX v2.6.0 was used to perform simulations and generate results. Proton and neutron particle physics were used, depending on the calculation, and the number of particles in each simulation as well as computer time will be described in each subsection. Recall from Chapter 2 that the Range Modulation Wheel (RMW) is a spinning component in the nozzle. MCNPX does not allow for moving geometry. In the following calculations, each step was weighted according to the time spent in the beam, and results were generated by the sum of the results from all steps. All calculations were run on a Georgia Tech Linux cluster with 23 nodes and 184 cores (AMD Opteron running at 2.0 GHz). 5.1 Simple Water Phantom Setup The geometrical setup of the simple phantom problem is shown in Figure 17. The results generated from this setup were used to determine central axis (CAX) depth-‐dose configuration as well as to confirm proper uniformity of the beam. The water phantom (J) is aligned on the Z-‐axis with a radius of 30 cm, extending from 0-‐30 cm in the z direction.
Figure 17: Simple Phantom Setup View of the double scattering proton therapy nozzle, showing (A) Incoming proton beam in a vacuum (B) Range Modulation Wheel, or S1 (C) Range-‐compensated scatterer, or S2 (D) a mid-‐base plate for structural support (E) Pre-‐collimator (F) Snout base-‐plate (G) Snout (H) Final aperture, creating desired field shape and size (I) Concrete wall of treatment room and (J) Water phantom.
30
5.1.1 Proton Depth-‐Dose Distribution: Ensuring a Flat Region of Maximum Dose The fully modulated SOBP was generated by running all 25 steps of the RMW as separate problems with the setup described above. The total proton depth-‐dose distribution was then tabulated from the sum of each step by using a 10x10 field, the size of which is verified in 5.1.2. A F6 tally was used as described in 4.4.1.1, giving results in Gy/source particle. The tally surfaces divided the cylindrical water phantom in the direction of the proton beam by z-‐plane increments of 0.1 cm. The tally cross-‐sectional area was defined to have a radius much smaller than the phantom to neglect the peripheral protons spreading by setting the tally to calculate dose along the central axis with a diameter of 5cm. The results of these conversions are plotted in Figure 18. The highest standard deviation for calculations was no greater than two percent, with computer running time at 99.40 hours on the for all 25 steps, with 3 million particles run for each step. Standard deviation bars are also displayed in Figure 18, but are so small that they may not be easily observed. 7.00E-‐13
Dose (Gy/source par?cle)
6.00E-‐13 5.00E-‐13 4.00E-‐13 3.00E-‐13 2.00E-‐13 1.00E-‐13 0.00E+00 0
50
100
150
200
250
300
Depth (mm)
Figure 18: Proton Depth vs. Dose Curve
31
5.1.1.1 Neutron Depth-‐Dose Distribution Neutron dose was calculated as described in 4.4.2. So, an F4 tally was run with the built in dose function along with the use of tally multipliers to give results in Sv/source particle, or the dose due to neutrons generated per starting particle. The highest standard deviation for calculations was no greater than six percent, with computer running time at 50.8 hours for all 25 steps, with 3 million particles run for each step. The results are shown in Figure 19, with the included standard deviation bars in black. 8.00E-‐13 Dose (cSv/source par?cle)
7.00E-‐13 6.00E-‐13 5.00E-‐13 4.00E-‐13 3.00E-‐13 2.00E-‐13 1.00E-‐13 0.00E+00 0
50
100
150
200
250
300
Depth (mm)
Figure 19: Neutron Depth vs. Dose Curve
5.1.1.2 Discussion of Obtained Results From the tally computation times, it is apparent that proton dose tallies take longer to calculate than the neutron dose tallies. Recall that the nuclear reactions that generate secondary neutrons happen with significantly less occurrence than scattering and stopping reactions of protons (Section 3.3.1). It follows that statistical uncertainty would be higher and the computation time would be shorter for the neutrons due to the decreased amount
32
of collisions to have to track. Therefore, less secondary particles would lead to a larger statistical uncertainty in the calculation of secondary dose.
5.1.2 Useful Radius: Ensuring Cross-‐Sectional Uniformity of Dose In order to verify the setup used, it is important to ensure that the proton field created by the nozzle is uniform cross sectionally in addition to ensuring a proper SOBP shape, as done in section 5.1.1. The useful radius, r95, is defined as the radius at which the proton dose distribution is uniform to +/-‐ 2.5% cross-‐sectionally in the field (Gottschalk B. , 2004). The useful radius determines the maximum cross-‐sectional field size that can be used in by a given treatment nozzle setup, and calculations were performed without the snout or final collimators in order to determine the size of the maximum useful radius. The useful radius was calculated using cylindrical tallies along the proximal, middle, and distal portions of the spread out Bragg’s peak within the water phantom to ensure a cross-‐sectionally uniform dose distribution through the SOBP. The useful radius was calculated in the phantom in positions according to the results of the central axis (CAX) depth vs. dose tallies shown in section 5.1.2 using cylinders with 1mm increments in radius to give results from 0.1cm to 15cm, as defined by cell cards 500 – 648 in Appendix B.1. A cross-‐sectional view of the cylindrical surfaces used to calculate useful radius is shown in Figure 20. Three tallies were utilized with these surfaces to calculate the useful radius in proximal, middle and distal depths of the SOBP, which were chosen to be 6.05, 15.55, and 25 cm in the phantom, coinciding with the data shown by the proton CAX dose distribution shown in Figure 18. The graphical results of the useful radius shown in Figure 20 define the maximum useful radius at the proximal, middle, and distal depths of the SOBP by setting up a window +/-‐ 2.5% to determine the maximum cross-‐sectional field size that can be used by the setup defined in this work. It should be noted that the smaller radii have a larger standard deviation. Neglecting the smaller useful radii (those up to 2cm), the highest
33
standard deviation for calculations was no greater than five percent, with computer running time at 73.49 hours for all 25 steps, with ten million particles run for each step.
Dose (Gy/source par?cle)
7.00E-‐03 6.00E-‐03 5.00E-‐03 4.00E-‐03 3.00E-‐03 2.00E-‐03 1.00E-‐03 0.00E+00 0
20
40
60
80
100
120
140
160
Radius of Field (cm) 6CM
15.55CM
25CM
Figure 20: Useful Beam Radius
5.1.3 Discussion of Useful Radius Results The results generated from MCNPX for the useful beam radius are compared to the data gathered from NEU to validate the accuracy of the double-‐scattering design used in this work. In Figure 18, it should be noted that the results for the proximal and middle depths are practically indistinguishable. Keep in mind that these results were attained without the use of a collimator. Having a large treatment radius adds to the usefulness of a proton therapy beam. By adding a collimator, the radius of the beam can be tweaked to fit many different sizes of tumors. Recalling from section 5.1.2, the useful radius is defined as the radius as which the proton dose distribution is uniform to +/-‐ 2.5% cross-‐sectionally across the field. Using MCNPX, the useful radius was found to be 10.1cm. However, the useful
34
radius found by using the same beam and double-‐scattering data was found by NEU to be 12.1cm. The useful radius found by MCNPX confirmed that all collimators should taper the field size down to at most 10 cm. 5.2 Neutron Dose Equivalent Setup The original nozzle design with the water phantom was slightly modified for use in primary and secondary dose calculations through the addition of neutron tallies. These tallies were used to calculate the NDE at points distant from the water phantom, as seen in Figure 21 denoted as E, F, and G. Nine neutron detectors were placed at distances of 50, 100, and 200 cm away from the isocenter, with three parallel, three at 45º, and three at 90º with respect to the beam. Additionally, the final collimator was modified to have a diameter of 5cm.
Figure 21: NDE Problem Setup View of the modified double scattering proton therapy nozzle, showing A) the nozzle, as described in Chapter 4 B) the concrete wall of treatment room C) the final aperture, modified to be 5cm in diameter D) the water phantom and tumor region and E,F,G) the neutron detectors used to measure secondary neutron dose distant from the isocenter.
35
5.2.1.1 Defining tumor location In order to calculate NDE, it is important to define the target volume appropriately so that the region of maximum dose is completely encompassed by the tumor. In clinical situations, one would adjust the energy to the size and shape of the tumor to define the target volume. However, due to the nature of Monte Carlo simulations as well as for the sake of simplicity, it was done otherwise. The first seven steps of the RMW from the simple water phantom setup was used to create a partially-‐modulated SOBP as shown in Figure 22. The region of maximum dose was arbitrarily chosen to be as at least 80% of the maximum dose. A dose of 5.00E-‐13 Gy/proton indicates around 80% of the maximum dose, which was then arbitrarily chosen to define the maximum dose region. As seen in Figure 22, the resulting ‘treatment area’ with dose greater than 5.00E-‐13 Gy/source particle was found to be from 195 to 260 mm in the z-‐direction. 7.00E-‐13
Dose (Gy*proton-‐1)
6.00E-‐13 5.00E-‐13 4.00E-‐13 3.00E-‐13 2.00E-‐13 1.00E-‐13 0.00E+00 0
50
100
150
200
250
300
350
Depth (mm)
Figure 22: SOBP for NDE Calculations
36
One would expect the depth-‐wise region of maximum dose to remain unchanged from the data in Figure 20, and the cross sectional area to have a diameter of 5 cm, which would match the collimator. This was investigated using mesh tallies, and the results are shown in Figure 23. The results from the calculations concerning tumor location depicted in Figure 23 showed that the tumor region was correctly defined from 19.5 cm to 26 cm in the z-‐ direction. However, the radius that encompasses the 80% dose regions was found to be 1.5cm, which is smaller than the final aperture size of 2.5cm. It should be noted that the radial size of the aperture in the collimator is not tantamount to the size of the treatment area. The smaller radius of dose deposition can be explained by lateral dose falloff (Delaney & Kooy, 2008). There are two reasons that lead to a more significant lateral dose fall off. Firstly, the farther away the final aperture from the patient, the larger the lateral dose falloff. Since scattering occurs within the patient, the dose gradient will be worse in deeper targets, no matter what the nozzle design. Hence, it is expected that the PTV has a radius smaller than the final aperture due to these factors. For additional information on lateral penumbra, the reader is referred to (Arduini, et al., 1996).
37
Figure 23: Verification of Dose Delivered to Tumor Region
The dotted line represents the tumor volume as defined by the tallies in the problem
38
5.2.2 Results for Neutron Dose Equivalent Setup Results from simulations are presented in Table 3. Table 3: H/D Values NDE [mSv/Gy] Phantom 15.01 Tumor 12.49 50 cm parallel 1.42* 100 cm parallel 0.62* 200 cm parallel 0.24* 50 cm @ 90 degrees 1.31 100 cm @ 90 degrees 0.04* 200 cm @ 90 degrees 0.01* 50 cm @ 45 degrees 2.16 100 cm @ 45 degrees 0.96* 200 cm @ 45 degrees 0.33*
Standard Deviation 1.28% 3.90% 13.51% 20.52% 33.03% 9.84% 52.05% 100.00% 10.04% 13.98% 23.29%
* Unreliable due to high statistical uncertainties The highest standard deviation for calculations was found to be significant, especially in the more distant and oblique angles of the detector from the phantom. The computer running time took over three days for 7 steps, with 12.5 million particles run for each step. The neutron tally locations were based off of (Polf & Newhauser, 2005) to provide an outline for H/D calculations as well as to provide a smoother comparison of the two works in order to confirm the methods used in this work. The reader is referred to Section 4.4.2 or (Zheng, Newhauser, Fontenot, Taddei, & Mohan, 2007) for more information on the method used for NDE calculations. A comparison of the H/D values found in this work to Polf and Newhauser is shown in Table 4.
39
Table 4: Comparison of NDE results Phantom Tumor 50 cm parallel 100 cm parallel 200 cm parallel 50 cm @ 90 degrees 100 cm @ 90 degrees 200 cm @ 90 degrees 50 cm @ 45 degrees 100 cm @ 45 degrees 200 cm @ 45 degrees
This work 5cm SOBP, 230 MeV H/D [mSv/Gy] 23.68 +/-‐0.30 19.58 +/-‐0.84 2.30 +/-‐0.31 0.98 +/-‐0.20 0.36 +/-‐0.12 2.08 +/-‐0.21 0.06 +/-‐0.03* 0.02 +/-‐0.02* 3.38 +/-‐0.34 1.53 +/-‐0.21 0.52 +/-‐0.12
Polf and Newhauser, 2005 8.5cm SOBP, 160 MeV H/D [mSv/Gy] 2.30 +/-‐0.85 0.88 +/-‐0.32 0.51 +/-‐0.19 5.10 +/-‐1.90 1.90 +/-‐0.70 1.40 +/-‐0.53 6.30 +/-‐2.30 1.80 +/-‐0.64 0.63 +/-‐0.23
* Unreliable due to high statistical uncertainties Considering that the relative standard deviation values from Polf and Newhauser have the same values for all points, it is assumed that that work included the use of importance maps and variance reduction. Additionally, it is important to make note of differing beam energy, width of the spread out Bragg’s peak, nozzle components, and other properties that have a direct impact on H/D values as discussed in (Zheng, Newhauser, Fontenot, Taddei, & Mohan, 2007). Polf and Newhauser not only used a different nozzle design, but also used a lower beam energy, larger SOBP, and also had a different collimator size. In spite of these differences, the results are close enough to indicate agreement within an order of magnitude, thereby providing some evidence to the validity of results generated in this work by MCNPX. 5.3 The MIRD Phantom Setup In this setup, a more realistic and detailed patient/tumor model was incorporated into the MCNPX setup by the use of a patient phantom model from the Medical Internal Radiation Dose (MIRD) Committee. Proton therapy is commonly utilized to treat brain tumors and benign growths such as arteriovenous malformations, pituitary adenomas, low and high-‐
40
grade gliomas, and other common types of brain malformations (Delaney & Kooy, 2008). The MIRD Phantom is a simplified phantom of a human body that is commonly used in nuclear medicine dosimetry calculations in Monte Carlo programs (ORNL, 2002) (Cristy, 1980). Due to this fact, the MIRD phantom was used for primary and secondary dose calculations resulting from a hopelessly oversimplified brain treatment from proton irradiation. Although the MIRD phantom is a simplified model of the human body, it serves well in this work to demonstrate basic calculations of primary and secondary dose when using a phantom. The amorphous ORNL Age-‐10 MIRD phantom used in this problem and additional phantoms ready for use in MCNPX are all freely available for distribution on the Computational Medical Physics Working group’s website (CMPWG, 2007).
5.3.1 Problem Setup
Figure 24: Problem Setup with the ORNL Age 10 MIRD Phantom
View of the modified double scattering proton therapy nozzle, showing A) the nozzle, as described in Chapter 4 B) the concrete wall of treatment room C) the final aperture, modified to be 2cm in diameter and D) the MIRD phantom.
41
For this work, the nozzle design was modified by the addition MIRD phantom, as shown in Figure 22. Additionally, the beam axes was changed to travel along the y axis instead of the z axis due to the difficulty of modifying the axes of the complicated MIRD input deck. For this problem, there are a few points to keep in mind. When delivering dose to the brain, it is important to account for dose to many critical organs and tissues such as the acoustic nerve, salivary glands, the brain stem, and many other components of the brain (Delaney & Kooy, 2008). However, for the purpose of this work and due to the simplicity of the MIRD phantom, the spinal cord served as the critical organ of interest. As seen in Figure 23, the MIRD phantom had its spinal cord split into three regions and the neutron dose equivalent was calculated for each of these regions. In order to get good results of neutron dose equivalent in the spine, it is necessary to have the treatment region proximally to the spine, since the forwardly scattered neutrons would then have a greater likelihood of scattering down into the spinal cord.
Figure 25: The ORNL Age 10 MIRD Phantom Regions on interest include A) the Brain and the B) Upper C) Middle and D) Lower regions of the spine/spinal cord.
42
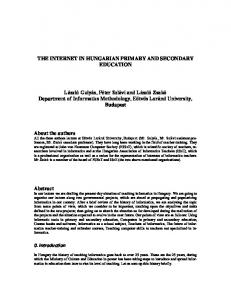
5.3.1.1 Defining tumor location The methodology for defining tumor location is similar to that used in 5.2.1.1. A tumor location was desired to be proximal to the upper region of the spinal cord. This was done to allow the secondary particles created by the proton beam to have a greater chance of scattering into the spinal cord, thereby generating more accurate results by increasing the number of neutrons that would be tallied in the spinal cord region. Referring to earlier data from the water phantom, the shallowest depth of maximum dose distribution was as created by the 25th step of the RMW, its measurements defined in Table 2. This step produced a Bragg’s peak at a depth of 7cm, which is proximal to the upper spinal cord, denoted by (B) in Figure 25. Mesh tallies were used to verify the location of the deposition of dose, thereby allowing proper calculation of the D value for protons. The results of these calculations are depicted in Figures 26 and 27. Similarly to Figure 23 from the NDE Problem Setup, the treatment volume was defined to encompass the 80% isodose line, or the regions in Figure 26 and 27 that encompass the orange to the red areas of dose deposition. Using this method, the treatment area was found to encompass a cylindrically shaped region along the y-‐axis from -‐3.5 to -‐ 2.5 cm with a radius of .75 cm. Additionally, as seen in Figure 27 for the yz plane, the cylinder is parallel to the y-‐axis at a z-‐value of 67.18cm. The neutron dose equivalent, H, was calculated for the whole brain as well as the upper, middle, and lower regions of the spine. Additionally, the proton dose, D, in the treatment area was calculated and used to determine the NDE per therapeutic absorbed dose values, or H/D. The mesh verification calculations for this problem took 36 hours to run 50 million particles.
43
Figure 26: MIRD Phantom: Proton Dose in Tumor Region
44
5.3.2 Results of MIRD Problem Table 5 shows the dose values for protons in the brain tumor region as well as the dose equivalent values for neutrons along the different portions of the spinal regions. Through clinical experience in the Radiation Oncology department at Emory University’s hospital system in Atlanta, a reasonable treatment dose for a brain tumor was found to be 84 Gy. The normalized dose column was based off this value. Table 6 presents the corresponding NDE values.
Table 5: Tabulation of Primary and Secondary Dose Region Brain Tumor Whole Brain Upper Spine Middle Spine Lower Spine
Dose 6.58E-‐13 +/-‐2.57E-‐15 Gy 4.84E-‐12 +/-‐2.13E-‐14 mSv 3.91E-‐12 +/-‐4.19E-‐14 mSv 1.14E-‐12 +/-‐1.44E-‐14 mSv 2.74E-‐13 +/-‐1.10E-‐14 mSv
Normalized Dose 8.40E+01 +/-‐3.28E-‐01 Gy 6.18E-‐01 +/-‐2.72E-‐03 Sv 5.00E-‐01 +/-‐5.35E-‐03 Sv 1.45E-‐01 +/-‐1.84E-‐03 Sv 3.50E-‐02 +/-‐1.40E-‐03 Sv
Table 6: Calculated NDE for the Whole Brain and Spine NDE Standard Deviation Region 7.36 mSv/Gy 0.83% Whole Brain 5.95 mSv/Gy 1.46% Upper Spine 1.73 mSv/Gy 1.66% Middle Spine 0.42 mSv/Gy 4.40% Lower Spine Overall, the results are of acceptable statistical quality. The highest standard deviation was found to be reasonable. The computer running time took over one and a half days, with 12.5 million particles run. In conclusion, the secondary dose is small, but not negligible.
45
Figure 27: MIRD Phantom: Proton Dose in Tumor Region (Zoomed in)
46
It can be seen that the secondary dose is two to three orders of magnitude less than proton dose, which is consistent with the values published in other works considering secondary dose in proton therapy (Mesoloras G, 2006) (Tayama, Fujita, Tadokoro, Fujimaki, Sakae, & Terunuma, 2006) (Zheng, Newhauser, Fontenot, Taddei, & Mohan, 2007) (Polf & Newhauser, 2005). Additionally, as seen in Table 5, a treatment dose of 84 Gy to a samplebrain ‘tumor’ was found to have secondary neutron dose less then one Sievert to all regions of the spinal cord as well as the non-‐tumor region in the brain. Although the MIRD model and sample treatment used for this work was oversimplified, the purpose of this work to establish a method of dose calculations and obtain an estimate of relative doses was achieved.
47
CHAPTER 6: CONCLUSIONS/FUTURE WORK 6.1 Summary and Conclusions The objective of this work was to establish a methodology for evaluating the primary and secondary dose in proton therapy using Monte Caro simulations. Ultimately, this methodology will enable devising more effective proton radiation treatment. In this work, a model for a proton therapy nozzle and a basic treatment area was developed and many calculations were performed, including primary and secondary dose calculations. Additionally, nozzle components were generalized to embody a sample clinical facility by examining and implementing nozzle designs from various works (Polf and Newhauser 2005) (Newhauser, Fontenot, et al. 2007) (Titt, et al. 2007) (Newhauser, Koch, et al. 2005) (Zheng, et al. 2007). The nozzle design underwent baseline simulations to determine the accuracy and usefulness of the model. Tallies were used to determine the SOBP as well as useful radius. Results were then compared to the data in NEU, with good agreement. These calculations confirmed the accuracy of the double scattering system, effectively commissioning the beam so that it could be used in further calculations. The main quantity of interest in this work was the Neutron Dose Equivalent, or H/D, where H is the neutron dose in mSv at any point within the patient or elsewhere and D is the proton dose in Gy. In order to calculate NDE, one must first determine the amount of dose delivered to the treatment volume. Mesh tallies confirmed the region of primary dose, which is mostly determined by the location of the Bragg’s Peak. The treatment volume was aligned with that region and overall proton dose to the tumor region was calculated. Next, tallies representing neutron detectors were set up to provide the necessary data to calculate NDE. Secondary dose was found to be between two and three orders of magnitude lower than primary dose, further providing evidence that secondary dose is relatively small in
48
proton therapy. However, it is not small enough to be considered negligible. In particular, it may present a real concern in pediatric cases, as children are more susceptible to radiation-‐ induced tumors than are adults due to the greater cycle activity of younger cells, among other factors (Hall, 2009) (Delaney & Kooy, 2008). In conclusion, the methodology was developed to design the proton therapy nozzle and perform dose calculations. Baseline simulations were compared to results from existing works. Overall, a methodology for setting up a proton therapy nozzle has been established. A model was developed as closely as possible to real-‐world facilities, and various simulations were performed to quantify the legitimacy of the proton nozzle system designed. So, results for primary and secondary dose calculations have been obtained with a representative case. Further simulations and analysis quantified the primary and secondary dose in proton therapy, also confirming the need for further studies in pediatric cases. 6.2 Recommended Future Work The performed work has established a basic methodology and provided baseline results. However, several issues were identified warranting further research. The values for standard deviation in NDE calculations were much too high at some locations, especially in the transverse and more distal neutron tallies. Because of the extended range of secondary particles, it is difficult to generate by direct simulations reliable results, i.e., results with acceptable statistical precision. In order to address this, future work should aim to implement variance reduction techniques to speed up calculations. Additionally, one way to reduce the uncertainties of NDE at locations far away from the beam is to remove the phantom entirely. In this case, a proton history is used to produce neutrons as it travels through the beam line structures, and then quickly terminated the protons before exiting the nozzle by closing the final aperture. Therefore,
49
one may process many times more protons with little computation time and this would give much better statistics for NDE. This, of course, assumes that NDE is mainly contributed from neutrons produced in the beam-‐line structures. For additional information as well as an excellent benchmark reference for this method, refer to (Zheng, Newhauser, Fontenot, Taddei, & Mohan, 2007). Another issue was that the shorter useful radius found. A ‘dished’ dose distribution was created, thereby removing the larger radii from +/-‐2.5% range that defines the useful radius. This dished dose distribution, or divergence of the beam, is a common problem in double-‐scattering system design. Two solutions to correct beam divergence and increase the useful radius would be to decrease S1 in size or to move it closer to S2 (Gottschalk B. , 2004). Further optimization of the S1/S2 parameters should be able to resolve this problem. With these issues resolved, the methodology and developed models will become a useful tool to study and improve effectiveness of proton therapy.
50
APPENDIX A: USEFUL DATA A.1 NEU Input Deck: Double Scattering System and Beam Data (Gottschalk B. , 2004) =============================================================== NEU run NEU00010 13APR06 16:53:44.22 input file \BGWARE\NEU\NEU.INP =============================================================== 'DESIGN.MOD' (filename or DESIGN).MOD 'DESIGN.CON' (filename or DESIGN).(ANN or CON) or ' ' 'MIXED.RET' range-‐energy table in \BGWARE\DATA\ 'MOLIERE' MOLIERE or HIGHLAND scattering theory 'IBA231.BPK' Bragg peak file in \BGWARE\DATA\ 'MARQUARDT' MARQUARDT or GRID or RANDOM 'NONE' measured data file or 'NONE' -‐-‐-‐-‐-‐-‐-‐-‐-‐ eight elements: mat'l, upstream z (cm), thickness (g/cm2) -‐-‐-‐-‐-‐-‐-‐-‐ ' ' -‐2 -‐999 1: prescat mat'l,z,g/cm2 or blank ' ' -‐999 -‐999 2: preabs ditto 'LEAD' -‐999 -‐999 3: S1 A mat'l (simple scatterer) 'LEXAN' 0 -‐999 4: S1 B mat'l,z ' ' -‐999 -‐999 5: postscat mat'l,z,g/cm2 or blank ' ' -‐999 -‐999 6: postabs ditto 'LEXAN' -‐999 .12 7: S2 A mat'l,z,MIN g/cm2 'LEAD' 50 -‐999 8: S2 B ditto (use for ANN) -‐-‐-‐-‐-‐-‐-‐-‐-‐-‐-‐-‐-‐-‐-‐-‐-‐-‐-‐-‐-‐-‐-‐ major design parameters -‐-‐-‐-‐-‐-‐-‐-‐-‐-‐-‐-‐-‐-‐-‐-‐-‐-‐-‐-‐-‐-‐-‐-‐-‐-‐-‐-‐ 250 230 0 throw (cm), energy (MeV), beam theta0 (mrad) 12 99 20 design radius (cm), d100, m100 (cmW) 2.5 -‐1 1 dose +/-‐%; step factor (-‐ unlocks); cm/file unit 0 zoom (cm), added to z(1-‐6) 0 0 0 depth linear,quad coefft; transv quad coefft (%) -‐-‐-‐-‐-‐-‐-‐-‐-‐-‐-‐-‐-‐-‐-‐-‐-‐-‐-‐-‐-‐-‐-‐-‐-‐-‐ scattering system -‐-‐-‐-‐-‐-‐-‐-‐-‐-‐-‐-‐-‐-‐-‐-‐-‐-‐-‐-‐-‐-‐-‐-‐-‐-‐-‐-‐-‐-‐-‐ 0.92 4 2 0 u0, # fit radii, # between, # passes 0 1E30 .07 spline y' at rMin,rMax; contour trim fraction 0 0 0 2 starting radii (max 4/line) .8433 .6108 .2124 .2608 starting proj scat strengths (max 4/line) .02 .02 .02 .02 parameter deltas for fit (0 means lock that one) 15 15 10000 Q steps QA-‐>QB, PHI steps 0-‐>pi, lookup table size 15 20 11 # steps, infty mult norm int; # pts for FOM calc .5 99 .005 MGR: lambda,n/a,eps factor,quit,eps nrep,miss,eps 1.000 -‐0.007 1.80 mod: aa(j) = (p1 + p2*(j-‐1))*aa(j), cofM = p3 .001 5 z0 loop conv test (g/cm2 gm3,gm4), max # loops -‐-‐-‐-‐-‐-‐-‐-‐-‐-‐-‐-‐-‐-‐-‐-‐-‐-‐-‐-‐-‐-‐ Broken Spline fit to SOBP -‐-‐-‐-‐-‐-‐-‐-‐-‐-‐-‐-‐-‐-‐-‐-‐-‐-‐-‐-‐-‐-‐-‐-‐-‐-‐-‐ 201 # of scan points to compute (odd) 'T' Terse or Verbose 'G' fit method: GridParab, Marquardt, None 10 1E-‐8 passes, convergence on rms (%) .5 10 reduction factor, initial lambda
51
.1 .0001 delta x,y (best may depend on fit method) 25 0 0 pts/segment (pristine peak) 10 2 2 ditto modulated (MAX pts for seg1) 8 1 deriv smoothing rms, # passes .005 .1 .5 rms/avg < p1 -‐> 2 seg; distal cut; power .05 .015 AB/AC < p1 -‐> 2 segs; rms/max > p2 -‐> add point 1 -‐.9 -‐.8 3 levels (neg -‐> horizontal fiducial line) -‐-‐-‐-‐-‐-‐-‐-‐-‐-‐-‐-‐-‐-‐-‐-‐-‐-‐-‐-‐-‐-‐-‐-‐-‐-‐-‐-‐-‐ graphics -‐-‐-‐-‐-‐-‐-‐-‐-‐-‐-‐-‐-‐-‐-‐-‐-‐-‐-‐-‐-‐-‐-‐-‐-‐-‐-‐-‐-‐-‐-‐-‐-‐-‐-‐-‐-‐ 0 -‐.2 0 middle,deep,shallow scan depth corrections -‐2 28 z limits modulator picture (absolute cm) -‐4 1 -‐5 5 z,y limits 2nd scat picture (cm, z rel to zz(7)) 0 35 z limits depth dose (cm rel to zz(8) = skin) -‐20 20 x limits transverse scans (cm) 1 60 0 playback mod range, norm const -‐-‐-‐-‐-‐-‐-‐-‐-‐-‐-‐-‐-‐-‐-‐-‐-‐-‐-‐-‐-‐-‐-‐-‐-‐-‐-‐-‐-‐ comments -‐-‐-‐-‐-‐-‐-‐-‐-‐-‐-‐-‐-‐-‐-‐-‐-‐-‐-‐-‐-‐-‐-‐-‐-‐-‐-‐-‐-‐-‐-‐-‐-‐-‐-‐-‐-‐ Double scattering, contoured MPRI 18AUG03, max depth, given mod. =============================================================== pass avg rms/avg % p1 p2 p3 p4 p5 p6 0 0.08939 0.04 0.84330 0.61080 0.21240 0.26080 -‐-‐-‐-‐-‐-‐-‐-‐-‐-‐-‐-‐-‐-‐-‐-‐-‐-‐-‐-‐-‐-‐-‐-‐-‐-‐-‐-‐-‐-‐-‐-‐-‐-‐-‐-‐-‐-‐-‐-‐-‐-‐-‐-‐-‐-‐-‐-‐-‐-‐-‐-‐-‐-‐-‐-‐-‐-‐-‐-‐-‐-‐-‐-‐-‐-‐-‐-‐-‐-‐-‐-‐-‐-‐-‐-‐-‐-‐-‐-‐-‐-‐-‐-‐-‐-‐-‐-‐-‐-‐-‐-‐ 0.203 -‐2.302 -‐2.256 2.505 0.430 vhi, vlo, vur, pp, rms (%) 1.239 42.998 99.478 useful/design rad, effcy, test integral (%) -‐-‐-‐-‐-‐-‐-‐-‐-‐-‐-‐-‐-‐-‐-‐-‐-‐-‐-‐-‐-‐-‐-‐-‐-‐-‐-‐-‐-‐-‐-‐-‐-‐-‐-‐-‐-‐-‐-‐-‐-‐-‐-‐-‐-‐-‐-‐-‐-‐-‐-‐-‐-‐-‐-‐-‐-‐-‐-‐-‐-‐-‐-‐-‐-‐-‐-‐-‐-‐-‐-‐-‐-‐-‐-‐-‐-‐-‐-‐-‐-‐-‐-‐-‐-‐-‐-‐-‐-‐-‐-‐-‐ 99.000 25.916 desired, max possible d100 =============================================================== Measurements at IBA on March 1997: E = 231.0 MeV, DE/E = .26%, rms = .07% 300. cm from source to Bragg peak (wild guess: BG 13OCT03) 34 .10000E+31 .00000E+00 # pts, yp1, ypn 3.3900 6.4900 9.3900 12.3800 15.4800 18.5900 21.5900 cm H2O 24.3800 27.2900 29.5900 30.8800 31.5900 31.8900 32.1900 32.3900 32.6900 32.8900 32.9900 33.0900 33.1900 33.3900 33.5900 33.7900 33.9900 34.1900 34.3900 34.5900 34.7900 34.9900 35.1900 35.3900 35.5900 35.7900 35.9900 .2565 .2715 .2802 .2879 .2963 .3073 .3224 rel dose .3444 .3849 .4533 .5412 .6464 .7294 .8582 .9521 .9786 .8316 .7233 .5914 .4424 .2001 .0698 .0180 .0037 .0015 .0004 .0000 .0000 .0000 .0000 .0000 .0000 .0000 .0000 =============================================================== 20.0000 25 0.8274 1.0000 desM100 (cmW), #steps, step (cmW), cm/unit 0.3007 0.1043 0.0771 0.0602 0.0496 0.0424 0.0368 0.0325 weights 0.0291 0.0263 0.0240 0.0221 0.0204 0.0189 0.0177 0.0165 0.0156 0.0147 0.0140 0.0134 0.0129 0.0123 0.0123 0.0109 0.0152 LEAD first material 0.5390 0.5278 0.5154 0.5024 0.4889 0.4749 0.4603 0.4453 thicknesses 0.4297 0.4135 0.3967 0.3793 0.3612 0.3424 0.3227 0.3021 0.2805 0.2578 0.2337 0.2082 0.1809 0.1517 0.1199 0.0850 0.0456 LEXAN second material
52
0.0000 0.7831 1.5719 2.3640 3.1589 3.9564 4.7566 5.5595 thicknesses 6.3653 7.1741 7.9861 8.8014 9.6206 10.4434 11.2709 12.1032 12.9410 13.7849 14.6357 15.4945 16.3625 17.2409 18.1331 19.0421 19.9746 =============================================================== 10 0.000E+00 0.100E+31 0.0700 1.0000 #pts, yp1,ypn, cTrim, cm/unit 0.0000 0.4342 0.8683 1.3025 1.7367 2.1708 2.6050 3.0392 3.4733 3.9075 radius LEXAN first material 0.0999 0.3130 0.8670 1.6005 2.3259 2.8519 3.1321 3.1554 3.1554 3.1554 thickness LEAD second material 0.6075 0.5652 0.4552 0.3094 0.1651 0.0605 0.0047 0.0000 0.0000 0.0000 thickness 0.9200 4 generic u0,nv 0.0000 0.6667 1.3333 2.0000 generic radii 0.8433 0.6108 0.2124 0.2608 generic v0(r) =============================================================== absent absent LEAD LEXAN absent absent LEXAN LEAD WATER WATER material 0 0 -‐0.539 0.000 0 0 46.845 50.000 234.013 240.071 zz (cm) 0 0 0.539 19.975 0 0 3.155 0.608 6.058 19.858 thick (cm) 0 0 6.118 23.970 0 0 3.786 6.895 6.058 19.858 g/cm2 0 0 0.000 26.870 0 0 0.000 183.405 0.000 0.000 gap (cm) -‐-‐-‐-‐-‐-‐-‐-‐-‐-‐-‐-‐-‐-‐-‐-‐-‐-‐-‐-‐-‐-‐-‐-‐-‐-‐-‐-‐-‐-‐-‐-‐-‐-‐-‐-‐-‐-‐-‐-‐-‐-‐-‐-‐-‐-‐-‐-‐-‐-‐-‐-‐-‐-‐-‐-‐-‐-‐-‐-‐-‐-‐-‐-‐-‐-‐-‐-‐-‐-‐-‐-‐-‐-‐-‐-‐-‐-‐-‐-‐-‐-‐-‐-‐-‐-‐-‐-‐-‐-‐-‐-‐ -‐0.270 -‐0.250 -‐0.216 -‐0.164 -‐0.090 0.008 0.132 0.284 0.468 0.685 z0(j) (cm) 0.940 1.235 1.575 1.962 2.401 2.898 3.457 4.083 4.786 5.570 6.447 7.423 8.514 9.734 11.104 -‐-‐-‐-‐-‐-‐-‐-‐-‐-‐-‐-‐-‐-‐-‐-‐-‐-‐-‐-‐-‐-‐-‐-‐-‐-‐-‐-‐-‐-‐-‐-‐-‐-‐-‐-‐-‐-‐-‐-‐-‐-‐-‐-‐-‐-‐-‐-‐-‐-‐-‐-‐-‐-‐-‐-‐-‐-‐-‐-‐-‐-‐-‐-‐-‐-‐-‐-‐-‐-‐-‐-‐-‐-‐-‐-‐-‐-‐-‐-‐-‐-‐-‐-‐-‐-‐-‐-‐-‐-‐-‐-‐ 0.498 overall SOBP fit rms (%) 44 172 184 depth scan corner indices 26.005 26.097 26.187 d100, d90', d80' (cmW) 19.977 26.097 26.187 m100, m90', m80' (cmW) 90.400 entrance dose (%) 0.253 SOBP rise (%) 1119.702 gigaProton/Gray mid-‐SOBP -‐-‐-‐-‐-‐-‐-‐-‐-‐-‐-‐-‐-‐-‐-‐-‐-‐-‐-‐-‐-‐-‐-‐-‐-‐-‐-‐-‐-‐-‐-‐-‐-‐-‐-‐-‐-‐-‐-‐-‐-‐-‐-‐-‐-‐-‐-‐-‐-‐-‐-‐-‐-‐-‐-‐-‐-‐-‐-‐-‐-‐-‐-‐-‐-‐-‐-‐-‐-‐-‐-‐-‐-‐-‐-‐-‐-‐-‐-‐-‐-‐-‐-‐-‐-‐-‐-‐-‐-‐-‐-‐-‐ proximal midSOBP distal transverse scan 3 1 2 index 6.029 16.017 25.805 scan depth (cmW) 11.582 12.346 12.867 useful radius (cm) 0.368 0.351 0.460 rms uniformity (%) 2.004 2.352 3.054 p-‐p uniformity (%) 43.646 45.427 45.483 fluence integral to useful radius (%)
53
APPENDIX B: MCNPX INPUT DECKS
B.1 MCNPX Input Deck for Proton and Neutron CAX Dose & Useful Radius This input deck is for STEP 1 of the RMW only. The differences between different steps are the tally weighting factors and the S1 Cell Cards section. c ************************************************* c Cell Cards c ************************************************* c Vacuum 1 0 20004:-‐10001:10002 imp:h,n 0 c Patient phantom 1010 3 -‐1 9101 -‐3000 -‐9103 imp:h,n 1 1011 3 -‐1 3001 -‐3002 -‐9103 imp:h,n 1 1012 3 -‐1 3003 -‐3004 -‐9103 imp:h,n 1 1013 3 -‐1 3005 -‐9102 -‐9103 imp:h,n 1 1001 3 -‐1 3000 -‐3001 -‐9103 imp:h,n 1 1002 3 -‐1 3002 -‐3003 -‐9103 imp:h,n 1 1003 3 -‐1 3004 -‐3005 -‐9103 imp:h,n 1 c 1 Air Between S1 and S2 1131 4 -‐0.001205 -‐2003 1112 -‐10000 imp:h,n 1 c Air left of Mid-‐Base Plate 1121 4 -‐0.001205 -‐9201 2004 -‐10000 imp:h,n 1 c Nozzle Casing 1020 0 -‐1111 10001 -‐10000 imp:h,n 1 $Vacuum for incoming beam 1021 4 -‐0.001205 10001 10000 -‐20002 -‐9201 imp:h,n 1 $Before Mid Base Plate 1022 4 -‐0.001205 10001 20002 -‐20004 -‐9201 imp:h,n 1 $Outside casing b4 MBP 1023 4 -‐0.001205 9201 -‐9402 20003 -‐20004 imp:h,n 1 $From MBP to SBP c Mid-‐Base Plate 1051 4 -‐0.001205 9000 9201 -‐9202 -‐20003 imp:h,n 1 c Pre-‐Collimator 1052 4 -‐0.001205 9000 9301 -‐9302 -‐20003 imp:h,n 1 c Snout Base Plate 1053 4 -‐0.001205 -‐9402 9401 20001 -‐20003 imp:h,n 1 1054 4 -‐0.001205 (-‐9505 9501 9504 -‐9503 9402 -‐9514 ):(9504 -‐9503 -‐9502 9506 & 9402 -‐9514 ):(9508 -‐9504 -‐9505 9506 9402 -‐9514 ):(-‐9507 9503 -‐9505 9506 9402 & -‐9514) imp:h,n 1 c Snout (Jaws) 1055 4 -‐0.001205 9513 -‐9514 -‐20004 #1116 #1054 imp:h,n 1 c Snout Air 1060 4 -‐0.001205 9402 -‐9513 -‐20004 #1054 imp:h,n 1 c Phantom air. 1 L 2 R 3 Around 1101 4 -‐0.001205 -‐9101 9514 -‐20004 imp:h,n 1 1102 4 -‐0.001205 9102 -‐10002 -‐20004 imp:h,n 1 1103 4 -‐0.001205 9101 -‐9102 -‐20004 (-‐9101:9102:9103) imp:h,n 1 c Air:
57
c 0 S2 1 Mid Base Plate 2 Between MBP and Pre-‐Collimator c 3 Pre-‐collimator 4 Between P-‐C & Snout Base Plate 5 Inside Snout Base Plate 1110 4 -‐0.001205 2300 2003 -‐2004 -‐10000 imp:h,n 1 1111 4 -‐0.001205 -‐9000 9201 -‐9202 imp:h,n 1 1112 4 -‐0.001205 9202 -‐9301 -‐20003 imp:h,n 1 1113 4 -‐0.001205 -‐9000 9301 -‐9302 imp:h,n 1 1114 4 -‐0.001205 9302 -‐9401 -‐20003 imp:h,n 1 1115 4 -‐0.001205 9401 -‐9402 -‐20001 imp:h,n 1 1116 4 -‐0.001205 -‐9509 9513 -‐9514 9510 9512 -‐9511 imp:h,n 1 c ************************************************* c S1 c ************************************************* c Lead step c Zmin Zmax Zcylinder 11001 2 -‐11.4 -‐1001 1111 -‐10000 imp:h,n 1 c Air on lead side c No air on lead side in step 1 c Lexan step c No lexan in step 1 c Defines Air on RHS of Lexan in S1 c Zmin Zmax Zcylinder 12102 4 -‐0.001205 1001 -‐1112 -‐10000 imp:h,n 1 c ************************************************* c S2 c ************************************************* c 210XX is for Lexan in S2 c material density cylinder L border R border Other varia 21001 1 -‐1.2 -‐2300 2301 2002 -‐2001 imp:h,n 1 21002 1 -‐1.2 -‐2301 2302 2101 -‐2001 imp:h,n 1 21003 1 -‐1.2 -‐2302 2303 2102 -‐2001 imp:h,n 1 21004 1 -‐1.2 -‐2303 2304 2103 -‐2001 imp:h,n 1 21005 1 -‐1.2 -‐2304 2305 2104 -‐2001 imp:h,n 1 21006 1 -‐1.2 -‐2305 2306 2105 -‐2001 imp:h,n 1 21007 1 -‐1.2 -‐2306 2307 2106 -‐2001 imp:h,n 1 21008 1 -‐1.2 -‐2307 2308 2107 -‐2001 imp:h,n 1 21009 1 -‐1.2 -‐2308 2309 2108 -‐2001 imp:h,n 1 21010 1 -‐1.2 -‐2309 2310 2109 -‐2001 imp:h,n 1 21011 1 -‐1.2 -‐2310 2311 2110 -‐2001 imp:h,n 1 21012 1 -‐1.2 -‐2311 2312 2111 -‐2001 imp:h,n 1 21013 1 -‐1.2 -‐2312 2313 2112 -‐2001 imp:h,n 1 21014 1 -‐1.2 -‐2313 2113 -‐2001 imp:h,n 1 c 211XX is for Air on Lexan side of S2 c material density cylinder L border R border Other varia 21101 4 -‐0.001205 -‐2300 2301 2003 -‐2002 imp:h,n 1 21102 4 -‐0.001205 -‐2301 2302 2003 -‐2101 imp:h,n 1 21103 4 -‐0.001205 -‐2302 2303 2003 -‐2102 imp:h,n 1 21104 4 -‐0.001205 -‐2303 2304 2003 -‐2103 imp:h,n 1 21105 4 -‐0.001205 -‐2304 2305 2003 -‐2104 imp:h,n 1 21106 4 -‐0.001205 -‐2305 2306 2003 -‐2105 imp:h,n 1 21107 4 -‐0.001205 -‐2306 2307 2003 -‐2106 imp:h,n 1
58
21108 4 -‐0.001205 -‐2307 2308 2003 -‐2107 imp:h,n 1 21109 4 -‐0.001205 -‐2308 2309 2003 -‐2108 imp:h,n 1 21110 4 -‐0.001205 -‐2309 2310 2003 -‐2109 imp:h,n 1 21111 4 -‐0.001205 -‐2310 2311 2003 -‐2110 imp:h,n 1 21112 4 -‐0.001205 -‐2311 2312 2003 -‐2111 imp:h,n 1 21113 4 -‐0.001205 -‐2312 2313 2003 -‐2112 imp:h,n 1 21114 4 -‐0.001205 -‐2313 2003 -‐2113 imp:h,n 1 c 220XX is for Lead in S2 c material density cylinder L border R border Other varia 22001 2 -‐11.4 -‐2301 2302 2001 -‐2201 imp:h,n 1 22002 2 -‐11.4 -‐2302 2303 2001 -‐2202 imp:h,n 1 22003 2 -‐11.4 -‐2303 2304 2001 -‐2203 imp:h,n 1 22004 2 -‐11.4 -‐2304 2305 2001 -‐2204 imp:h,n 1 22005 2 -‐11.4 -‐2305 2306 2001 -‐2205 imp:h,n 1 22006 2 -‐11.4 -‐2306 2307 2001 -‐2206 imp:h,n 1 22007 2 -‐11.4 -‐2307 2308 2001 -‐2207 imp:h,n 1 22008 2 -‐11.4 -‐2308 2309 2001 -‐2207 imp:h,n 1 $bc 2208 is the same 22009 2 -‐11.4 -‐2309 2310 2001 -‐2209 imp:h,n 1 22010 2 -‐11.4 -‐2310 2311 2001 -‐2210 imp:h,n 1 22011 2 -‐11.4 -‐2311 2312 2001 -‐2211 imp:h,n 1 22012 2 -‐11.4 -‐2312 2313 2001 -‐2212 imp:h,n 1 22013 2 -‐11.4 -‐2313 2001 -‐2213 imp:h,n 1 c 221XX is for Air on Lead side of S2 c material density cylinder L border R border Other varia 22101 4 -‐0.001205 -‐2300 2301 2001 -‐2004 imp:h,n 1 22102 4 -‐0.001205 -‐2301 2302 2201 -‐2004 imp:h,n 1 22103 4 -‐0.001205 -‐2302 2303 2202 -‐2004 imp:h,n 1 22104 4 -‐0.001205 -‐2303 2304 2203 -‐2004 imp:h,n 1 22105 4 -‐0.001205 -‐2304 2305 2204 -‐2004 imp:h,n 1 22106 4 -‐0.001205 -‐2305 2306 2205 -‐2004 imp:h,n 1 22107 4 -‐0.001205 -‐2306 2307 2206 -‐2004 imp:h,n 1 22108 4 -‐0.001205 -‐2307 2308 2207 -‐2004 imp:h,n 1 22109 4 -‐0.001205 -‐2308 2309 2207 -‐2004 imp:h,n 1 $bc 2208 is the same 22110 4 -‐0.001205 -‐2309 2310 2209 -‐2004 imp:h,n 1 22111 4 -‐0.001205 -‐2310 2311 2210 -‐2004 imp:h,n 1 22112 4 -‐0.001205 -‐2311 2312 2211 -‐2004 imp:h,n 1 22113 4 -‐0.001205 -‐2312 2313 2212 -‐2004 imp:h,n 1 22114 4 -‐0.001205 -‐2313 2213 -‐2004 imp:h,n 1 c ************************************************* c Surface Cards c ************************************************* c Border of the problem 10001 pz -‐250 10002 pz 31 c Casing of Nozzle 10000 cz 15.01 20001 cz 12.02 20002 cz 17 20003 cz 23
59
20004 cz 25 c *************Phantom****************************** 9101 pz 0 9102 pz 30 9103 cz 15 c **************Apertures*************************** 9000 cz 12.01 $based off useful radius c c Mid-‐Base Plate 9201 pz -‐177 $ Should change with calcs 9202 pz -‐170 $Location should change with calcs c c Pre-‐Collimator 9301 pz -‐87 9302 pz -‐80 c Snout Base Plate 9401 pz -‐47 9402 pz -‐40 c Snout 9501 py 14 9502 py -‐14 9503 px 14 9504 px -‐14 9505 py 16 9506 py -‐16 9507 px 16 9508 px -‐16 9509 py 10 9510 py -‐10 9511 px 10 9512 px -‐10 9513 pz -‐26 9514 pz -‐20 c *************JUNK********************************** c Brass Wall extends 1 cm beyond 50 cm throw for S2 c To catch widely scattered protons c 20 crosses aperture at x=-‐81 y=15 21 @ y=12.5 c 20 kx -‐46.65653226 0.132474331 -‐1 c 21 kx -‐39.78783871 0.132474331 -‐1 c 22 px -‐150 c Range compensator for patient irregularities shapes dis c ^^^ Will NOT be included in calculations c ************************************************* c S1 c ************************************************* c S1 and S2 calculations done in S1S2conii.xslx c Throw (Distance from S1 to mid-‐SOBP) 250 234.013 c Mid SOBP distance 16.017 c 1001-‐1025 is Lead 1111 pz -‐234.552 $ thickness 0.539
60
1112 pz -‐214.0384 $ thickness 19.9746 1001 pz -‐234.013 $S1 midplane b/t lead and lexan 1002 pz -‐234.5408 $ thickness 0.5278 1003 pz -‐234.5284 $ thickness 0.5154 1004 pz -‐234.5154 $ thickness 0.5024 1005 pz -‐234.5019 $ thickness 0.4889 1006 pz -‐234.4879 $ thickness 0.4749 1007 pz -‐234.4733 $ thickness 0.4603 1008 pz -‐234.4583 $ thickness 0.4453 1009 pz -‐234.4427 $ thickness 0.4297 1010 pz -‐234.4265 $ thickness 0.4135 1011 pz -‐234.4097 $ thickness 0.3967 1012 pz -‐234.3923 $ thickness 0.3793 1013 pz -‐234.3742 $ thickness 0.3612 1014 pz -‐234.3554 $ thickness 0.3424 1015 pz -‐234.3357 $ thickness 0.3227 1016 pz -‐234.3151 $ thickness 0.3021 1017 pz -‐234.2935 $ thickness 0.2805 1018 pz -‐234.2708 $ thickness 0.2578 1019 pz -‐234.2467 $ thickness 0.2337 1020 pz -‐234.2212 $ thickness 0.2082 1021 pz -‐234.1939 $ thickness 0.1809 1022 pz -‐234.1647 $ thickness 0.1517 1023 pz -‐234.1329 $ thickness 0.1199 1024 pz -‐234.098 $ thickness 0.085 1025 pz -‐234.0586 $ thickness 0.0456 c 1052-‐1074 is Lexan 1052 pz -‐233.2299 $ thickness 0.7831 1053 pz -‐232.4411 $ thickness 1.5719 1054 pz -‐231.649 $ thickness 2.364 1055 pz -‐230.8541 $ thickness 3.1589 1056 pz -‐230.0566 $ thickness 3.9564 1057 pz -‐229.2564 $ thickness 4.7566 1058 pz -‐228.4535 $ thickness 5.5595 1059 pz -‐227.6477 $ thickness 6.3653 1060 pz -‐226.8389 $ thickness 7.1741 1061 pz -‐226.0269 $ thickness 7.9861 1062 pz -‐225.2116 $ thickness 8.8014 1063 pz -‐224.3924 $ thickness 9.6206 1064 pz -‐223.5696 $ thickness 10.4434 1065 pz -‐222.7421 $ thickness 11.2709 1066 pz -‐221.9098 $ thickness 12.1032 1067 pz -‐221.072 $ thickness 12.941 1068 pz -‐220.2281 $ thickness 13.7849 1069 pz -‐219.3773 $ thickness 14.6357 1070 pz -‐218.5185 $ thickness 15.4945 1071 pz -‐217.6505 $ thickness 16.3625 1072 pz -‐216.7721 $ thickness 17.2409 1073 pz -‐215.8799 $ thickness 18.1331 1074 pz -‐214.9709 $ thickness 19.0421
61
c ************************************************* c S2 c ************************************************* c 2000s define midline and borders for S2 c Distance between midline S1 and S2 50 2001 pz -‐184.013 $B/t lead and lexan 2002 pz -‐187.1684 $LHS of S2 2003 pz -‐189 $Edges of S2 2004 pz -‐183.4 c 2100's for Lexan conii 2101 kz -‐186.8655215 86.81760578 -‐1 2102 kz -‐185.7964035 3.730671629 -‐1 2103 kz -‐185.1870546 1.673923991 -‐1 2104 kz -‐184.5500469 0.879412751 -‐1 2105 kz -‐183.9822357 0.543067936 -‐1 2106 kz -‐183.56066 0.390759981 -‐1 2107 kz -‐183.3450742 0.329690393 -‐1 2108 kz -‐183.3432743 0.329167835 -‐1 2109 kz -‐183.4597636 0.37378193 -‐1 2110 kz -‐183.6387712 0.489368353 -‐1 2111 kz -‐183.8384 0.79296176 -‐1 2112 kz -‐184.0106 1.895205291 -‐1 2113 kz -‐184.1129 15.3567784 -‐1 c 2200s are for Lead conii 2201 kz -‐183.95190 2133.653689 -‐1 2202 kz -‐183.74072 94.77851958 -‐1 2203 kz -‐183.61753 41.99813767 -‐1 2204 kz -‐183.49233 22.25378072 -‐1 2205 kz -‐183.37913 13.72538119 -‐1 2206 kz -‐183.29513 9.871054555 -‐1 2207 kz -‐183.25243 8.334584724 -‐1 c 2208 kz -‐183.25243 8.334584724 -‐1 2209 kz -‐183.27543 9.456060557 -‐1 2210 kz -‐183.31131 12.40960744 -‐1 2211 kz -‐183.35100 20.12004388 -‐1 2212 kz -‐183.38520 48.10951423 -‐1 2213 kz -‐183.40550 389.5240496 -‐1 c 230Xs are for cylinders 2300 cz 3.9075 2301 cz 2.8221 2302 cz 2.605 2303 cz 2.3879 2304 cz 2.1708 2305 cz 1.9538 2306 cz 1.7367 2307 cz 1.5196 2308 cz 1.3025 2309 cz 1.0854 2310 cz 0.8683 2311 cz 0.6513
62
2312 cz 0.4342 2313 cz 0.2171 1 pz 0.1 2 pz 0.2 3 pz 0.3 … *** Surface cards 4-‐296 omitted due to repititiveness*** … 297 pz 29.7 298 pz 29.8 299 pz 29.9 500 cz 0.1 501 cz 0.2 502 cz 0.3 … *** Surface cards 503-‐645 omitted due to repititiveness *** … 646 cz 14.7 647 cz 14.8 648 cz 14.9 3000 pz 5.85 3001 pz 6.15 3002 pz 15.401 3003 pz 15.701 3004 pz 24.85 3005 pz 25.15 c *********************************** c DATA CARDS c *********************************** print 110 101 50 c Lexan -‐1.2 m1 1001 -‐0.055491 & 6012 -‐0.755751 & 8016 -‐0.188758 & hlib=.24h c Lead -‐11.4 m2 82208 -‐52.9 & 82206 -‐24.6 & 82207 -‐22.5 & hlib=.24h c Brain -‐1.04 c m3 1001 -‐0.107 & c 6012 -‐0.145 & c 7014 -‐0.022 & c 8016 -‐0.712 & c 11023 -‐0.002 & c 15031 -‐0.004 & c hlib=.24h c Water m3 1001 -‐0.111894 &
63
8016 -‐0.888106 & hlib=.24h c Air -‐0.001205 m4 6012 -‐0.000124 & 7014 -‐0.755267 & 8016 -‐0.231781 & hlib=.24h c Brass -‐8.49 Newhauser et al PMB 2005 m5 29063 -‐0.4253955 & 29065 -‐0.1896945 & 30000 -‐0.352 & 82208 -‐0.017442 & 82206 -‐0.008103 & 82207 -‐0.007443 & hlib=.24h c Concrete c m6 1001 -‐0.005558 & c 8016 -‐0.498076 & c 11023 -‐0.017101 & c 12024 -‐0.002026 & c 12026 -‐0.0002565 & c 12025 -‐0.0002565 & c 13027 -‐0.045746 & c 14028 -‐0.290608 & c 14029 -‐0.014756 & c 14030 -‐0.009728 & c 16032 -‐0.00122 & c 16034 -‐0.000063 & c 19039 -‐0.017892 & c 19041 -‐0.001347 & c 20040 -‐0.082941 & c 26054 -‐0.000707 & c 26056 -‐0.01139 & c 26057 -‐0.000265 & c nlib=.66c hlib=.24h c Stainless Steel c m7 1001 -‐0.01 & c 24052 -‐0.1675 & c 24053 -‐0.019002 & c 24050 -‐0.00869 & c 24054 -‐0.00473 & c 26056 -‐0.6331026 & c 26054 -‐0.0403305 & c 26057 -‐0.0146211 & c 28058 -‐0.06808 & c 28060 -‐0.0262231 & c 28062 -‐0.0036345 & c 28061 -‐0.0011399 & c 28064 -‐0.0009256 mode h,n
64
phys:h 250 phys:n 250 sdef axs 0 0 1 dir 1 par=h vec 0 0 1 erg=d1 x=0 y=0 z=-‐249 sp1 -‐4 .6006 231 nps 12500000 prdmp 2j 1 c *********************************** c Proton CAX Dose Tallies c *********************************** f6:h 1010 fs6 -‐1 -‐2 -‐3 …. -‐297 -‐298 -‐299 fq6 s f fc6 Proton dose in MeV in z direction fm6 .3007 $ Weighting factor c *********************************** c Neutron CAX Dose Tallies c *********************************** f4:n 1010 fs4 -‐1 -‐2 -‐3 …. -‐297 -‐298 -‐299 fq4 s f df4 iu=2 ic=20 fc4 Neutron dose in cSv/h in z direction fm4 .3007 $ Weighting factor c *********************************** c Useful Radius Tallies c *********************************** f16:h 1001 fs16 -‐500 -‐501 -‐502 … -‐646 -‐647 -‐648 fq16 s f fc16 Useful radius at Proximal SOBP f26:h 1002 fs26 -‐500 -‐501 -‐502 … -‐646 -‐647 -‐648 fq16 s f fc26 Useful radius at Mid-‐SOBP f36:h 1003 fs36 -‐500 -‐501 -‐502 … -‐646 -‐647 -‐648 fq36 s f fc36 Useful radius at Distal SOBP B.2 MCNPX Input Deck: The NDE Problem c ************************************************* c Cell Cards c ************************************************* c Vacuum 22115 0 -‐10001 :(10001 -‐10002 20004 ):(10003 10002 -‐10004 ):10004 imp:h,n 0 c Patient phantom 1010 3 -‐1 10002 -‐9102 -‐9103 #21 imp:h,n 1 21 3 -‐1 -‐9500 3000 -‐3001 imp:h,n 1 22 3 -‐1 -‐9901 imp:h,n 1
65
23 3 -‐1 -‐9902 imp:h,n 1 24 3 -‐1 -‐9903 imp:h,n 1 25 3 -‐1 -‐9904 imp:h,n 1 26 3 -‐1 -‐9905 imp:h,n 1 27 3 -‐1 -‐9906 imp:h,n 1 28 3 -‐1 -‐9907 imp:h,n 1 29 3 -‐1 -‐9908 imp:h,n 1 30 3 -‐1 -‐9909 imp:h,n 1 c 1 Air Between S1 and S2 1131 4 -‐0.001205 -‐2003 1112 -‐10000 imp:h,n 1 c Air left of Mid-‐Base Plate 1121 4 -‐0.001205 -‐9201 2004 -‐10000 imp:h,n 1 c Nozzle Casing 1020 0 -‐1111 10001 -‐10000 imp:h,n 1 $Vacuum for incoming beam 1021 5 -‐8.49 10001 10000 -‐20002 -‐9201 imp:h,n 1 $Before Mid Base Plate 1022 4 -‐0.001205 10001 20002 -‐20004 -‐9201 imp:h,n 1 $Outside casing b4 MBP 1023 5 -‐8.49 9201 -‐9402 20003 -‐20004 imp:h,n 1 $From MBP to SBP c Mid-‐Base Plate 1051 5 -‐8.49 9000 9201 -‐9202 -‐20003 imp:h,n 1 c Pre-‐Collimator 1052 5 -‐8.49 9000 9301 -‐9302 -‐20003 imp:h,n 1 c Snout Base Plate 1053 5 -‐8.49 -‐9402 9401 20001 -‐20003 imp:h,n 1 1054 5 -‐8.49 (-‐9505 9501 9504 -‐9503 9402 -‐9514 ):(9504 -‐9503 -‐9502 9506 & 9402 -‐9514 ):(9508 -‐9504 -‐9505 9506 9402 -‐9514 ):(-‐9507 9503 -‐9505 9506 9402 & -‐9514) imp:h,n 1 c Snout (Jaws) 1055 5 -‐8.49 9513 -‐9514 -‐20004 #1116 #1054 #1117 imp:h,n 1 c Snout Air 1060 4 -‐0.001205 9402 -‐9513 -‐20004 #1054 imp:h,n 1 c Phantom air. 1 L 2 R 3 Around 1101 4 -‐0.001205 -‐10002 9514 -‐20004 imp:h,n 1 1102 4 -‐0.001205 10002 -‐10003 -‐10004 9906 9905 9904 9907 9901 9902 9908 & 9909 9903 (9103 :9102 :-‐10002 ) imp:h,n 1 c Air: c 0 S2 1 Mid Base Plate 2 Between MBP and Pre-‐Collimator c 3 Pre-‐collimator 4 Between P-‐C & Snout Base Plate 5 Inside Snout Base Plate 1110 4 -‐0.001205 2300 2003 -‐2004 -‐10000 imp:h,n 1 1111 4 -‐0.001205 -‐9000 9201 -‐9202 imp:h,n 1 1112 4 -‐0.001205 9202 -‐9301 -‐20003 imp:h,n 1 1113 4 -‐0.001205 -‐9000 9301 -‐9302 imp:h,n 1 1114 4 -‐0.001205 9302 -‐9401 -‐20003 imp:h,n 1 1115 4 -‐0.001205 9401 -‐9402 -‐20001 imp:h,n 1 1116 5 -‐8.49 -‐9509 9513 -‐9514 9510 9512 -‐9511 #1117 imp:h,n 1 1117 4 -‐0.001205 9513 -‐9514 -‐9500 imp:h,n 1 c ************************************************* c S1 c ************************************************* c Lead step c Zmin Zmax Zcylinder
66
11001 2 -‐11.4 -‐1001 1111 -‐10000 imp:h,n 1 c Air on lead side c No air on lead side in step 1 c Lexan step c No lexan in step 1 c Defines Air on RHS of Lexan in S1 c Zmin Zmax Zcylinder 12102 4 -‐0.001205 1001 -‐1112 -‐10000 imp:h,n 1 c ************************************************* c S2 c ************************************************* c 210XX is for Lexan in S2 c material density cylinder L border R border Other varia 21001 1 -‐1.2 -‐2300 2301 2002 -‐2001 imp:h,n 1 21002 1 -‐1.2 -‐2301 2302 2101 -‐2001 imp:h,n 1 21003 1 -‐1.2 -‐2302 2303 2102 -‐2001 imp:h,n 1 21004 1 -‐1.2 -‐2303 2304 2103 -‐2001 imp:h,n 1 21005 1 -‐1.2 -‐2304 2305 2104 -‐2001 imp:h,n 1 21006 1 -‐1.2 -‐2305 2306 2105 -‐2001 imp:h,n 1 21007 1 -‐1.2 -‐2306 2307 2106 -‐2001 imp:h,n 1 21008 1 -‐1.2 -‐2307 2308 2107 -‐2001 imp:h,n 1 21009 1 -‐1.2 -‐2308 2309 2108 -‐2001 imp:h,n 1 21010 1 -‐1.2 -‐2309 2310 2109 -‐2001 imp:h,n 1 21011 1 -‐1.2 -‐2310 2311 2110 -‐2001 imp:h,n 1 21012 1 -‐1.2 -‐2311 2312 2111 -‐2001 imp:h,n 1 21013 1 -‐1.2 -‐2312 2313 2112 -‐2001 imp:h,n 1 21014 1 -‐1.2 -‐2313 2113 -‐2001 imp:h,n 1 c 211XX is for Air on Lexan side of S2 c material density cylinder L border R border Other varia 21101 4 -‐0.001205 -‐2300 2301 2003 -‐2002 imp:h,n 1 21102 4 -‐0.001205 -‐2301 2302 2003 -‐2101 imp:h,n 1 21103 4 -‐0.001205 -‐2302 2303 2003 -‐2102 imp:h,n 1 21104 4 -‐0.001205 -‐2303 2304 2003 -‐2103 imp:h,n 1 21105 4 -‐0.001205 -‐2304 2305 2003 -‐2104 imp:h,n 1 21106 4 -‐0.001205 -‐2305 2306 2003 -‐2105 imp:h,n 1 21107 4 -‐0.001205 -‐2306 2307 2003 -‐2106 imp:h,n 1 21108 4 -‐0.001205 -‐2307 2308 2003 -‐2107 imp:h,n 1 21109 4 -‐0.001205 -‐2308 2309 2003 -‐2108 imp:h,n 1 21110 4 -‐0.001205 -‐2309 2310 2003 -‐2109 imp:h,n 1 21111 4 -‐0.001205 -‐2310 2311 2003 -‐2110 imp:h,n 1 21112 4 -‐0.001205 -‐2311 2312 2003 -‐2111 imp:h,n 1 21113 4 -‐0.001205 -‐2312 2313 2003 -‐2112 imp:h,n 1 21114 4 -‐0.001205 -‐2313 2003 -‐2113 imp:h,n 1 c 220XX is for Lead in S2 c material density cylinder L border R border Other varia 22001 2 -‐11.4 -‐2301 2302 2001 -‐2201 imp:h,n 1 22002 2 -‐11.4 -‐2302 2303 2001 -‐2202 imp:h,n 1 22003 2 -‐11.4 -‐2303 2304 2001 -‐2203 imp:h,n 1 22004 2 -‐11.4 -‐2304 2305 2001 -‐2204 imp:h,n 1 22005 2 -‐11.4 -‐2305 2306 2001 -‐2205 imp:h,n 1
67
22006 2 -‐11.4 -‐2306 2307 2001 -‐2206 imp:h,n 1 22007 2 -‐11.4 -‐2307 2308 2001 -‐2207 imp:h,n 1 22008 2 -‐11.4 -‐2308 2309 2001 -‐2207 imp:h,n 1 $bc 2208 is the same 22009 2 -‐11.4 -‐2309 2310 2001 -‐2209 imp:h,n 1 22010 2 -‐11.4 -‐2310 2311 2001 -‐2210 imp:h,n 1 22011 2 -‐11.4 -‐2311 2312 2001 -‐2211 imp:h,n 1 22012 2 -‐11.4 -‐2312 2313 2001 -‐2212 imp:h,n 1 22013 2 -‐11.4 -‐2313 2001 -‐2213 imp:h,n 1 c 221XX is for Air on Lead side of S2 c material density cylinder L border R border Other varia 22101 4 -‐0.001205 -‐2300 2301 2001 -‐2004 imp:h,n 1 22102 4 -‐0.001205 -‐2301 2302 2201 -‐2004 imp:h,n 1 22103 4 -‐0.001205 -‐2302 2303 2202 -‐2004 imp:h,n 1 22104 4 -‐0.001205 -‐2303 2304 2203 -‐2004 imp:h,n 1 22105 4 -‐0.001205 -‐2304 2305 2204 -‐2004 imp:h,n 1 22106 4 -‐0.001205 -‐2305 2306 2205 -‐2004 imp:h,n 1 22107 4 -‐0.001205 -‐2306 2307 2206 -‐2004 imp:h,n 1 22108 4 -‐0.001205 -‐2307 2308 2207 -‐2004 imp:h,n 1 22109 4 -‐0.001205 -‐2308 2309 2207 -‐2004 imp:h,n 1 $bc 2208 is the same 22110 4 -‐0.001205 -‐2309 2310 2209 -‐2004 imp:h,n 1 22111 4 -‐0.001205 -‐2310 2311 2210 -‐2004 imp:h,n 1 22112 4 -‐0.001205 -‐2311 2312 2211 -‐2004 imp:h,n 1 22113 4 -‐0.001205 -‐2312 2313 2212 -‐2004 imp:h,n 1 22114 4 -‐0.001205 -‐2313 2213 -‐2004 imp:h,n 1 c ************************************************* c Surface Cards c ************************************************* c Border of the problem 10001 pz -‐250 10002 pz 0 10003 cz 205 10004 pz 230 c Casing of Nozzle 10000 cz 15.01 20001 cz 12.02 20002 cz 17 20003 cz 23 20004 cz 25 c *************Phantom****************************** 9102 pz 30 9103 cz 15 c **************Apertures*************************** 9000 cz 12.01 $based off useful radius c c Mid-‐Base Plate 9201 pz -‐177 $ Should change with calcs 9202 pz -‐170 $Location should change with calcs c c Pre-‐Collimator
68
9301 pz -‐87 9302 pz -‐80 c Snout Base Plate 9401 pz -‐47 9402 pz -‐40 c Snout 9501 py 14 9502 py -‐14 9503 px 14 9504 px -‐14 9505 py 16 9506 py -‐16 9507 px 16 9508 px -‐16 9509 py 10 9510 py -‐10 9511 px 10 9512 px -‐10 9513 pz -‐26 9514 pz -‐20 9500 cz 2.5 c *********Tumor & Neutron Detectors**************** 9900 s 0 0 23.3 2.5 $Tumor volume 9901 s 0 0 73.1 2.5 $50cm, 0 degrees 9902 s 0 0 123.1 2.5 $100cm, 0 degrees 9903 s 0 0 223.1 2.5 $200cm, 0 degrees 9904 s 0 50 23.1 2.5 $50cm, 90 degrees 9905 s 0 100 23.1 2.5 $100cm, 90 degrees 9906 s 0 200 23.1 2.5 $200cm, 90 degrees 9907 s 0 30 63.1 2.5 $50cm, 45 degrees 9908 s 0 60 103.1 2.5 $100cm, 45 degrees 9909 s 0 120 183.1 2.5 $200cm, 45 degrees c *************JUNK********************************** c Brass Wall extends 1 cm beyond 50 cm throw for S2 c To catch widely scattered protons c 20 crosses aperture at x=-‐81 y=15 21 @ y=12.5 c 20 kx -‐46.65653226 0.132474331 -‐1 c 21 kx -‐39.78783871 0.132474331 -‐1 c 22 px -‐150 c Range compensator for patient irregularities shapes dis c ^^^ Will NOT be included in calculations c ************************************************* c S1 c ************************************************* c S1 and S2 calculations done in S1S2conii.xslx c Throw (Distance from S1 to mid-‐SOBP) 250 234.013 c Mid SOBP distance 16.017 c 1001-‐1025 is Lead 1111 pz -‐234.552 $ thickness 0.539 1112 pz -‐214.0384 $ thickness 19.9746
69
1001 pz -‐234.013 $S1 midplane b/t lead and lexan 1002 pz -‐234.5408 $ thickness 0.5278 1003 pz -‐234.5284 $ thickness 0.5154 1004 pz -‐234.5154 $ thickness 0.5024 1005 pz -‐234.5019 $ thickness 0.4889 1006 pz -‐234.4879 $ thickness 0.4749 1007 pz -‐234.4733 $ thickness 0.4603 1008 pz -‐234.4583 $ thickness 0.4453 1009 pz -‐234.4427 $ thickness 0.4297 1010 pz -‐234.4265 $ thickness 0.4135 1011 pz -‐234.4097 $ thickness 0.3967 1012 pz -‐234.3923 $ thickness 0.3793 1013 pz -‐234.3742 $ thickness 0.3612 1014 pz -‐234.3554 $ thickness 0.3424 1015 pz -‐234.3357 $ thickness 0.3227 1016 pz -‐234.3151 $ thickness 0.3021 1017 pz -‐234.2935 $ thickness 0.2805 1018 pz -‐234.2708 $ thickness 0.2578 1019 pz -‐234.2467 $ thickness 0.2337 1020 pz -‐234.2212 $ thickness 0.2082 1021 pz -‐234.1939 $ thickness 0.1809 1022 pz -‐234.1647 $ thickness 0.1517 1023 pz -‐234.1329 $ thickness 0.1199 1024 pz -‐234.098 $ thickness 0.085 1025 pz -‐234.0586 $ thickness 0.0456 c 1052-‐1074 is Lexan 1052 pz -‐233.2299 $ thickness 0.7831 1053 pz -‐232.4411 $ thickness 1.5719 1054 pz -‐231.649 $ thickness 2.364 1055 pz -‐230.8541 $ thickness 3.1589 1056 pz -‐230.0566 $ thickness 3.9564 1057 pz -‐229.2564 $ thickness 4.7566 1058 pz -‐228.4535 $ thickness 5.5595 1059 pz -‐227.6477 $ thickness 6.3653 1060 pz -‐226.8389 $ thickness 7.1741 1061 pz -‐226.0269 $ thickness 7.9861 1062 pz -‐225.2116 $ thickness 8.8014 1063 pz -‐224.3924 $ thickness 9.6206 1064 pz -‐223.5696 $ thickness 10.4434 1065 pz -‐222.7421 $ thickness 11.2709 1066 pz -‐221.9098 $ thickness 12.1032 1067 pz -‐221.072 $ thickness 12.941 1068 pz -‐220.2281 $ thickness 13.7849 1069 pz -‐219.3773 $ thickness 14.6357 1070 pz -‐218.5185 $ thickness 15.4945 1071 pz -‐217.6505 $ thickness 16.3625 1072 pz -‐216.7721 $ thickness 17.2409 1073 pz -‐215.8799 $ thickness 18.1331 1074 pz -‐214.9709 $ thickness 19.0421 c *************************************************
70
c S2 c ************************************************* c 2000s define midline and borders for S2 c Distance between midline S1 and S2 50 2001 pz -‐184.013 $B/t lead and lexan 2002 pz -‐187.1684 $LHS of S2 2003 pz -‐189 $Edges of S2 2004 pz -‐183.4 c 2100's for Lexan conii 2101 kz -‐186.8655215 86.81760578 -‐1 2102 kz -‐185.7964035 3.730671629 -‐1 2103 kz -‐185.1870546 1.673923991 -‐1 2104 kz -‐184.5500469 0.879412751 -‐1 2105 kz -‐183.9822357 0.543067936 -‐1 2106 kz -‐183.56066 0.390759981 -‐1 2107 kz -‐183.3450742 0.329690393 -‐1 2108 kz -‐183.3432743 0.329167835 -‐1 2109 kz -‐183.4597636 0.37378193 -‐1 2110 kz -‐183.6387712 0.489368353 -‐1 2111 kz -‐183.8384 0.79296176 -‐1 2112 kz -‐184.0106 1.895205291 -‐1 2113 kz -‐184.1129 15.3567784 -‐1 c 2200s are for Lead conii 2201 kz -‐183.95190 2133.653689 -‐1 2202 kz -‐183.74072 94.77851958 -‐1 2203 kz -‐183.61753 41.99813767 -‐1 2204 kz -‐183.49233 22.25378072 -‐1 2205 kz -‐183.37913 13.72538119 -‐1 2206 kz -‐183.29513 9.871054555 -‐1 2207 kz -‐183.25243 8.334584724 -‐1 c 2208 kz -‐183.25243 8.334584724 -‐1 2209 kz -‐183.27543 9.456060557 -‐1 2210 kz -‐183.31131 12.40960744 -‐1 2211 kz -‐183.35100 20.12004388 -‐1 2212 kz -‐183.38520 48.10951423 -‐1 2213 kz -‐183.40550 389.5240496 -‐1 c 230Xs are for cylinders 2300 cz 3.9075 2301 cz 2.8221 2302 cz 2.605 2303 cz 2.3879 2304 cz 2.1708 2305 cz 1.9538 2306 cz 1.7367 2307 cz 1.5196 2308 cz 1.3025 2309 cz 1.0854 2310 cz 0.8683 2311 cz 0.6513 2312 cz 0.4342
71
2313 cz 0.2171 3000 pz 20.8 3001 pz 25.8 c *********************************** c DATA CARDS c *********************************** print 110 101 50 c Lexan -‐1.2 m1 1001 -‐0.055491 & 6012 -‐0.755751 & 8016 -‐0.188758 & hlib=.24h c Lead -‐11.4 m2 82208 -‐52.9 & 82206 -‐24.6 & 82207 -‐22.5 & hlib=.24h c Brain -‐1.04 c m3 1001 -‐0.107 & c 6012 -‐0.145 & c 7014 -‐0.022 & c 8016 -‐0.712 & c 11023 -‐0.002 & c 15031 -‐0.004 & c hlib=.24h c Water m3 1001 -‐0.111894 & 8016 -‐0.888106 & hlib=.24h c Air -‐0.001205 m4 6012 -‐0.000124 & 7014 -‐0.755267 & 8016 -‐0.231781 & hlib=.24h c Brass -‐8.49 Newhauser et al PMB 2005 m5 29063 -‐0.4253955 & 29065 -‐0.1896945 & 30000 -‐0.352 & 82208 -‐0.017442 & 82206 -‐0.008103 & 82207 -‐0.007443 & hlib=.24h mode h n phys:h 250 phys:n 250 sdef axs 0 0 1 dir 1 par=h vec 0 0 1 erg=d1 x=0 y=0 z=-‐249 sp1 -‐4 .6006 231 nps 12500000 prdmp 2j 1
72
c ************************************************* c ******* ALL NEUTRON DOSES ARE IN [cSv/s] ******** c ********** Proton Dose is in [Gy/s] ************ c ************************************************* c ****** Need to put in weighting per step ******** c ************************************************* F14:n 1010 FC14 neutron flux averaged over whole phantom (Not including tumor area) DF14 IU=2 IC=20 Fm14 8.3528E-‐5 F24:n 21 FC24 neutron flux averaged over tumour DF24 IU=2 IC=20 Fm24 8.3528E-‐5 F34:n 22 FC34 50 cm parallel (0 degrees) DF34 IU=2 IC=20 Fm34 8.3528E-‐5 F44:n 23 FC44 100 cm parallel DF44 IU=2 IC=20 Fm44 8.3528E-‐5 F54:n 24 FC54 200 cm parallel DF54 IU=2 IC=20 Fm54 8.3528E-‐5 F64:n 25 FC64 50 at 90 deg DF64 IU=2 IC=20 Fm64 8.3528E-‐5 F74:n 26 FC74 100 cm at 90 deg DF74 IU=2 IC=20 Fm74 8.3528E-‐5 F84:n 27 FC84 200 cm at 90 deg DF84 IU=2 IC=20 Fm84 8.3528E-‐5 F94:n 28 FC94 50 cm 45 degrees DF94 IU=2 IC=20 Fm94 8.3528E-‐5 F104:n 29 FC104 100 cm 45 degrees DF104 IU=2 IC=20 Fm104 8.3528E-‐5 F114:n 30 FC114 200 cm 45 degrees DF114 IU=2 IC=20
73
Fm114 8.3528E-‐5 F16:h 21 $ proton energy deposition FM16 1.602e-‐10 $ Gy*g/MeV tmesh rmesh11:h pedep cora11 -‐15 59i 15 corb11 -‐15 i 15 corc11 0 59i 30 rmesh21:h pedep cora21 -‐15 i 15 corb21 -‐15 59i 15 corc21 0 59i 30 endmd fm11 0.3007 fm21 0.3007 B.3 MCNPX Input Deck: The MIRD Problem c ************************************************* c Cell Cards c ************************************************* c MIRD phantom c Legs 4 3 -‐1.04 ((-‐13 20 -‐5):(-‐213 20 -‐5)) #21 imp:h 1 5 4 -‐0.001205 10002 -‐10004 -‐10003 #4 #6 #7 #8 #9 #10 #11 #12 #13 #14 #15 #16 & #17 #18 #118 #19 #20 #21 #24 #25 #26 #28 #29 #41 #411 #412 #42 #43 #44 #45 & #47 #48 #49 #50 #52 #53 #54 #55 #56 #57 #58 #59 #60 #61 #62 #63 #64 imp:h 1 c Head and Neck 6 3 -‐1.04 ((-‐23 6 -‐22 114) #44 #18 #118 ):(-‐21 22 -‐322 114):((322 -‐12 -‐18 116 & )#412 #43 #17):((-‐524 12 116) #43 #42) imp:h 1 7 3 -‐1.04 (((20 -‐313 13):(213 -‐413 20)) -‐5):(4 -‐20 -‐313):(4 -‐20 -‐413): & (-‐11 16 5 -‐19):(-‐11 19 -‐6 21):(-‐21 23 6 -‐22):(22 -‐322 21 -‐14): & (-‐14 18 322 -‐12):(12 -‐24 524) imp:h 1 8 6 -‐0.296 (-‐27:28:-‐29:30) -‐25 31 imp:h 1 $right lung 9 6 -‐0.296 (33:34:32) -‐26 31 imp:h 1 $ left lung 10 3 -‐1.04 -‐35 36 -‐37 -‐38 imp:h 1 $liver 11 3 -‐1.04 -‐39 40 #47 imp:h 1 $stomach 12 3 -‐1.04 -‐40 imp:h 1 $ contents 13 3 -‐1.04 -‐41 42 imp:h 1 $ urinary bladder 14 3 -‐1.04 -‐42 imp:h 1 $ contents 15 3 -‐1.04 -‐43:-‐44 imp:h 1 $ testes c *** Tumor area *** 16 3 -‐1.04 -‐9910 9911 -‐9912 imp:h 1 $Tumor 17 3 -‐1.04 -‐45 #16 imp:h 1 $brain c Esophagus: Thoracic+abdominal portion 18 3 -‐1.04 (-‐48 175 37 -‐19):(-‐176 177 -‐178) imp:h 1
74
118 0 -‐175 37 -‐19 imp:h 1 $ void in esophagus c colon:ascending, transverse, descending and sigmoid 19 3 -‐1.04 (-‐49 50 51 -‐52):(-‐53 54 -‐55 56):(-‐57 58 59 -‐52):(-‐61 62 -‐59 65): (-‐63 64 -‐65 5) imp:h 1 20 3 -‐1.04 (-‐50 51 -‐52):(-‐54 -‐55 56):(-‐58 59 -‐52):(-‐62 -‐59 65): & (-‐64 -‐65 5) imp:h 1 $contents-‐colon 21 7 -‐1.4 (-‐66 20 -‐5):(20 -‐5 -‐67) imp:h 1 $ leg bones 24 7 -‐1.4 (-‐68 5 -‐70):(-‐69 5 -‐70) imp:h 1 $ arm bones 25 7 -‐1.4 (-‐71 272 -‐72 -‐119):(-‐71 -‐73 -‐273 -‐119) imp:h 1 $clavicles c Scapulae 26 7 -‐1.4 (75 -‐74 78 -‐79 119 80 -‐81):(75 -‐74 78 -‐79 119 -‐76 77) imp:h 1 28 7 -‐1.4 ((-‐83 82 -‐86 87 5 -‐85):(-‐83 82 -‐84 85 87)) imp:h 1 $pelvis 29 7 -‐1.4 ((-‐75 89 90 -‐91):(-‐75 89 92 -‐93):(-‐75 89 94 -‐95):(-‐75 89 205 -‐96): & (-‐75 89 97 -‐98):(-‐75 89 99 -‐100):(-‐75 89 101 -‐102):(-‐75 89 103 -‐104): & (-‐75 89 105 -‐106):(-‐75 89 107 -‐108):(-‐75 89 109 -‐110): & (-‐75 89 111 -‐211)) #10 #24 #25 #26 imp:h 1 $rib cage c 41 7 -‐1.4 (-‐112 84 -‐214):(-‐112 214 -‐19):(19 -‐113 -‐114) imp:h 1 $spine 41 7 -‐1.4 -‐112 84 -‐90 imp:h 1 $spine, lower portion 411 7 -‐1.4 -‐112 90 -‐19 imp:h 1 $ spine, middle portion 412 7 -‐1.4 19 -‐113 -‐114 imp:h 1 $ spine, upper portion 42 7 -‐1.4 -‐116 45 -‐12 #18 imp:h 1 $skull-‐cranium c facial skeleton 43 7 -‐1.4 (-‐116 45 12 #18):(118 -‐117 120 -‐121 -‐119 116) imp:h 1 44 3 -‐1.04 (((-‐125 134 -‐122 6 -‐133 123 127):(-‐126 128 -‐122 123 -‐134 6 -‐133)): & ((-‐129 131 134 -‐122 123 133 -‐47):(-‐130 132 -‐134 -‐122 123 133 -‐47))) ( & -‐122 123 -‐23 -‐124 6 -‐47) imp:h 1 $thyroid 45 3 -‐1.04 (-‐135 365):(-‐136 -‐137) imp:h 1 $ kidneys 47 3 -‐1.04 (-‐138 139 -‐339):(-‐138 339 140) imp:h 1 $pancreas 48 3 -‐1.04 -‐141 imp:h 1 $spleen 49 3 -‐1.04 -‐142 imp:h 1 $thymus 50 3 -‐1.04 (-‐143 145):(-‐144 145) imp:h 1 $ adrenals 52 3 -‐1.04 (-‐146 147 -‐148):(-‐149 150 148 -‐348) #47 imp:h 1 $gall bladder 53 3 -‐1.04 (-‐147 -‐148):(-‐150 148 -‐348) #47 imp:h 1 $gall bladder-‐contents 54 3 -‐1.04 -‐151 152 153 #56 #57 imp:h 1 $heart -‐left ventricle 55 3 -‐1.04 -‐152 153 #56 #57 imp:h 1 $ heart-‐left ventricle-‐contents 56 3 -‐1.04 -‐154 155 153 -‐156 151 imp:h 1 $right ventricle 57 3 -‐1.04 -‐155 153 -‐156 151 imp:h 1 $right ventricle-‐contents c left atrium-‐part 1 and 2 58 3 -‐1.04 (-‐157 158 -‐153 156):(-‐159 160 -‐153 -‐156) imp:h 1 c contents of the left atrium 59 3 -‐1.04 (-‐158 -‐153 156):(-‐160 -‐153 -‐156) imp:h 1 60 3 -‐1.04 -‐161 162 -‐153 -‐156 159 imp:h 1 $right atrium 61 3 -‐1.04 -‐162 -‐153 -‐156 159 imp:h 1 $contents-‐right atrium 62 3 -‐1.04 ((-‐82 164 -‐165 52 -‐36):(-‐82 49 164 -‐165 166 -‐52)) #19 #20 & imp:h 1 $small intestine 63 3 -‐1.04 ((-‐16 5 -‐19):(19 -‐6 -‐21 114)) #8 #9 #10 #11 #12 #13 #14 & #18 #19 #20 #24 #25 #26 #28 #29 #41 #411 #412 #45 #47 #48 #49 #50 & #52 #53 #54 #55 #56 #57 #58 #59 #60 #61 #62 #118 imp:h 1 $trunk c male genitalia 64 3 -‐1.04 ((171 -‐5)(172 -‐170)(-‐119 169)(313 413)) 43 44 imp:h 1
75
c Patient phantom (******* Replaced by MIRD phantom ********) c 1010 3 -‐1 10002 -‐9102 -‐9103 #71 imp:h 1 c 1011 3 -‐1 3001 -‐3002 -‐9103 imp:h 1 c 1012 3 -‐1 3003 -‐3004 -‐9103 imp:h 1 c 1013 3 -‐1 3005 -‐9102 -‐9103 imp:h 1 c 1001 3 -‐1 3000 -‐3001 -‐9103 imp:h 1 c 1002 3 -‐1 3002 -‐3003 -‐9103 imp:h 1 c 1003 3 -‐1 3004 -‐3005 -‐9103 imp:h 1 c 71 3 -‐1 -‐9900 imp:h 1 c 72 3 -‐1 -‐9901 imp:h 1 c 73 3 -‐1 -‐9902 imp:h 1 c 74 3 -‐1 -‐9903 imp:h 1 c 75 3 -‐1 -‐9904 imp:h 1 c 76 3 -‐1 -‐9905 imp:h 1 c 77 3 -‐1 -‐9906 imp:h 1 c 78 3 -‐1 -‐9907 imp:h 1 c 79 3 -‐1 -‐9908 imp:h 1 c 80 3 -‐1 -‐9909 imp:h 1 c Cement Wall 1200 8 -‐2.3 9402 -‐9513 -‐10003 20004 imp:h 0 c Air past cement wall 1201 4 -‐0.001205 -‐10002 -‐10003 9513 20004 imp:h 1 1202 4 -‐0.001205 9514 -‐10002 -‐20004 imp:h 1 c Range Shifter 1400 4 -‐0.001205 -‐10000 9350 -‐9351 imp:h 1 $Range shifter is unnecessary c 1 Air Between S1 and S2 1131 4 -‐0.001205 -‐2003 1112 -‐10000 imp:h 1 c Air left of Mid-‐Base Plate 1121 4 -‐0.001205 -‐9201 2004 -‐10000 imp:h 1 c Nozzle Casing 1020 0 -‐1111 10001 -‐10000 imp:h 1 $Vacuum for incoming beam 1021 5 -‐8.49 10001 10000 -‐20002 -‐9201 imp:h 1 $Before Mid Base Plate 1022 4 -‐0.001205 10001 20002 -‐20004 -‐9201 imp:h 1 $Outside casing b4 MBP 1023 5 -‐8.49 9201 -‐9402 20003 -‐20004 imp:h 0 $From MBP to SBP c Mid-‐Base Plate 1051 5 -‐8.49 9000 9201 -‐9202 -‐20003 imp:h 1 c Pre-‐Collimator 1052 5 -‐8.49 9000 9301 -‐9302 -‐20003 imp:h 1 c Snout Base Plate 1053 5 -‐8.49 -‐9402 9401 20001 -‐20003 imp:h 1 1054 5 -‐8.49 (-‐9505 9501 9504 -‐9503 9402 -‐9513 ):(9504 -‐9503 -‐9502 9506 & 9402 -‐9513 ):(9508 -‐9504 -‐9505 9506 9402 -‐9513 ):(-‐9507 9503 -‐9505 9506 9402 & -‐9513) imp:h 1 c Snout (Jaws) 1055 5 -‐8.49 9513 -‐9514 -‐20004 #1116 #1117 imp:h 1 c Snout Air 1060 4 -‐0.001205 9402 -‐9513 -‐20004 #1054 imp:h 1 c Phantom air. 1 L 2 R 3 Around c 1101 4 -‐0.001205 -‐10002 9514 -‐20004 imp:h 1
76
c 1102 4 -‐0.001205 10002 -‐10003 -‐10004 9906 9905 9904 9907 9901 9902 9908 & c 9909 9903 (9103 :9102 :-‐10002 ) imp:h 1 c Air: c 0 S2 1 Mid Base Plate 2 Between MBP and Pre-‐Collimator c 3 Pre-‐collimator 4 Between P-‐C & Snout Base Plate 5 Inside Snout Base Plate 1110 4 -‐0.001205 2300 2003 -‐2004 -‐10000 imp:h 1 1111 4 -‐0.001205 -‐9000 9201 -‐9202 imp:h 1 1112 4 -‐0.001205 9202 -‐9301 -‐20003 imp:h 1 1113 4 -‐0.001205 -‐9000 9301 -‐9302 imp:h 1 1114 4 -‐0.001205 9302 -‐9401 -‐20003 #1400 imp:h 1 1115 4 -‐0.001205 9401 -‐9402 -‐20001 imp:h 1 1116 5 -‐8.49 -‐9509 9513 -‐9514 9510 9512 -‐9511 #1117 imp:h 1 1117 4 -‐0.001205 9513 -‐9514 -‐9500 imp:h 1 c Air around entire nozzle 1118 4 -‐0.001205 -‐9402 -‐10003 10001 20004 imp:h 1 c Vacuum 22115 0 -‐10001:10003:10004 imp:h 0 c ************************************************* c S1 c ************************************************* c Lead step c Zmin Zmax Zcylinder 11001 2 -‐11.4 -‐1001 1025 -‐10000 imp:h 1 c Air on lead side 11002 4 -‐0.001205 1111 -‐1025 -‐10000 imp:h 1 c Lexan step 12101 1 -‐1.2 1001 -‐1112 -‐10000 imp:h 1 c Defines Air on RHS of Lexan in S1 c Zmin Zmax Zcylinder c No air on Lexan side for for Step 25! c ************************************************* c S2 c ************************************************* c 210XX is for Lexan in S2 c material density cylinder L border R border Other varia 21001 1 -‐1.2 -‐2300 2301 2002 -‐2001 imp:h 1 21002 1 -‐1.2 -‐2301 2302 2101 -‐2001 imp:h 1 21003 1 -‐1.2 -‐2302 2303 2102 -‐2001 imp:h 1 21004 1 -‐1.2 -‐2303 2304 2103 -‐2001 imp:h 1 21005 1 -‐1.2 -‐2304 2305 2104 -‐2001 imp:h 1 21006 1 -‐1.2 -‐2305 2306 2105 -‐2001 imp:h 1 21007 1 -‐1.2 -‐2306 2307 2106 -‐2001 imp:h 1 21008 1 -‐1.2 -‐2307 2308 2107 -‐2001 imp:h 1 21009 1 -‐1.2 -‐2308 2309 2108 -‐2001 imp:h 1 21010 1 -‐1.2 -‐2309 2310 2109 -‐2001 imp:h 1 21011 1 -‐1.2 -‐2310 2311 2110 -‐2001 imp:h 1 21012 1 -‐1.2 -‐2311 2312 2111 -‐2001 imp:h 1 21013 1 -‐1.2 -‐2312 2313 2112 -‐2001 imp:h 1 21014 1 -‐1.2 -‐2313 2113 -‐2001 imp:h 1 c 211XX is for Air on Lexan side of S2
77
c material density cylinder L border R border Other varia 21101 4 -‐0.001205 -‐2300 2301 2003 -‐2002 imp:h 1 21102 4 -‐0.001205 -‐2301 2302 2003 -‐2101 imp:h 1 21103 4 -‐0.001205 -‐2302 2303 2003 -‐2102 imp:h 1 21104 4 -‐0.001205 -‐2303 2304 2003 -‐2103 imp:h 1 21105 4 -‐0.001205 -‐2304 2305 2003 -‐2104 imp:h 1 21106 4 -‐0.001205 -‐2305 2306 2003 -‐2105 imp:h 1 21107 4 -‐0.001205 -‐2306 2307 2003 -‐2106 imp:h 1 21108 4 -‐0.001205 -‐2307 2308 2003 -‐2107 imp:h 1 21109 4 -‐0.001205 -‐2308 2309 2003 -‐2108 imp:h 1 21110 4 -‐0.001205 -‐2309 2310 2003 -‐2109 imp:h 1 21111 4 -‐0.001205 -‐2310 2311 2003 -‐2110 imp:h 1 21112 4 -‐0.001205 -‐2311 2312 2003 -‐2111 imp:h 1 21113 4 -‐0.001205 -‐2312 2313 2003 -‐2112 imp:h 1 21114 4 -‐0.001205 -‐2313 2003 -‐2113 imp:h 1 c 220XX is for Lead in S2 c material density cylinder L border R border Other varia 22001 2 -‐11.4 -‐2301 2302 2001 -‐2201 imp:h 1 22002 2 -‐11.4 -‐2302 2303 2001 -‐2202 imp:h 1 22003 2 -‐11.4 -‐2303 2304 2001 -‐2203 imp:h 1 22004 2 -‐11.4 -‐2304 2305 2001 -‐2204 imp:h 1 22005 2 -‐11.4 -‐2305 2306 2001 -‐2205 imp:h 1 22006 2 -‐11.4 -‐2306 2307 2001 -‐2206 imp:h 1 22007 2 -‐11.4 -‐2307 2308 2001 -‐2207 imp:h 1 22008 2 -‐11.4 -‐2308 2309 2001 -‐2207 imp:h 1 $bc 2208 is the same 22009 2 -‐11.4 -‐2309 2310 2001 -‐2209 imp:h 1 22010 2 -‐11.4 -‐2310 2311 2001 -‐2210 imp:h 1 22011 2 -‐11.4 -‐2311 2312 2001 -‐2211 imp:h 1 22012 2 -‐11.4 -‐2312 2313 2001 -‐2212 imp:h 1 22013 2 -‐11.4 -‐2313 2001 -‐2213 imp:h 1 c 221XX is for Air on Lead side of S2 c material density cylinder L border R border Other varia 22101 4 -‐0.001205 -‐2300 2301 2001 -‐2004 imp:h 1 22102 4 -‐0.001205 -‐2301 2302 2201 -‐2004 imp:h 1 22103 4 -‐0.001205 -‐2302 2303 2202 -‐2004 imp:h 1 22104 4 -‐0.001205 -‐2303 2304 2203 -‐2004 imp:h 1 22105 4 -‐0.001205 -‐2304 2305 2204 -‐2004 imp:h 1 22106 4 -‐0.001205 -‐2305 2306 2205 -‐2004 imp:h 1 22107 4 -‐0.001205 -‐2306 2307 2206 -‐2004 imp:h 1 22108 4 -‐0.001205 -‐2307 2308 2207 -‐2004 imp:h 1 22109 4 -‐0.001205 -‐2308 2309 2207 -‐2004 imp:h 1 $bc 2208 is the same 22110 4 -‐0.001205 -‐2309 2310 2209 -‐2004 imp:h 1 22111 4 -‐0.001205 -‐2310 2311 2210 -‐2004 imp:h 1 22112 4 -‐0.001205 -‐2311 2312 2211 -‐2004 imp:h 1 22113 4 -‐0.001205 -‐2312 2313 2212 -‐2004 imp:h 1 22114 4 -‐0.001205 -‐2313 2213 -‐2004 imp:h 1 c ************************************************* c Surface Cards c *************************************************
78
c Border of the problem 10001 py -‐250 10002 py -‐15 10003 10 cy 205 10004 py 230 c Casing of Nozzle 10000 10 cy 15.01 20001 10 cy 12.02 20002 10 cy 17 20003 10 cy 23 20004 10 cy 25 c *************Phantom****************************** c 9102 py 30 c 9103 10 cy 15 c **************Apertures*************************** 9000 10 cy 12.01 $based off useful radius c c Mid-‐Base Plate 9201 py -‐177 $ Should change with calcs 9202 py -‐170 $Location should change with calcs c c Pre-‐Collimator 9301 py -‐87 9302 py -‐80 c Range Shifter 9350 py -‐60 9351 py -‐55 c Snout Base Plate 9401 py -‐47 9402 py -‐40 c Snout 9501 10 pz 14 9502 10 pz -‐14 9503 10 px 14 9504 10 px -‐14 9505 10 pz 16 9506 10 pz -‐16 9507 10 px 16 9508 10 px -‐16 9509 10 pz 10 9510 10 pz -‐10 9511 10 px 10 9512 10 px -‐10 9513 py -‐26 9514 py -‐20 9500 10 cy 1 c *********Tumor & Neutron Detectors**************** 9910 10 cy 1.5 9911 py -‐3.5 9912 py -‐2.5
79
9900 10 s 0 23.3 0 2.5 $Tumor volume 9901 10 s 0 73.1 0 2.5 $50cm, 0 degrees 9902 10 s 0 123.1 0 2.5 $100cm, 0 degrees 9903 10 s 0 223.1 0 2.5 $200cm, 0 degrees 9904 10 s 0 23.1 50 2.5 $50cm, 90 degrees 9905 10 s 0 23.1 100 2.5 $100cm, 90 degrees 9906 10 s 0 23.1 200 2.5 $200cm, 90 degrees 9907 10 s 0 63.1 30 2.5 $50cm, 45 degrees 9908 10 s 0 103.1 60 2.5 $100cm, 45 degrees 9909 10 s 0 183.1 120 2.5 $200cm, 45 degrees c *************JUNK********************************** c Brass Wall extends 1 cm beyond 50 cm throw for S2 c To catch widely scattered protons c 20 crosses aperture at x=-‐81 y=15 21 @ y=12.5 c 20 kx -‐46.65653226 0.132474331 -‐1 c 21 kx -‐39.78783871 0.132474331 -‐1 c 22 px -‐150 c Range compensator for patient irregularities shapes dis c ^^^ Will NOT be included in calculations c ************************************************* c S1 c ************************************************* c S1 and S2 calculations done in S1S2conii.xslx c Throw (Distance from S1 to mid-‐SOBP) 250 234.013 c Mid SOBP distance 16.017 c 1001-‐1025 is Lead 1111 py -‐234.552 $ thickness 0.539 1112 py -‐214.0384 $ thickness 19.9746 1001 py -‐234.013 $S1 midplane b/t lead and lexan 1002 py -‐234.5408 $ thickness 0.5278 1003 py -‐234.5284 $ thickness 0.5154 1004 py -‐234.5154 $ thickness 0.5024 1005 py -‐234.5019 $ thickness 0.4889 1006 py -‐234.4879 $ thickness 0.4749 1007 py -‐234.4733 $ thickness 0.4603 1008 py -‐234.4583 $ thickness 0.4453 1009 py -‐234.4427 $ thickness 0.4297 1010 py -‐234.4265 $ thickness 0.4135 1011 py -‐234.4097 $ thickness 0.3967 1012 py -‐234.3923 $ thickness 0.3793 1013 py -‐234.3742 $ thickness 0.3612 1014 py -‐234.3554 $ thickness 0.3424 1015 py -‐234.3357 $ thickness 0.3227 1016 py -‐234.3151 $ thickness 0.3021 1017 py -‐234.2935 $ thickness 0.2805 1018 py -‐234.2708 $ thickness 0.2578 1019 py -‐234.2467 $ thickness 0.2337 1020 py -‐234.2212 $ thickness 0.2082 1021 py -‐234.1939 $ thickness 0.1809 1022 py -‐234.1647 $ thickness 0.1517
80
1023 py -‐234.1329 $ thickness 0.1199 1024 py -‐234.098 $ thickness 0.085 1025 py -‐234.0586 $ thickness 0.0456 c 1052-‐1074 is Lexan 1052 py -‐233.2299 $ thickness 0.7831 1053 py -‐232.4411 $ thickness 1.5719 1054 py -‐231.649 $ thickness 2.364 1055 py -‐230.8541 $ thickness 3.1589 1056 py -‐230.0566 $ thickness 3.9564 1057 py -‐229.2564 $ thickness 4.7566 1058 py -‐228.4535 $ thickness 5.5595 1059 py -‐227.6477 $ thickness 6.3653 1060 py -‐226.8389 $ thickness 7.1741 1061 py -‐226.0269 $ thickness 7.9861 1062 py -‐225.2116 $ thickness 8.8014 1063 py -‐224.3924 $ thickness 9.6206 1064 py -‐223.5696 $ thickness 10.4434 1065 py -‐222.7421 $ thickness 11.2709 1066 py -‐221.9098 $ thickness 12.1032 1067 py -‐221.072 $ thickness 12.941 1068 py -‐220.2281 $ thickness 13.7849 1069 py -‐219.3773 $ thickness 14.6357 1070 py -‐218.5185 $ thickness 15.4945 1071 py -‐217.6505 $ thickness 16.3625 1072 py -‐216.7721 $ thickness 17.2409 1073 py -‐215.8799 $ thickness 18.1331 1074 py -‐214.9709 $ thickness 19.0421 c ************************************************* c S2 c ************************************************* c 2000s define midline and borders for S2 c Distance between midline S1 and S2 50 2001 py -‐184.013 $B/t lead and lexan 2002 py -‐187.1684 $LHS of S2 2003 py -‐189 $Edges of S2 2004 py -‐183.4 c 2100's for Lexan conii 2101 10 ky -‐186.8655215 86.81760578 -‐1 2102 10 ky -‐185.7964035 3.730671629 -‐1 2103 10 ky -‐185.1870546 1.673923991 -‐1 2104 10 ky -‐184.5500469 0.879412751 -‐1 2105 10 ky -‐183.9822357 0.543067936 -‐1 2106 10 ky -‐183.56066 0.390759981 -‐1 2107 10 ky -‐183.3450742 0.329690393 -‐1 2108 10 ky -‐183.3432743 0.329167835 -‐1 2109 10 ky -‐183.4597636 0.37378193 -‐1 2110 10 ky -‐183.6387712 0.489368353 -‐1 2111 10 ky -‐183.8384 0.79296176 -‐1 2112 10 ky -‐184.0106 1.895205291 -‐1 2113 10 ky -‐184.1129 15.3567784 -‐1
81
c 2200s are for Lead conii 2201 10 ky -‐183.95190 2133.653689 -‐1 2202 10 ky -‐183.74072 94.77851958 -‐1 2203 10 ky -‐183.61753 41.99813767 -‐1 2204 10 ky -‐183.49233 22.25378072 -‐1 2205 10 ky -‐183.37913 13.72538119 -‐1 2206 10 ky -‐183.29513 9.871054555 -‐1 2207 10 ky -‐183.25243 8.334584724 -‐1 c 2208 ky -‐183.25243 8.334584724 -‐1 2209 10 ky -‐183.27543 9.456060557 -‐1 2210 10 ky -‐183.31131 12.40960744 -‐1 2211 10 ky -‐183.35100 20.12004388 -‐1 2212 10 ky -‐183.38520 48.10951423 -‐1 2213 10 ky -‐183.40550 389.5240496 -‐1 c 230Xs are for cylinders 2300 10 cy 3.9075 2301 10 cy 2.8221 2302 10 cy 2.605 2303 10 cy 2.3879 2304 10 cy 2.1708 2305 10 cy 1.9538 2306 10 cy 1.7367 2307 10 cy 1.5196 2308 10 cy 1.3025 2309 10 cy 1.0854 2310 10 cy 0.8683 2311 10 cy 0.6513 2312 10 cy 0.4342 2313 10 cy 0.2171 2 pz -‐300.0 4 pz -‐66.0 5 pz 0.0 6 pz 50.80 c 7 px -‐1000.0 c 8 px 1000.0 c 9 py -‐1000.0 c py 1000.0 11 sq 70.56 193.21 0 0 0 0 -‐13632.9 0 0 0 $trunk-‐skin 12 pz 67.18 13 gq 1 1 0 0 0 -‐0.15444 -‐13.90 0 0.01 2.57993 $ left leg 213 gq 1 1 0 0 0 0.15444 13.90 0 0.01 2.57993 $ right leg 313 gq 1 1 0 0 0 -‐0.15444 -‐13.90 0 0 0 $ left leg skin 413 gq 1 1 0 0 0 0.15444 13.90 0 0 0 $ right leg skin 14 sq 88.36 55.2049 0 0 0 0 -‐4877.905 0 0 0 $head 1-‐ skin 15 pz 200.0 16 sq 68.89 190.44 0 0 0 0 -‐13119.41 0 0 0 $trunk 18 sq 86.49 53.7289 0 0 0 0 -‐4647.013 0 0 0 $head 1 19 pz 50.70 $ height of trunk 20 pz -‐65.9 21 cz 4.4 $ neck skin
82
22 pz 55.5 322 pz 55.60 23 cz 4.3 $neck 24 sq 3837.307 2397.444 4877.905 0 0 0 -‐211838.1 0 0 67.18 $head 2-‐skin 524 sq 3642.967 2263.067 4647.03 0 0 0 -‐195732.6 0 0 67.18 $head 2 25 sq 12044.18 4428.157 579.1724 0 0 0 -‐175753.6 -‐5.91 0 31.57 $right lung 26 sq 12044.18 4428.157 579.1724 0 0 0 -‐175753.6 5.91 0 31.57 $ left lung 27 pz 33.40 28 pz 39.60 29 px -‐4.10 30 py 1.30 $ end the section removed from the right lung 31 pz 31.57 32 pz 40.00 33 px 5.90 34 py 0.75 $ end the section removed from the left lung 35 sq 46.6489 130.6449 0 0 0 0 -‐6094.441 0 0 0 $liver 36 pz 19.89 37 pz 31.21 38 p 0.045496 0.033704 -‐0.032041 -‐1 $end def the liver c stomach-‐wall 39 sq 203.787 267.63 74.02193 0 0 0 -‐2009.259 5.56 -‐3.51 25.40 c stomach-‐contents 40 sq 106.9735 149.2013 33.270987 0 0 0 -‐728.7143 5.56 -‐3.51 25.40 c urinary bladder-‐wall 41 sq 63.92322 90.14173 120.4375 0 0 0 -‐833.0538 0 -‐3.78 5.81 c bladder-‐contents 42 sq 47.62656 68.66277 93.7876 0 0 0 -‐553.8064 0 -‐3.78 5.81 c testes-‐left 43 sq 0.213444 0.155867 0.066822 0 0 0 -‐0.04715 0.47 -‐6.15 -‐0.84 c testes-‐right 44 sq 0.213444 0.155867 0.066822 0 0 0 -‐0.04715 -‐0.47 -‐6.15 -‐0.84 45 sq 2311.84 1362.474 3047.57 0 0 0 -‐97976.02 0 0 67.18 $brain c 37 pz 31.21 c 6 pz 50.80 c esophagus-‐thoracic+abdominal portion 48 sq 0.1296 0.6241 0 0 0 0 -‐0.080883 0 2.04 0 175 sq 0.0121 0.2916 0 0 0 0 -‐0.003528 0 2.04 0 176 5 cx 0.52 177 5 px 0.00 178 5 px 5.75 $ end def esophagus 49 sq 4.41 3.00276 0 0 0 0 -‐13.35172 -‐5.91 -‐1.98 0 $ ULI ascending colon-‐wall 50 sq 2.4336 1.44 0 0 0 0 -‐3.504384 -‐5.91 -‐1.98 0 $ascending colon-‐ contents 51 pz 10.49 52 pz 16.82 $end ac. col. 53 sq 0 1.664 4.41 0 0 0 -‐5.43824 0 -‐1.98 18.51 $transverse colon-‐wall 54 sq 0 0.7369 3.8416 0 0 0 -‐2.841247 0 -‐1.98 18.51 $transverse colon-‐contents 55 px 7.30 56 px -‐7.30 57 gq 0.582717 0.3121001 0.0125834 0 0.118198 -‐0.0569686 & -‐6.50134 -‐0.748196 0.17612 17.5822 $ LLI descending colon-‐ wall
83
58 gq 1.207578 0.5175716 0.021441 0 0.1966014 -‐0.118058 & -‐13.473 -‐1.24077 0.423631 37.3229 $descending colon-‐ contents 59 pz 6.33 c 52 pz 17.42 61 ty 1.70 0 6.33 4.15 0.96 1.50 $sigmoid colon -‐portion of upper torus 62 ty 1.70 0 6.33 4.15 0.48 1.02 63 ty 2.09 0 0 2.18 0.96 1.50 $sigmoid colon -‐portion of lower torus 64 ty 2.09 0 0 2.18 0.48 1.02 65 px 2.09 66 gq 1 1 0.00545925 0 0 -‐0.154679 -‐13.9 0 0.963851 42.3854 $left leg bone 67 gq 1 1 0.0054587 0 0 0.154679 13.9 0 0.963851 42.3854 $right leg bone c Left arm bone 68 gq 1.06281 0.194065 1.35525E-‐20 0 0 0.0205897 -‐28.2177 0 -‐0.283315 187.045 c Right Arm Bone 69 gq 1.06281 0.194065 1.35525E-‐20 0 0 0.0205897 26.1558 0 0.243371 160.674 70 pz 50.07 71 tz 0 4.93 49.53 12.40 0.5981 0.5981 $clavicles 72 p 0.65708 1 0 4.93 73 p -‐0.65708 1 0 4.93 272 p 6.2581 1 0 4.93 273 p 6.2581 -‐1 0 -‐4.93 74 sq 67.7329 174.24 0 0 0 0 -‐11801.78 0 0 0 $scapulae 75 sq 67.7329 139.7124 0 0 0 0 -‐9463.126 0 0 0 76 p 0.30 -‐1 0 0 $left 77 p 0.97 -‐1 0 0 78 pz 36.94 79 pz 48.84 80 p 0.30 1 0 0 $right 81 p 0.97 1 0 0 83 sq 101.6064 69.5556 0 0 0 0 -‐7067.294 0 -‐2.52 0 $pelvis 82 sq 90.0601 61.6225 0 0 0 0 -‐5549.729 0 -‐3.19 0 84 pz 15.97 85 pz 10.16 86 py 4.20 87 py -‐2.52 c 75 88 sq 67.7329 174.24 0 0 0 0 -‐11801.78 0 0 0 $rib cage 89 sq 61.4656 130.6449 0 0 0 0 -‐8030.167 0 0 0 90 pz 25.43 91 pz 26.45 92 pz 27.47 93 pz 28.49 94 pz 29.51 95 pz 30.53 205 pz 31.55 96 pz 32.57 97 pz 33.59 98 pz 34.61 99 pz 35.63 100 pz 36.65 101 pz 37.67
84
102 pz 38.69 103 pz 39.71 104 pz 40.73 105 pz 41.75 106 pz 42.77 107 pz 43.79 108 pz 44.81 109 pz 45.83 110 pz 46.85 111 pz 47.87 211 pz 48.89 112 sq 4.41 1.9321 0 0 0 0 -‐8.520561 0 4.62 0 $ spine 113 pz 60.84 114 sq 4.41 1.9321 0 0 0 0 -‐8.520561 0 0.90 0 $ spine 214 pz 25.47 c 45 sq 2311.84 1362.474 3047.57 0 0 0 -‐97976.02 0 0 67.18 $skull-‐crnium(brain) 116 sq 3365.276 2072.18 4316.096 0 0 0 -‐173488.1 0 0 67.18 $skull-‐cranium 117 sq 79.21 48.0249 0 0 0 0 -‐3804.052 0 0 0 $ facial skeleton 118 sq 66.5856 38.3161 0 0 0 0 -‐2551.301 0 0 0 $facial skeleton 119 py 0.0 120 pz 59.11 121 pz 69.03 122 c/z 0 -‐3.56 1.60 $thyroid 123 c/z 0 -‐3.56 0.73 124 py -‐3.56 125 gq 1 1 -‐0.533329 -‐2 0 0 -‐7.12 7.12 57.4912 -‐1536.67 $thyroid (inside R) 126 gq 1 1 -‐0.533329 2 0 0 7.12 7.12 57.4912 -‐1536.67 $thyroid (inside R) 127 gq 1 1 -‐0.11102 -‐2 0 0 -‐7.12 7.12 11.9676 -‐309.844 $thyroid (outside r) 128 gq 1 1 -‐0.11102 2 0 0 7.12 7.12 11.9676 -‐309.844 $thyroid (outside r) 129 gq 1 1 -‐0.059222588 -‐2 0 0 -‐7.12 7.12 5.34927 -‐108.045 $thyroid(inside R) 130 gq 1 1 -‐0.059222588 2 0 0 7.12 7.12 5.34927 -‐108.045 $thyroid(inside R) 131 gq 1 1 -‐0.0123356 -‐2 0 0 -‐7.12 7.12 1.11353 -‐12.4558 $thyroid(outside r) 132 gq 1 1 -‐0.0123356 2 0 0 7.12 7.12 1.11353 -‐12.4558 $thyroid(outside r) 133 pz 51.7075 47 pz 54.43 134 px 0 135 sq 34.40174 213.2593 28.94655 0 0 0 -‐460.832 4.17 5.04 23.59 $ left kidney 136 sq 34.40174 213.2593 28.94655 0 0 0 -‐460.832 -‐4.17 5.04 23.59 $right kidney 365 px 1.74 137 px -‐1.74 138 sq 3.985613 479.4042 86.17038 0 0 0 -‐405.7677 -‐0.38 0 25.45 $pancreas 139 px -‐0.38 339 px 2.15 140 pz 26.85 141 sq 53.40686 111.7355 66.66599 0 0 0 -‐315.3622 7.65 2.52 25.45 $ spleen 142 sq 15.21 52.05623 3.4225 0 0 0 -‐52.05623 0 -‐6.13 43.00 $ thymus 143 1 sq 2.004206 18.03786 0.20821 0 0 0 -‐2.743558 0 0 0 $ left adrenal 144 2 sq 2.004206 18.03786 0.20821 0 0 0 -‐2.743558 0 0 0 $ right adrenal 145 1 pz 0 146 3 so 1.874 $ gall bladder
85
147 3 so 1.768 $ gall bladder 148 3 pz 0 348 3 pz 7.07 149 3 kz 8.2373626 0.05175625 $ gall bladder 150 3 kz 7.7714286 0.05175625 151 4 sq 90.73706 267.45 695.9888 0 0 0 -‐4109.744 0 0 0 $ HEART left ventricle 152 4 sq 16.71992 60.35891 255.3284 0 0 0 -‐507.6185 0 0 0 $ left ventricle(w+c) 153 4 px 0 154 4 sq 461.4591 1360.164 695.9888 0 0 0 -‐20900.82 0 0 0 $right ventricle(w+c) 155 4 sq 298.7539 983.6127 466.4304 0 0 0 -‐11707.45 0 0 0 $ right ventricle 156 4 pz 0 c left atrium (wall+contents)-‐part 1 157 4 sq 90.73706 105.6558 274.9495 0 0 0 -‐1623.549 0 0 0 c left atrium (wall+contents)-‐part 1 158 4 sq 65.90192 77.44 217.8576 0 0 0 -‐1054.431 0 0 0 c left atrium (wall+contents)-‐part 2 159 4 sq 41.32947 48.12474 274.9495 0 0 0 -‐739.5041 0 0 0 c left atrium (wall+contents)-‐part 2 160 4 sq 27.07017 31.8096 217.8576 0 0 0 -‐433.1227 0 0 0 161 4 sq 461.4591 537.3309 274.9495 0 0 0 -‐8256.842 0 0 0 $ right atrium 162 4 sq 357.2938 441 217.8576 0 0 0 -‐6004.7 0 0 0 $right atrium(wall+contents) c 82 sq 90.0601 61.6225 0 0 0 0 -‐5549.729 0 -‐3.19 0 $small intestine 164 py -‐4.08 165 py 1.85 166 pz 12.34 c 36 pz 19.59 $end small intestine 171 pz -‐1.78 $male genitalia 172 p 1 0 0.07722 -‐6.95 $xz plane 170 p 1 0 -‐0.07722 6.95 169 p 0 1 0.07722 -‐6.95 $yz plane c *********************************** c DATA CARDS c *********************************** vol 8930 j 3810 879 821 709 853 81.8 128 22.3 98.6 1.82 j 1310 18.7 j & 157.1 153.2 1250 404 23.2 85.7 258 295 82.64 230.28 86.36 434 161 7.62 & 166 28.9 74.4 30.2 6.94 7.0 37.0 85.4 48.9 32.3 52 149 55.8 12.9 & 53.8 447 18050 36.2 83j tr1 2.43 4.20 27.58 0.54171 0.84057 0 -‐0.84057 0.54171 0 0 0 1 tr2 -‐2.43 4.20 27.58 0.54171 -‐0.84057 0 0.84057 0.54171 0 0 0 1 tr3 -‐1.69 -‐2.69 21.77 0.9722 0 -‐0.2342 -‐0.0400 0.9853 -‐0.1661 0.2307 & 0.1709 0.9579 tr4 0.80 -‐1.70 36.60 0.6345 -‐0.5370 -‐0.5559 -‐0.4243 0.3591 -‐0.8312 0.6460 & 0.7633 0 tr5 0 2.04 30.62 0.678998 -‐0.677776 -‐0.282102 0.706470 0.707743 0 0.199655 & -‐1.199296 0.959385 tr10 0 0 67.18 print 110 101 50 c Lexan -‐1.2 m1 1001 -‐0.055491 &
86
6012 -‐0.755751 & 8016 -‐0.188758 & hlib=.24h c Lead -‐11.4 m2 82208 -‐52.9 & 82206 -‐24.6 & 82207 -‐22.5 & hlib=.24h c Soft Tissue -‐1.04 (From AGE 10) m3 1001 10.454E-‐02 6012 22.663E-‐02 7014 2.490E-‐02 8016 & 63.525E-‐02 11023 0.112E-‐02 12000 0.013E-‐02 14000 0.030E-‐02 & 15031 0.134E-‐02 16000 0.204E-‐02 17000 0.133E-‐02 19000 & 0.208E-‐02 20000 0.024E-‐02 26000 0.005E-‐02 30000 0.003E-‐02 & 37000 0.001E-‐02 40000 0.001E-‐02 & hlib=.24h c Air -‐0.001205 m4 6012 -‐0.000124 & 7014 -‐0.755267 & 8016 -‐0.231781 & hlib=.24h c Brass -‐8.49 Newhauser et al PMB 2005 m5 29063 -‐0.4253955 & 29065 -‐0.1896945 & 30000 -‐0.352 & 82208 -‐0.017442 & 82206 -‐0.008103 & 82207 -‐0.007443 & hlib=.24h c Lung (From AGE10) m6 1000 10.134E-‐02 6000 10.238E-‐02 7000 2.866E-‐02 8000 & 75.752E-‐02 11000 0.184E-‐02 12000 0.007E-‐02 14000 0.006E-‐02 15000 & 0.080E-‐02 16000 0.225E-‐02 17000 0.266E-‐02 19000 & 0.194E-‐02 20000 0.009E-‐02 26000 0.037E-‐02 30000 0.001E-‐02 & 37000 0.001E-‐02 & hlib=.24h c Skeleton (From AGE10) m7 1000 7.337E-‐02 6000 25.475E-‐02 7000 3.057E-‐02 8000 & 47.893E-‐02 9000 0.025E-‐02 11000 0.326E-‐02 12000 0.112E-‐02 14000 0.002E-‐02 & 15000 5.095E-‐02 16000 0.173E-‐02 17000 0.143E-‐02 19000 & 0.153E-‐02 20000 10.190E-‐02 26000 0.008E-‐02 30000 0.005E-‐02 & 37000 0.002E-‐02 38000 0.003E-‐02 82000 0.001E-‐02 & hlib=.24h c Concrete 2.3 m8 1001 -‐0.005558 & 8016 -‐0.498076 & 11023 -‐0.017101 & 12024 -‐0.002026 & 12026 -‐0.0002565 & 12025 -‐0.0002565 &
87
13027 -‐0.045746 & 14028 -‐0.290608 & 14029 -‐0.014756 & 14030 -‐0.009728 & 16032 -‐0.00122 & 16034 -‐0.000063 & 19039 -‐0.017892 & 19041 -‐0.001347 & 20040 -‐0.082941 & 26054 -‐0.000707 & 26056 -‐0.01139 & 26057 -‐0.000265 & hlib=.24h c Brain -‐1.04 c m3 1001 -‐0.107 & c 6012 -‐0.145 & c 7014 -‐0.022 & c 8016 -‐0.712 & c 11023 -‐0.002 & c 15031 -‐0.004 & c hlib=.24h c Water c m3 1001 -‐0.111894 & c 8016 -‐0.888106 & c hlib=.24h c Stainless Steel c m7 1001 -‐0.01 & c 24052 -‐0.1675 & c 24053 -‐0.019002 & c 24050 -‐0.00869 & c 24054 -‐0.00473 & c 26056 -‐0.6331026 & c 26054 -‐0.0403305 & c 26057 -‐0.0146211 & c 28058 -‐0.06808 & c 28060 -‐0.0262231 & c 28062 -‐0.0036345 & c 28061 -‐0.0011399 & c 28064 -‐0.0009256 & c nlib=.66c hlib=.24h mode h n phys:h 250 phys:n 250 sdef axs 0 1 0 dir 1 par=h vec 0 1 0 erg=d1 x=0 y=-‐249 z=67.18 sp1 -‐4 .6006 231 nps 50000000 prdmp 2j 1 c ************************************************* c ******* ALL NEUTRON DOSES ARE IN [cSv/s] ******** c ********** Proton Dose is in [Gy/s] ************
88
c ************************************************* c ****** Need to put in weighting per step ******** c ************************************************* f6:h 16 fc6 Proton dose in the PTV FM6 1.602e-‐10 $ Gy*g/MeV f4:n 41 DF4 IU=2 IC=20 fm4 2.778E-‐2 fc4 Neutron energy deposition averaged over lower spine f14:n 411 DF14 IU=2 IC=20 fm14 2.778E-‐2 fc14 Neutron energy deposition averaged over middle spine f24:n 412 DF24 IU=2 IC=20 fm24 2.778E-‐2 fc24 Neutron energy deposition averaged over upper spine f34:n 17 DF34 IU=2 IC=20 fm34 2.778E-‐2 fc34 Neutron energy deposition averaged over the brain tmesh rmesh11:h pedep cora11 -‐8 31i 8 corb11 -‐10 39i 10 corc11 60 i 74 rmesh21:h pedep cora21 -‐1.5 11i 1.5 corb21 -‐5 23i 1 corc21 65.68 i 68.68 rmesh31:h pedep cora31 -‐1.5 i 1.5 corb31 -‐5 23i 1 corc31 65.68 11i 68.68 rmesh41:h pedep cora41 -‐8 i 8 corb41 -‐10 39i 10 corc41 60 27i 74 endmd c *** Mesh Tally Comments *** c 11: Zoomed out yx plane c 21: Detailed mesh tally of region of maximum dose in yx plane c 31: Zoomed out yz plane c 41: Detailed mesh tally of region of maximum dose in yz plane c MIRD brain data: c zmin = 61 c z middle of z-‐axis in problem to be perpendicular to brain = 67.18 c zmax = 73 c ymin = -‐8.5
89
c ymax = 8.5 c xmin = -‐6.5 c xmax = 6.5
90
REFERENCES Ziegler, J. (2010). The Stopping and Range of Ions in Matter. Retrieved from SRIM: http://www.srim.org Zheng, Y., Newhauser, W. D., Fontenot, J., Taddei, P., & Mohan, R. (2007). Monte Carlo study of neutron dose equivalent during passive scattering proton therapy. Phys. Med. Biol. , 52, 4481-‐4496. Water, L. (2002). Monte Carlo N-‐particle eXtended transport code system for multiparticle and high energy applications. Los Alamos National Labratory, Los Alamos, NM. Wilson, R. (1946). Radiological Use of Fast Protons. Harvard, Cambridge, MA: Research Laboratory of Physics. Agosteo, S., Birattari, C., Caravaggio, M., Silari, M., & Tosi, G. (1998). Secondary neutron and photon dose in proton therapy. Radiotherapy and Oncology (48), 293-‐305. Arzt, L. (2009). Floor Plan of the Loma Linda Proton Therapy Center. Retrieved May 25th, 2010, from The National Association for Proton Therapy: http://www.proton-‐ therapy.org/floor.htm Arduini, G., Cambria, R., Canzi, C., Gerardi, F., Gottschalk, B., Leone, R., et al. (1996). Physical specifications of clinical proton beams from a synchrotron. Medical Physics , 23 (6), 939-‐951. Artz, L. (2010). Proton Therapy Centers. Retrieved June 7th, 2010, from The National Association for Proton Therapy: www.proton-‐therapy.org Berger, M., Inokuti, M., Andersen, H., & al, e. (1993). Stopping Powers and Ranges for Protons and Alpha Particles. ICRU Report 49 . Chu, W. T., Ludewigt, B. A., & Renner, T. R. (1993). Instrumentation for treatment of cancer using proton and light-‐ion beams. Rev. Sci. Instrum. , 64, 2055-‐2122. CMPWG. (2007, July 10). Phantoms. Retrieved October 12, 2010, from Computational Medical Physics Working Group: http://cmpwg.ans.org/phantoms/sample_problems.zip Cristy, M. (1980). Mathematical phantoms representing children of various ages for use in estimates of internal dose. ORNL. Delaney, T. F., & Kooy, H. M. (2008). Proton and Charged Particle Radiotherapy. Philidelphia, PA: Lippincott Williams & Wilkins. Fontenot, J., Newhauser, W. D., & Titt, U. (2005). Design Tools For Proton Therapy Nozzles Based on The Double-‐Scattering Foil Technique. Radiation Protection Dosimetry , 116 (1-‐4), 211-‐215. Goiten, M. (1984). Compensating for heterogeneities in proton radiation therapy. Phys. Med. Biol. , 29, 553-‐567.
91
Gottschalk, B. (2004). Passive beam spreading in proton radiation therapy. Gottschalk, B. (2009). The current version of NEU can be downloaded from. From http://huhepl.harvard.edu/~gottschalk Gottschalk, D. B. (2007, November 21). BGdocs.zip. Retrieved May 25, 2010, from Gottschalk: http://huhepl.harvard.edu/~gottschalk Hall, E. (2009). Radiobiology for the Radiologist (6th Edition ed.). Philidelphia: Lippincott Williams & Wilkins. Newhauser, W., Fontenot, J., Zheng, Y., Polf, J., Titt, U., Koch, N., et al. (2007). Monte Carlo simulations for configuring and testing an analyrical proton dose-‐calculation algorithm. Phys. Med. Biol. , 52, 4569-‐4584. Newhauser, W., Koch, N., Hummel, S., Ziegler, M., & Titt, U. (2005). Monte Carlo simulations of a nozzle for the treatment of ocular tumours with high-‐energy proton beams. Phys. Med. Biol. (50), 5229-‐5249. Mesoloras G, S. G. (2006). Neutron Scattered Dose Equivalent to a fetus from proton radiotherapy of the mother. Med Phys. , 33, 2479-‐2490. ORNL. (2002, August 6). Description of the Mathematical Phantom. Retrieved October 12, 2010, from ORNL Center for Biokinetic and Dosimetric Research: http://ordose.ornl.gov/resources/phantom.html Pelowitz, D. (2005). MCNPX User's Manual. Los Alamos, NM: LANL. Polf, J. C., & Newhauser, W. D. (2005). Calculations of neutron dose equivalent exposures from range-‐modulated proton therapy beams. Phys. Med. Bio (50), 3859-‐3873. Siebers, J. (2000). Application of Monte Carlo to Proton Beam Radiation Therapy. In e. a. A. Kling (Ed.), Monte Carlo 2000: Advanced Monte Carlo for Radiation Physics, Particle Transport Simulation and Applications (pp. 1051-‐1056). Lisbon, Portugal: Springer Verlag. Tayama, R., Fujita, Y., Tadokoro, M., Fujimaki, H., Sakae, T., & Terunuma, T. (2006). Measurement of neutron dose distribution for a passive scattering nozzle at the Proton Medical Research Center (PMRC) . Nuclear Instruments & Methods in Physics Research , 532-‐ 536. Titt, U., Zheng, Y., Vassiliev, O. N., & Newhauser, W. D. (2007). Monte Carlo investigation of collimator scatter of proton-‐therapy beams produced using the passive scattering method. Phys. Med. Biol. , 53, 487-‐504. Tourovsky, A., Lomax, A., Schneider, U., & Pedroni, E. (2005). Monte Carlo dose calculations for spot scanned proton therapy. Phys. Med. Biol. (50), 971-‐981.
92