USING MULTI-REPRESENTATIONAL COMPUTER TOOLS TO MAKE SENSE OF INFERENCE Hollylynne Stohl James E. Tarr North Carolina State University University of Missouri
[email protected] [email protected] Abstract. We report how two sixth-grade students used software tools to formulate and evaluate inferences based on simulation data. Students’ interactions were analyzed during a 12-day instructional program that utilized Probability Explorer software as a primary investigation tool. A variety of microworld tools enabled students to recognize the importance of using larger samples to draw valid inferences. Vignettes from three instructional tasks are included. In recent years, the National Council of Teachers of Mathematics (NCTM, 2000) has advocated that all students develop and evaluate inferences that are based on data. Specifically it is recommended that "upper-elementary and early middle grades students… begin to develop notions about statistical inference" (p. 50) and suggest the use of computer simulations to facilitate student learning in probability. Investigating students’ probabilistic reasoning with technology tools, however, is a recent endeavor (e.g., Pratt, 2000; Drier, 2000a, 2000b). In fact, there exists a gap in knowledge of early adolescent learne rs’ development of probabilistic reasoning with open-ended multi-representational software. Our research sought to determine the role technology tools plays in students' development of the notion of statistical inference. In this paper, we report how two students used software tools to formulate and evaluate inferences based on data from simulations. Theoretical Perspective The framework for our research is based on a coordinated perspective of learning. In particular, we believe that learning is a constructive process of resolving perturbations through reflection and abstraction (von Glasersfeld, 1995), occurs within a social context in which meanings are negotiated through interactions with other cognizing individuals (Voigt, 1996), and is enabled and constrained by tools and resources within the environment (Graue & Walsh, 1998). We believe that the intended and enacted mathematical tasks, students’ interactions with microworld tools, and the social interaction among students and between students and teachers, all operate as potential meaning- making agents for the development of probabilistic reasoning. Thus, this constructivist framework guided the design of the microworld tools, instructional tasks, and classroom teaching throughout our research. Several researchers (e.g., Biddlecomb, 1994; Land & Hannafin, 1996; Battista, 1998) have worked with children and developed principles for designing and using open-ended computer microworlds to facilitate students’ construction of knowledge. Biddlecomb (1994) emp hasizes that “computer environments must be very flexible in order to make them as open as possible for the teacher and students to construct their own individual and shared mathematical environments” (p. 91). A well-designed open-ended learning environment (OELE) enables learners to build and test their intuitive notions in an exploratory manner such that their understanding evolves as a continuous and dynamic process through observation, reflection, and experimentation (Land & Hannafin, 1996). Probability Explorer (PE, Stohl, 1999-2002) is purposefully designed as an OELE with multiple ways to represent data that engage students in designing, simulating, and analyzing results of probability experiments. At a fundamental level, data is represented in PE with randomly generated icons that can be sorted, stacked (in a
To appear in D. Mewborn (Ed.), Proceedings of the twenty-fourth annual meeting of the North American Chapter of the International Group for the Psychology of Mathematics Education. Athens, GA. October, 2002.
2
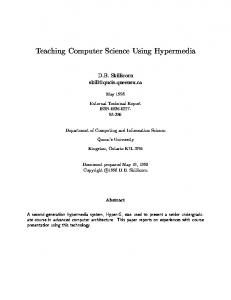
pictograph) or lined up in the sequence in which they occurred. A Pie Graph (relative frequency), Bar Graph (frequency), and Data Table (counts, fractions, decimals, and percents) are also available to display results dynamically changing during a simulation (see Figure 1).
Figure 1. Data displays of 25 tosses of a fair coin. Students can use PE to develop their abilities to conjecture and evaluate inferences when they have opportunities to explore a variety of probability situations, determine how many trials to run, and choose which tools to use to analyze data. One of the most important aspects of formulating and evaluating inferences is understanding the unpredictability of random phenomeno n in the short-run but predictability in the long-run trends in data (i.e., the law of large numbers). Thus, the sample size in a simulation becomes an important factor for students to consider when making inferences from a sample distribution to the population and making connections between empirical and theoretical probability. Prior research has shown the difficulty students experience in reasoning consistently about the effect of sample size. Fischbein and Schnarch (1997) found that students’ acceptance of the use of small sample sizes increased dramatically from 5th to 11th grade. They hypothesize that “this misconception is based on the idea that a ratio is representative of an indefinite pair of numbers” (p. 101). Stavy and Tirosh (2000) attribute this erroneous conception to an intuitive rule based on “Same A - Same B” by which students assume that if the results are in the same proportion then the chance of each result occurring is the same. Stavy and Tirosh also found that students’ use of this intuitive rule seems to become more prominent with age and as their ability to recognize proportionality stabilizes. Research on instruction aimed at helping students develop intuitive notions about sample size has shown to positively effect students’ understanding about the power of sampling in making inferences. Metz (1999) found that, after the provision of extensive experiences in designing, implementing, and critiquing investigations within a science context, 41% of second, fourth, and fifth grade students made arguments for the use of large samples to make inferences about a population. In a study with sixth grade students, Aspinwall and Tarr (2001) found that prior to instruction, 5 of their 6 case study students showed no or little awareness of the relationship between experimental probability and sample size, and typically thought that any size sample should reflect the parent distribution. Their analyses indicated that game- like situations in which the chance of winning is unequally distributed between players helped students to understand the role sample size plays in making probability judgments. Students learned that outcomes with smaller probabilities are more likely to win with a small number of trials while outcomes with higher probabilities are increasingly favored as the number of trials increases.
To appear in D. Mewborn (Ed.), Proceedings of the twenty-fourth annual meeting of the North American Chapter of the International Group for the Psychology of Mathematics Education. Athens, GA. October, 2002.
3
Using computer tools and representations provides students with different ways to simulate and interact with data to make inferences. In prior research with PE, Drier (2000a, 2000b) found that fourth-grade students used the representations in PE as both objects to display and interpret data, and as dynamic objects of analysis during experimentation to develop a notion of the “evening-out phenomenon.” These students recognized that larger number of trials resulted in distributions that closely resembled what they expected from the theoretical probabilities based on how they had designed an experiment. Pratt (2000) also found that 10- year old students working with a Chance-Maker microworld made a connection between the number of trials and the distribution of data (viewed in pictographs and pie graphs) and that they could use a “workings box” to control the theoretical probability, which also affected the distribution of data. The findings of both Pratt and Drier suggest that simulation tools that give students control over designing experiments, running as many trials as they desire, and viewing graphical representations of results may help in the development of deeper understandings of how theoretical probability, empirical probability and sample size can be used to make inferences. Considering our theoretical perspective on learning in a technological environment and the implications from prior research, we sought to explore the following questions in our focused analysis of two case students: • How do these students use Probability Explorer tools to simulate experiments and analyze data as part of their meaning- making processes in solving a variety of probability tasks? • How do these students socially nego tiate an understanding of the interplay of theoretical probability, empirical probability and sample size, and use these understandings and computer-based tools to conjecture and justify inferences based on data? Methods of Inquiry and Data Sources This research report focuses on two average- level sixth- grade students who participated in a larger study of 23 sixth- grade students in an average- level mathematics class in an urban, southern public middle school. Prior to instruction, in collaboration with the regular classroom teacher, we purposively selected (Lincoln & Guba, 1985) Manuel (Hispanic male) and Brandon (Caucasian male) to serve as one of three case study pairs. These students were chosen to reflect the ethnic and socioeconomic diversity within the class and were representative of average-level mathematical achievement based upon scores on standardized tests in mathematics as well as a pre-instructional test in probability. Research Setting and Data Sources All students were seated in pairs at tables in their regular classroom with a PC laptop, calculators, and manipulative materials (e.g., dice, spinners) readily available. Manuel and Brandon's laptop computer was connected to a PC-to-TV converter to internally video-record their computer interactions while microphones captured their conversations. We used video recording because it is particularly useful in trying to access students’ construction of mathematical understandings (Pirie et al., 2001) and gave us a direct record of how they used the computer tools. For this paper, additional data from the instructional sequence was used in the analysis. In particular, the whole-class video, students’ written class work and homework assignments comprised the data corpus. Instructional Program We developed and co-taught a 12-day probability unit utilizing PE as a primary investigation tool. Several characteristics were common to the instructional tasks. Problem tasks represented
To appear in D. Mewborn (Ed.), Proceedings of the twenty-fourth annual meeting of the North American Chapter of the International Group for the Psychology of Mathematics Education. Athens, GA. October, 2002.
4
random phenomena that occur in a variety of contexts (e.g., pulling fish from a lake, selecting marbles from a bag). Typically instructional tasks required students to model the phenomena, carry out simulations using PE, and collect, display and analyze data in order to draw appropriate inferences and formulate convincing arguments based on data. The design and implementation of our instructional program were influenced by the Mathematics Teaching Cycle (Simon, 1995). We utilized this conceptual framework to create purposeful pedagogy that reflected our goals for student learning yet was responsive to students’ ideas and practices. More specifically, we generated hypothetical learning trajectories prior to instruction and made adaptations based on our ongoing assessment of students’ probabilistic reasoning. In this regard the design of our curriculum was an iterative process based on student interaction with the instructional tasks, microworld tools, and the teacher-researchers. Methods of Analysis To understand the interactions that comprise students’ meaning- making processes, our research draws upon an interpretivist approach to inquiry (Graue & Walsh, 1998) using a case study method (Stake, 1995). In particular, we used qualitative research methods to observe and critically analyze students' probabilistic reasoning, meaning- making processes, and social and computer interactions while using PE. An analytic model for examining videotape data (Powell, 2001) was used to study the growth of students' probabilistic reasoning and their use of computer tools. More specifically, this method was used to identify critical events (or conceptual leaps) and the interactions that elicited such critical events. Results For the purpose of this paper, we included an analysis of Brandon and Manuel’s use of PE tools on three instructional tasks. In the first task, students used features of PE to estimate the distribution of marbles in a mystery bag. In the second task, they used PE's Weight Tool feature to design a simulation model for a given spinner and to validate their model. In the third task, they used repeated simulations of various sample sizes to determine whether a die was fair and to estimate the probability of each number on the die occurring. Throughout these tasks, Brandon and Manuel used several PE tools in making informal inferences based on their developing understanding that simulations and data analysis should inform their judgments. The results presented below illustrate how their ability to design and simulate experiments, use various microworld tools, support inferences with data, and formulate convincing arguments developed across the tasks. Mystery Marble Bag Task On the 4th day of instruction, students used PE to collect and analyze data in order to draw inferences regarding the composition of a bag containing 10 marbles. Brandon and Manuel chose the Run Until tool as a novel heuristic in their problem solving. (The Run Until tool allows users to select an outcome and run a simulation until that outcome occurs). They effectively used Run Until in two distinct ways. First, by repeatedly sampling one marble with replacement they inferred which colors of marbles were most likely not in the bag; and second, in deciding which colors were certainly present. The following excerpt reveals both uses of Run Until. Brandon: Wait. Wait. Wait. This is what you do: Run experiment until you get an outcome of white. Do Run Until so you can see if there are any whites. [After 17 trials with no white outcomes] I don’t think there are any whites in the bag -- zippo! Teacher: Why do you say that? Brandon: [As marbles continue to be sampled with replacement] Because we’re running 30 trials and there’s no whites!
To appear in D. Mewborn (Ed.), Proceedings of the twenty-fourth annual meeting of the North American Chapter of the International Group for the Psychology of Mathematics Education. Athens, GA. October, 2002.
5
Manuel: So far and we’ve run it until there’s a white. [After Run Until yields no green outcomes in 76 trials, they use Run Until black] Well what do you know? No black! Teacher: Why do you say that? You’ve done it (only) 14 times. Manuel: [As marbles continue to be sampled with replacement] Make that 25 -- No, 30! Teacher: At what point… do you have enough evidence to say, “There’s no black”? Both: Because you’ve run it 50 times! Teacher: But you were saying that back at 10 (trials). Brandon: Well, that was our guess. Now we’re for sure (right). Now we’re very confident and that was the goal, to be very confident. Manuel: I know what the colors are: Red, yellow and blue! On the subsequent day, Brandon preselected a distribution of 12 marbles. Manuel’s goal was to estimate the composition of the bag. He made efficient use of Run Until since he only needed to use Run Until once to decide which colors were and were not in the bag. After 140 trials yielded no white outcomes, the sample continued to grow to 500 after which Manuel observed that it contained no green or yellow marbles. Moreover, he remarked that only red, yellow and blue marbles comprised the set of 500 outcomes. After concluding that only these three colors were present in the bag, Manuel subsequently ran several sets of 10 trials and used an informal approach for inferring the number of marbles of each color by estimating a mean of the most commonly observed frequencies. In this task, Brandon introduced the use of the Run Until tool as a strategy, but Manuel quickly realized how the data was providing relevant information. It is interesting that Manuel only used a large number of trials with the Run Until tool as evidence to infer which colors were in the bag, but repeatedly used a small sample size (10) to make his inference about the distribution of colors of marbles. Since he knew that the bag only contained 12 marbles, the use of a large number of trials may not have helped him unless he could use proportional reasoning to infer the distribution based on percentages or the empirical distributions of colors. Although Manuel used a larger number of trials to infer which of the six colors were present in the bag, large numbers of trials would only be useful to find the distribution if he was able to use proportional reasoning which may not have been intuitive or accessible to him. Spinner Simulation Task On the 9th day of instruction, Brandon and Manuel used the Weight Tool to create a model for a spinner (Figure 2). They used the Pie Graph as a primary representation to analyze data and test the “goodness” of their model and used decimals and percents in the Data Table as secondary representations. They mostly ran multiple sets of 100 trials and occasionally a larger number of trials. Consider the following two episodes that illustrate their meaning- making about the connection between theoretical and empirical probability using several PE tools.
Figure 2. Spinner and Weights used in PE
To appear in D. Mewborn (Ed.), Proceedings of the twenty-fourth annual meeting of the North American Chapter of the International Group for the Psychology of Mathematics Education. Athens, GA. October, 2002.
6
Episode 1. A teacher-researcher challenged Brandon and Manuel to design a model of the spinner shown in Figure 2 using a total weight of 50. Manuel typed in 20:10:20 in the Weight Tool. Brandon claimed "that's not right" and Manuel said, “I bet you a billion dollars it is.” The teacher-researcher asked Manuel to convince Brandon that 20:10:20 could be used to model the spinner. Manuel struggled to explain how the weight model was in proportion to the original weights of 4:2:4 or the spinner regions. Brandon decided to run simulations in PE to "see if it still comes close, as long as we have the same percentages." He ran 100 trials with the Pie Graph and Data Table open and after 60 trials said, "That looks pretty right." When the 100 trials were complete [showing a 34:23:43 distribution] he said, "Okay, that's right." Manuel interjected, "Yeah, I just don't know how to explain it." Brandon continued to run sets of 50 and 100 trials. After several sets of trials Brandon claimed, "Well, that is pretty close… Well, he's right cause I see the pie graph and I agree with him." By comparing percentages of the theoretical probability in the Weight Tool with the empirical data shown in the Pie Graph and Data Table, Brandon seemed to understand that empirical data could be used to support or confute the notion that weights of 20:10:20 appropriately modeled the spinner. His use of 50 and 100 trials were not particularly large, but he may have been using these numbers since 50 is compatible with the total weight and 100 is convenient in reasoning about part-whole relationships in the Pie Graph. It is important to note that Brandon needed to run several sets of 50 and 100 trials before he was convinced that the empirical data supported that weights of 20:10:20 accurately modeled the spinner. Episode 2. The software application froze while they modeled a second spinner. The spinner and their initial weights are shown in Figure 3. Brandon restarted the application and redesigned the weights but mistakenly inserted a 5 (rather than 3) for the “rock” representing the green sector.
Figure 3. Second spinner and weights in PE. Brandon ran 100 trials and Manuel commented that the Pie Graph looked "way off" (sectors representing the Smiley Face and Rock were each about 40%). Brandon responded, “No sir!” and Manuel argued, “Yes, that is so off, let me look at the Weight Tool.” He opened the Weight Tool and remarked, “See? You did the wrong weights. Rock was supposed to be 3, that is why the pie (graph) looked funny.” Although Brandon used empirical data to test the weights used for the first spinner, it was Manuel who seemed to make the connection between the empirical data and the weights and was able to apply his understanding when the Pie Graph did not appear as he expected. In this task, both students made sense of how empirical data could be used to test a conjecture. This type of meaning- making is an important component to being able to use empirical data from a large number of trials to make inferences. The subsequent task in the
To appear in D. Mewborn (Ed.), Proceedings of the twenty-fourth annual meeting of the North American Chapter of the International Group for the Psychology of Mathematics Education. Athens, GA. October, 2002.
7
instructional sequence (Schoolopoly) required students to make inferences regarding the fairness of a die and support their claim with evidence (i.e., data). Schoolopoly Task On the 10th and 11th days of instruction, Brandon and Manuel sought to investigate claims that a company manufactured faulty (biased) dice. Unbeknownst to them, weights of 2-3-2-3-2-3 were preloaded into the Weight Tool for the outcomes, 1-6, respectively. Their assignment was to collect evidence to support or reject claims that the die is biased and to estimate the theoretical probability of each outcome, 1-6. On Day 10, they began by running a total of 51 trials; they noticed that 5 occurred only three times and this result focused their attention on the number of 5s in a subsequent set of 500 trials. While the simulation ran, they repeatedly commented on the low number of 5s and 1s in relation to the other frequencies and hypothesized that these outcomes were relatively difficult to obtain. Manuel decided to run 50 (new) trials and used the Data Table and Stack column to analyze data. This set of data yielded many 5s leading Brandon to argue that the die was indeed fair. Manuel ran a second set of 50 trials with a 9-6-4-11-9-11 distribution which led Brandon to announce “dang this is fair.” His notion of fairness was grounded in the observations of indiscernible patterns in the sample distributions from relatively small sets of data. Brandon and Manuel concluded Day 10 by writing that they believed their die was fair. At the start of Day 11, Brandon had control of the mouse and set the number of trials to 300 because it represented a large multiple of 6. As the simulation ran, they monitored the relative frequencies displayed in the Data Table, Pie Graph and Bar Graph. At 60 trials, with few 5s occurring (represented in red on the Pie Graph and Bar Graphs), Brandon cheered, "Come on! Get even red!" then remarked, "I think it's actually fair" and dismissed the non-uniform sample distribution by arguing, "5 just got off to a bad start." As the simulation of 300 trials neared completion, Brandon concluded, "It's pretty fair… It's only 5 and 3 and 1 are a bit behind" (pointing to sectors in Pie Graph). Upon reflection, Brandon altered his belief about fairness and stimulated the following discourse: Brandon: I really don’t think it's fair. Manuel: [In disbelief] Why? Brandon: Just because, I -Manuel: Every single thing doesn’t have to be even, man, it’s the luck. They are pretty much close. Brandon: Yeah, you're right. Let’s just do another 500 (trials). Manuel: Let’s do one million. Brandon: No, let's do 6000. [Manuel sets the number of trials to 500] Now run it once. [Manuel hits Run] Now click 500 one more time. Manuel: I want to do the Pie Graph [opens Pie Graph, then Bar Graph, and Data Table at about 400 trials]. Brandon: I still think that 1… 5 is continuously behind. Manuel: If you don’t think this is fair… It's fair, man. Brandon: But look at the 5 [There are 580 trials with distribution of 88, 115, 80, 108, 79, and 111] Manuel: It doesn’t all have to be perfect, man! No one is going to get theirs this way that much. Brandon: [At 650 trials] Look at the percents: 13 (percent for 5), 13 (percent for 3)… I bet you that's (the weights of) 3, 3, 3, 2, 2, and 1.
To appear in D. Mewborn (Ed.), Proceedings of the twenty-fourth annual meeting of the North American Chapter of the International Group for the Psychology of Mathematics Education. Athens, GA. October, 2002.
8
Manuel: I bet you're wrong. I bet we're fair. Brandon: I bet we aren't fair. Manuel: Well, I don’t care. We are fair. Just because it's not all even doesn't mean we're not fair. Dude, we're already up to 1000 (trials). Brandon: But still, I really don’t think… it's only beating it by about a hundred. Manuel: It's not that unfair. [At 1300 trials] See 3 and 5 and 1 are practically the same. Brandon: So they must have the same probability but that might have been more because (inaudible). Manuel: [At approximately 1500 trials -- See Figure 4] Wait a second. Wait a second. We are unfair. These two… all of these [pointing to 1, 3 and 5] are (weighted) 1 and all of these [referring to 2, 4 and 6] are (weighted) 2. So 2, 4, 6. We're unfair. Brandon: Thank you. I told you! They continued to run sets of large trials (1500 or more) and determined that “6, 4, and 2 had higher probability than 5, 3, and 1” and estimated the probability for 1-6 occurring, as 14%, 20%, 13%, 20%, 13%, and 20%, respectively.
Figure 4. Data from simulation of Schoolopoly task Students' use of software features (most notably displays of data) challenged their beliefs regarding fairness. More specifically, they learned to place value in sample distributions generated from larger sets of data. Specifically, Brandon monitored the sample distribution as the number of trials grew large; in doing so, he was able to reconsider the notion that "5 just got off to a bad start" and instead inferred that the die was biased. Similarly, Manuel used data to reject his initial belief that variation among a sample is attributed exclusively to randomness; he detected bias using patterns in data as the number of trials grew large. Together, they negotiated the inference about the die based on data collection, lengthy discussions, and analyzing patterns in data from increasingly larger samples of data. Discussion Our research indicates that the instructional sequence and microworld tools successfully fostered students' ability to make appropriate inferences based on data. In particular, Brandon and Manuel’s use of computer tools, coupled with social interaction, enabled them to make connections between simulation data (empirical probabilities) and weights in the Weight Tool (theoretical probabilities). Since the tasks were purposely designed to build toward a more powerful form of inference, their use of data to make inferences in each task was slightly different. The Schoolopoly task intentionally required students to make inferences about a
To appear in D. Mewborn (Ed.), Proceedings of the twenty-fourth annual meeting of the North American Chapter of the International Group for the Psychology of Mathematics Education. Athens, GA. October, 2002.
9
population, which is more sophisticated than drawing inferences regarding the part-part distribution present within a bag of marbles. The intermediate task, Spinner Simulation, represented a purposeful attempt to transition students into part-whole reasoning through use of a pie graph representation. In addition, by grouping students in pairs or small groups, they were able to negotiate meaning of what constitutes evidence and, in particular, the role data plays in supporting arguments. Brandon's use of software tools (Pie Graph, percents in Data Table) to reason proportionally when making inferences enabled Manuel to make a transition from primitive reasoning into informal proportional reasoning. Previous research (Fischbein & Schnarch, 1997; Stavy & Tirosh, 2000) indicates that students may not conceive the power of sample size because they invoke proportional reasoning and assume that every sample should be in proportion to (or reflect) the parent population. Such research, however, was based on written tasks that denied student access to simulation tools. Consistent with Pratt (2000) and Drier (2000a, 2000b), our results suggest that young adolescents can develop powerful notions about statistical inference when using simulation tools, recognize the importance of using larger samples in drawing valid inferences, and use data displays to make connections between theoretical and empirical probabilities. Further research needs to investigate whether sustained access to simulation tools and engagement in tasks about inference can help young students maintain notions of the effect of sample size even when their proportional reasoning stabilize at a later age. References Aspinwall, L. & Tarr, J.E. (2001). Middle school students' understanding of the role sample size plays in experimental probability. Journal of Mathematical Behavior, 20, 1-17. Battista, M. T. (1998). Computer environments that engender students’ construction of mathematical ideas and reasoning: A constructivist perspective. Paper presented at the ENC Technology and NCTM Standards 2000 Conference. Arlington VA, June 5-6, 1998. Biddlecomb, B. D. (1994). Theory-based development of computer microworlds. Journal of Research in Childhood Education, 8(2), 87-98. Drier, H. S. (2000a). Children’s Probabilistic Reasoning with a Computer Microworld. Unpublished doctoral dissertation. University of Virginia. Drier, H. S. (2000b). Children's meaning- making activity with dynamic multiple representations in a probability microworld. In M. Fernandez (Ed.), Proceedings of the Twenty-Second Annual Meeting of the North American Chapter of the International Group for the Psychology of Mathematics Education, (pp.691-696). Columbus, OH: ERIC Clearinghouse of Science, Mathematics, and Environmental Education. Fischbein, E. & Schnarch, D. (1997). The evolution with age of probabilistic, intuitively based misconceptions. Journal of Research in Mathematics Education 28(1), 96-105. Graue, M. E., & Walsh, D. J. (1998). Studying children in context: Theories, methods, and ethics. Thousand Oaks, CA: Sage Publications. Land, S. M., & Hannafin, M. J. (1996). A conceptual framework for the development of theories-in-action with open-ended learning environments. Educational Technology Research and Development 44(3), 37-53. Lincoln, Y. S. & Guba, E. G. (1985). Naturalistic inquiry. Beverly Hills, CA: Sage Publications. Metz, K. E. (1999). Why sampling works or why it can't: Ideas of young children engaged in research of their own design. In R. Hitt & M. Santos (Eds.), Proceedings of the Twenty-First Annual Meeting of the North American Chapter of the International Group for the
To appear in D. Mewborn (Ed.), Proceedings of the twenty-fourth annual meeting of the North American Chapter of the International Group for the Psychology of Mathematics Education. Athens, GA. October, 2002.
10
Psychology of Education (pp. 492-498). Columbus, OH: ERIC Clearinghouse of Science, Mathematics, and Environmental Education. National Council of Teache rs of Mathematics (2000). Principles and Standards for School Mathematics. Reston, VA: author. Pirie, S.I.B., Borgen, K., Manu, S.S., Jenner, D., Thom, J., & Martin, L.C. (2001). Theory, video and mathematical understanding: An examination of what different theoretical perspectives can offer. In R. Speiser, C. A. Maher & C. N. Walter (Eds.), Proceedings of the TwentyThird Annual Meeting of the North American Chapter of the International Group for the Psychology of Education (pp. 343-380). Columbus, OH: ERIC Clearinghouse of Science, Mathematics, and Environmental Education. Powell, A. (2001). Inquiry into videotape analysis for studying the growth of mathematical understanding. In R. Speiser, C. A. Maher & C. N. Walter (Eds.), Proceedings of the TwentyThird Annual Meeting of the North American Chapter of the International Group for the Psychology of Education (pp. 84-86). Columbus, OH: ERIC Clearinghouse of Science, Mathematics, and Environmental Education. Pratt, D. (2000). Making sense of the total of two dice. Journal of Research in Mathematics Education, 31, 602-625. Simon, M. A. (1995). Reconstructing mathematics pedagogy from a constructivist perspective. Journal for Research in Mathematics Education, 26, 114-145. Stavy, R. & Tirosh, D. (2000) How Students (Mis-)Understand Science and Mathematics: Intuitive Rules. New York: Teachers College Press. Stake, R. (1995). The Art of Case Study Research. Thousand Oaks: Sage Publications. Steffe, L. P., & Thompson, P. W. (2000). Teaching experiment methodology: Underlying principles and essential elements. In A. E. Kelly & R. A. Lesh (Eds.) Handbook of research design in mathematics and science education (pp. 267-306). Hillsdale, NJ: Erlbaum. Stohl, H. (1999-2002). Probability Explorer. Software application distributed by author at http://www.probexplorer.com Voigt, J. (1996). Negotiation of mathematical meaning in classroom processes: Social interaction and learning mathematics. In L. P. Steffe, P. Nesher, P. Cobb, G. A. Goldin, & B. Greer (Eds.), Theories of mathematical learning (pp. 21-50). Mahwah, NJ: Lawrence Erlbaum Associates. von Glasersfeld, E. (1995). Sensory experience, abstraction, and teaching. In L. P. Steffe & J. Gale (Eds.), Constructivism in education (pp.369-383). Hillsdale, NJ: Lawrence Erlbaum Associates.