Transportation Research Part F xxx (2015) xxx–xxx
Contents lists available at ScienceDirect
Transportation Research Part F journal homepage: www.elsevier.com/locate/trf
Using naturalistic data to assess e-cyclist behavior Marco Dozza ⇑, Giulio Francesco Bianchi Piccinini 1, Julia Werneke Chalmers University of Technology, Department of Applied Mechanics, Division of Vehicle Safety, Accident Prevention Group, Lindholmspiren 3, 41296 Gothenburg, Sweden
a r t i c l e
i n f o
Article history: Received 30 June 2014 Received in revised form 25 February 2015 Accepted 4 April 2015 Available online xxxx Keywords: Cycling safety Naturalistic data Electric bicycle Road user interaction Countermeasures
a b s t r a c t In Europe, the use of electric bicycles is rapidly increasing. This trend raises important safety concerns: Is their use compatible with existing infrastructure and regulations? Do they present novel safety issues? How do they impact other traffic? This study sought to address these concerns, using instrumented electric bicycles to monitor e-cyclists’ behavior in a naturalistic fashion. Data was collected from 12 bicyclists, each of whom rode an instrumented bicycle for two weeks. In total, 1500 km worth of data were collected, including 88 critical events (crashes and near-crashes). Analysis of these critical events identified pedestrians, light vehicles and other bicycles as main threats to a safe ride. Other factors also contributed to crash causation, such as being in proximity to a crossing or encountering a vehicle parked in the bicycle lane. A comparison between electric and traditional bicycles was enabled by the availability of data from a previous study a year earlier, which collected naturalistic cycling data from traditional bicycles using the same instrumentation as in this study. Electric bicycles were found to be ridden faster, on average, than traditional bicycles, in addition to interacting differently with other road users. The results presented in this study also suggest that countermeasures to bicycle crashes should be different for electric and traditional bicycles. Finally, increasing electric bicycle conspicuity appears to be the easiest, most obvious way to increase their safety. Ó 2015 The Authors. Published by Elsevier Ltd. This is an open access article under the CC BY-NC-ND license (http://creativecommons.org/licenses/by-nc-nd/4.0/).
1. Introduction Electric bicycles (also called pedelecs, e-bicycles, or e-bikes) are bicycles with a small electric motor which propels the bicyclist at speeds up to 25 km/h, as long as the bicyclist rotates the pedals. The ride is less effortful than on a traditional bicycle, but the e-bicycle retains the advantages of silent operation and environmentalism (Cherry, Weinert, & Xinmiao, 2009). Electric bicycles have been available on the European market for more than a decade, but only recently has their number become significant: sales in Europe were between 700,000 and 1,200,000 in 2012, twice as many as in 2009 and eight times as many as in 20062. Electric bicycle use is also rapidly growing in China, Australia, and US raising safety issues in those countries (Cherry et al., 2009; Johnson & Rose, 2013; MacArthur, Dill, & Person, 2014). In fact, as electric bicycles become more prevalent, they might change traffic dynamics as the proportion of road users travelling by different modes changes, giving rise to unforeseen traffic situations and road user interactions.
⇑ Corresponding author. Tel.: +46 (0)31 7723621. 1 2
E-mail addresses:
[email protected] (M. Dozza),
[email protected] (G.F. Bianchi Piccinini),
[email protected] (J. Werneke). Tel.: +46 (0)31 7721421, mobile: +46 (0)76 7682442. Source: IV, RAI Vereniging, Velosuisse, CNPC, ANCMA, Arge Zweirad.
http://dx.doi.org/10.1016/j.trf.2015.04.003 1369-8478/Ó 2015 The Authors. Published by Elsevier Ltd. This is an open access article under the CC BY-NC-ND license (http://creativecommons.org/licenses/by-nc-nd/4.0/).
Please cite this article in press as: Dozza, M., et al. Using naturalistic data to assess e-cyclist behavior. Transportation Research Part F (2015), http://dx.doi.org/10.1016/j.trf.2015.04.003
2
M. Dozza et al. / Transportation Research Part F xxx (2015) xxx–xxx
At first sight, most electric bicycles on the European market look the same as traditional bicycles. In fact, their two largest components, the motor and the battery, are included in the bicycle design (McLoughlin et al., 2012). The motor, commonly mounted on the hub of the front or rear wheel, is approximately 15 cm in diameter. It is powered by a battery which may be combined with the rear rack or installed along the frame under the saddle of the bicycle (McLoughlin et al., 2012). The battery (able to store between 10 and 13.5 Ah) weighs around 3 kg and needs to be recharged every 50–70 km, normally requiring approximately 5–7 h for a complete recharge (Ulrich, 2005). In Europe, electric bicycles can be used by anyone who can use a traditional bicycle (including minors), can be ridden anywhere a traditional bicycle is allowed (including dedicated bicycle lanes), and do not require a license or insurance. However, electric bicycles are more complex than traditional bicycles and may exhibit very different dynamics. For instance, electric bicycles can maintain a 25 km/h speed even on a steep uphill when the wind is blowing in the opposite direction, as long as the rider keeps pedaling. However, whether electric bicycles behave differently than traditional bicycles in European traffic is currently unknown. Most of today’s regulations defining who can ride an electric bicycle, and where and how it can be ridden, are not driven by naturalistic data; electric bicycles are assumed to be just as safe as traditional bicycles. Very little is known, especially in Europe, about electric bicyclists’ safety, the way they behave in traffic, how they interact with other road users, and the types of crashes and near-crashes they experience. Studies in China suggest that rider behavior may differ depending on the type of bicycle ridden; for example e-cyclists are more likely than other bicyclists to run red lights at intersections (Pai & Jou, 2014; Wu, Yao, & Zhang, 2012). Comparisons between e-cyclists and traditional cyclists in China show that electric bicycles enable higher mobility (Cherry & Cervero, 2007) at the expense of more risk-taking behavior (Bai, Liu, Chen, Zhang, & Wang, 2013). Zhang, Cui, Gu, Stallones, and Xiang (2013) report that fatalities and injuries from electric bicycle crashes in China increased steadily between 2004 and 2010 (Zhang et al., 2013). However, to date few studies have addressed electric bicycle safety in Europe (but see (Dozza, Mackenzie, & Werneke, 2013; Gehlert et al., 2012), where infrastructure and traffic regulations for bicycles are different than in China. In Sweden, for example, most bicycle lanes are separated from motorized vehicles and shared with pedestrians, thus potentially creating different conflict scenarios compared to other parts of the world and China in particular. The study presented in this paper was performed in Sweden and collected extended naturalistic data from electric bicycles. These data captured real-world bicyclist behavior and several safety–critical events (crashes and near-crashes). The analyses presented in this paper show how naturalistic data can be used to understand e-cyclists behavior and safety. The results were compared to results from naturalistic data from traditional bicycles (Dozza & Werneke, 2014) to help determine how to develop countermeasures to electric bicycle crashes. 2. Material and methods The methods employed in this study were kept as similar as possible to our previous study (Dozza & Werneke, 2014) to facilitate comparisons across the two naturalistic cycling studies. 2.1. Participants In this study, naturalistic cycling data was collected for 14 bicyclists, each one riding an instrumented electric bicycle for two weeks. All 20 bicyclists from our previous study (Dozza & Werneke, 2014) were contacted and asked to participate in this study, in order to facilitate comparison across the two studies and control for sample bias. Overall, only eight of the original bicyclists chose to participate in the second study, and unfortunately two did not complete it. The additional six bicyclists participating in this study responded to ads or e-mails distributed via the SAFER network. Thus 12 bicyclists (six male, six female), age 22–50 years (M = 37.6 years, SD = 10.3 years) completed the study to provide the data analyzed in this paper. Eight out of the 12 bicyclists had no prior experience with electric bicycles, three had ridden one once before (as a test ride) and one bicyclist had an electric bike for private use. All bicyclists signed a standard consent form for naturalistic data collection, detailing the study, the data collected, and the planned analyses. Inclusion criteria favored a balance between female and male bicyclists. Bicyclists committed to not carrying passengers, to prevent data collection from anyone who had not signed a consent form. 2.2. Data collection and procedure Naturalistic cycling data was collected from three instrumented electric bicycles which rotated among the participants between August and November 2013. All bicycles were equipped with battery-powered front and back lights, reflectors, and a bell, according to Swedish law. The electric part of the bicycle included a motor (250 W), a control unit, a pedal rotation sensor, two brake switches, a throttle (only active up to 6 km/h in accordance with European regulations), and a rechargeable battery on the rear rack. As in our previous study (Dozza, Idegren, Andersson, & Fernandez, 2014), each bicycle was specially modified with GPS, (at least) one forward video camera, two inertial measurement units, two brake force sensors (one for each wheel), and a logger which collected all the data. This time, however, the logger was powered by the same battery as the electric motor. In addition, the electric bicycles required the collection of extra data to monitor their operation. Data was also collected from the pedal sensor (which measured the rotation of the pedals around the hub), two brake
Please cite this article in press as: Dozza, M., et al. Using naturalistic data to assess e-cyclist behavior. Transportation Research Part F (2015), http://dx.doi.org/10.1016/j.trf.2015.04.003
M. Dozza et al. / Transportation Research Part F xxx (2015) xxx–xxx
3
switches (part of the bicycle’s electrical system, automatically stopping the electric motor when either brake was applied), and a current sensor (which monitored the instantaneous power that the electric motor was using to propel the bicycle) (Dozza et al., 2013). Data were collected continuously at 100-Hz frequency for all signals, except video (30 frames per second) and GPS (10 Hz). Data collection was automatic, starting about two minutes after the bicyclist began riding and stopping after the bicycle had not moved for two minutes. The algorithms for starting and stopping are described in Dozza and Fernandez (2014). The bicyclists were instructed to signal any critical event they experienced. A critical event was defined in this study as anything that made the bicyclist uncomfortable about her/his own safety while cycling (the same definition as in Dozza & Werneke, 2014). A push-button on the handlebar enabled the bicyclists to timestamp critical events encountered during the ride. All bicyclists compiled a questionnaire before the study to 1) provide demographic data (e.g. age, gender), 2) describe their riding habits (e.g., their cycling pattern during the year, the reason why they ride a bicycle, helmet usage, etc.) as well as 3) give their opinions about the electric bicycle, whether or not they had any previous experience. During the data collection, each bicyclist kept a trip diary reporting the purpose and duration of each ride and noting any safety–critical events that occurred during the trip. After the two weeks, each bicyclist had an interview to discuss the study and review the events noted in the trip diary. Video data (when available) was used during the interview to evaluate each critical event in terms of the potential threat (e.g. light or heavy vehicle, pedestrian, bicycle, animal), the road, weather and light conditions during the event, and whether the bicycle was on the road or the bicycle path. 2.3. Data definition and analysis Our analysis utilized cycling data from baseline events, in which no safety–critical situation occurred, in addition to data from the reported critical events. Baseline and critical events were analyzed separately to assess cyclist behavior in normal and critical situations, respectively, and compared to each other to determine which environmental factors correlated with critical situations. 2.3.1. Critical events Data was processed as in Dozza and Werneke (2014), including the usage of a standard file system structure to enable application of previously developed tools and scripts for data visualization (Dozza, 2013) and analysis (Dozza, Moeschlin, & Léon-Cano, 2010). Critical events in this study were identified from push-button presses and interviews. Kinematic triggers were not applied to the data in this study, as the preceding study (Dozza & Werneke, 2014) demonstrated a very small gain for such a time-consuming procedure. In total, 88 unique critical events were identified from the dataset (Fig. 1). Of these, 18 were identified by button presses, 22 from interviews, and 48 were identified in both interviews and button presses. For each event, a 20-s video clip was reviewed and annotated according to the categories presented in Table 1. To minimize subjective error, two reviewers watched each clip and reached consensus on the categories to be annotated. In addition, the reviewers made use of the participant interviews in order to better understand each event. This procedure was followed to increase the reliability of the annotations. As in Dozza and Werneke (2014), it was up to the bicyclists to identify the critical events. On one hand, this procedure released the annotators from the most debatable and crucial of all annotations (Dozza & Gonzalez, 2013); on the other hand, no objective definition of a safety–critical event was used in this study. It is worth noting that no such definition is available to date for naturalistic driving studies either, so near-crashes are still used as surrogates for crashes (Guo, Klauer, McGill, & Dingus, 2010). Critical events were classified by severity and conflict. Severity categorized how serious the critical events were. When the bicycle and/or the bicyclist had a physical collision it was considered a crash; all other critical events were considered near-crashes, in accordance with common practice in many naturalistic driving studies (Bao, LeBlanc, Sayer, & Flannagan, 2012; Dingus et al., 2006). A conflict was defined as the road user or obstacle responsible for the critical event (e.g., a car crossing the bicycle lane, or a hole causing the bicyclist to lose stability). A conflict acts as a threat to bicycle safety in a specific time and location. In other words, the conflict was the element triggering the critical event. 2.3.2. Baseline events The baseline dataset comprised 176 events extracted from the dataset (Fig. 1). They were selected randomly except for the condition that, for each bicyclist, the number of baseline events was twice the number of critical events. Matching critical and baseline events minimized any bias due to the riding habits and risk perception of each individual. Baseline events were also annotated according to Table 1. Video annotations focused on two aspects: 1) the event scenario, describing environmental factors such as weather conditions, and 2) the potential threats to the bicyclist from other road users and animals crossing the bicyclist’s trajectory (Dozza & Werneke, 2014). By doing these latter annotations we could test the premise that interaction with other road users on a potential collision path, which may be distracting to a bicyclist, increased risk (i.e. were more prevalent in critical than in baseline events). It is worth noting that this analysis is very conservative, because in all critical events the main road user on a collision path is often categorized as a conflict and thus not included as a potential threat, whereas in baseline events all road users on a potential collision path are included as potential threats.
Please cite this article in press as: Dozza, M., et al. Using naturalistic data to assess e-cyclist behavior. Transportation Research Part F (2015), http://dx.doi.org/10.1016/j.trf.2015.04.003
4
M. Dozza et al. / Transportation Research Part F xxx (2015) xxx–xxx
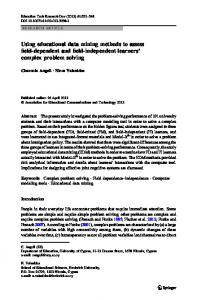
Fig. 1. Geographical location of critical and baseline events in Gothenburg. Map from Google Earth provided by DigitalGlobe and Lantmäteriet/Metra.
Table 1 Video annotations common to critical and baseline events; all variables are binary (true or false).
Scenario (environmental factors related to weather conditions and infrastructure)
Annotation
Criteria for the annotation to be true
Daylight Bicycle lane Asphalt surface Pavement (cobbled or stone) surface Slippery surface Surface issues
The bicyclist was cycling between dawn and dusk The bicyclist was cycling on a bicycle lane The surface was made of asphalt The surface was made of cobblestone or other stones used for paving The surface was wet or icy Holes were present on the surface or large parts of asphalt were missing The bicyclist crossed at least one road for motorized vehicles The intersection had visual occlusions
Intersection Intersection with visual occlusion Construction work Motorized vehicle parked on bicycle lane Threat (one or more road users following a trajectory crossing the bicyclist’s trajectory)
Light vehicle Heavy vehicle Pedestrian Bicycle Animal
Construction work was occurring A motorized vehicle was parked in the bicycle lane At least one light vehicle (weighing less than 3.5 t) had a trajectory crossing the bicycle trajectory At least one heavy vehicle (weighing more than 3.5 t) had a trajectory crossing the bicycle trajectory At least one pedestrian had a trajectory crossing the bicycle trajectory At least one bicycle had a trajectory crossing the bicycle trajectory At least one animal had a trajectory crossing the bicycle trajectory
2.3.3. Statistical analysis Odds ratios (OR) estimated the risk of experiencing a critical event, according to the annotations in Table 1. OR significance was tested by computing the confidence intervals (CI; 95% probability) and assessing the extent to which the value 1 was included or not in the CI. OR were calculated as a ratio of the proportions of each annotation in Table 1 for the 88 critical and 176 baseline events (Agresti, 1999). Since the proportion for critical events is used as the numerator to compute OR, an OR above one can be interpreted as an increase in risk and an OR below one as a decrease (i.e. a protective effect). Attributable risk, used to determine the absolute maximum benefit that a perfect countermeasure could provide, was calculated only when the OR were significant. Together with the OR this indicator can help prioritize goals for countermeasures. In
Please cite this article in press as: Dozza, M., et al. Using naturalistic data to assess e-cyclist behavior. Transportation Research Part F (2015), http://dx.doi.org/10.1016/j.trf.2015.04.003
M. Dozza et al. / Transportation Research Part F xxx (2015) xxx–xxx
5
fact, a specific variable which is rare in critical events and ten times rarer in baseline events would provide a high odds ratio (10) but low attributable risk. As a result, even if the variable increases risk significantly a countermeasure addressing that variable would have a very small margin for improving safety. Finally, correlation analysis was used to assess the extent to which cycling longer or faster caused critical events to happen more or less often. 3. Results A total of 410 trips, covering 1474 km over 86 h, was collected in this study. Average speed was 16.9 km/h (SD = 2.9 km/h), and average trip duration was 14.0 min (SD = 5.0 min) across the 12 bicyclists in the analysis. Fig. 2 shows how the trips were spread geographically in the Gothenburg area. Table 2 describes the collected data for each bicyclist. The distribution of critical events was as follows: four bicyclists experienced two to four critical events, four bicyclists experienced six to nine, and four bicyclists experienced more than nine (Table 2). Of the 88 critical events, four were identified as crashes with degraded stability (i.e. the rider hit some object and lost stability, but was able to recover and did not fall) and the remaining as near-crashes. The most common conflict was with pedestrians (31% of the critical events; Fig. 3), light vehicles (21%), and bicycles (18%). Conflicts with heavy vehicles and animals were rare, 8% and 6%, respectively. In 9% of the critical events the bicyclist did not have a conflict with any road user but with the infrastructure (e.g. a pothole in the bicycle lane). Finally, in 7% of the cases no clear conflict (i.e. a clear threat to the bicyclist at a specific time and place) was identified. In a very common example, bicyclists claimed that darkness triggered the critical event. As darkness on the road was often present for much of the whole trip, conflict was classified as none. Table 3 reports the prevalence of each annotation from Table 1 in the baseline and critical events. As baseline events were random, the first column in Table 3 may be interpreted as the average riding condition (but with some caution, because random events were weighted according to the number of critical events, not riding time or distance). In the baseline condition, the bicyclists usually rode on asphalted, lit bicycle lanes which were slippery about one third of the time and seldom included potential threats from other road users (Table 3, first column). However, when potential threats existed they were mainly pedestrians (14.9%), light vehicles (9.5%), or heavy vehicles (9.5%). In baseline events, bicyclists were in the proximity of at intersection relatively often (26% of the time), but the intersections seldom suffered from visual occlusion (2.3%; Table 3). The risk of experiencing a critical event was twice as high in the proximity of a crossing and this result was statistically significant. When a vehicle was parked in the bicycle lane, the risk was also clearly higher. However, the OR could not be calculated, because although this situation was relatively common in critical events (8.1%), it was extremely rare in baseline.
Fig. 2. Heat map of the GPS data from the entire dataset. Map from Google Earth provided by DigitalGlobe and Lantmäteriet/Metra.
Please cite this article in press as: Dozza, M., et al. Using naturalistic data to assess e-cyclist behavior. Transportation Research Part F (2015), http://dx.doi.org/10.1016/j.trf.2015.04.003
6
M. Dozza et al. / Transportation Research Part F xxx (2015) xxx–xxx
Table 2 Bicyclist characteristics. ID
Number of trips
Average speed (km/h)
Total distance (km)
Number of critical events
1 2 3 4 5 6 7 8 9 10 11 12
14 24 57 42 39 19 25 30 63 31 30 36
16.7 22.8 14.4 14.2 17.3 14.5 14.6 16.0 14.4 21.4 18.8 17.9
76 201 95 95 123 99 67 108 161 190 148 110
4 10 12 2 10 3 6 7 4 9 14 7
Average (standard deviation)
34 (14.5)
17 (2.9)
122 (43)
7.3 (3.8)
Fig. 3. Conflicts experienced in critical events (N = 88). ‘None’ indicates that no conflict was present (e.g., the bicyclist fell because of low friction on an icy road). ‘Other’ indicates conflicts that were not due to road-users, such as infrastructure (e.g., holes in the bicycle lane).
Table 3 Prevalence and statistics for the different annotations in baseline and critical events. Annotation
Prevalence in baseline events (%)
Prevalence in critical events (%)
Odds ratios
Confidence interval
Daylight Bicycle lane Asphalt surface Pavement (cobbled or stone) surface Slippery surface Surface issues Intersection Intersection with visual occlusion Construction work Motorized vehicle parked in bicycle lane
63.6 77.8 97.1 2.86
68.2 78.4 97.1 2.86
1.22 1.03 1.00 1.00
0.71–2.11 0.56–1.92 0.18–5.6 0.18–5.6
38.1 2.03 26.7 2.27 2.7 0.0
29.5 5.41 44.3 6.82 4.05 8.11
0.68 2.76 2.18 3.15 1.52 Na
0.40–1.18 0.60–12.7 1.28–3.74 0.86–11.50 0.33–6.98
9.46 0.68 14.9 9.46 0
17.6 4.05 13.5 6.76 0
2.04 6.21 0.90 0.69 Na
0.9–4.6 0.64–60.8 0.4–2.0 0.24–2.01
Light vehicle Heavy vehicle Pedestrian Bicycle Animal
Attributable risk
0.18
Please cite this article in press as: Dozza, M., et al. Using naturalistic data to assess e-cyclist behavior. Transportation Research Part F (2015), http://dx.doi.org/10.1016/j.trf.2015.04.003
M. Dozza et al. / Transportation Research Part F xxx (2015) xxx–xxx
7
Surface issues and visual occlusion at intersections appeared to increase risk threefold; however, these results were not statistically significant. The presence of light or heavy vehicles on a collision path with the bicyclist also suggested an increase in risk, providing an OR higher than one. However, these results were only close to significance (see confidence intervals in Table 3). None of the other annotated variables appeared to have any influence on the risk of experiencing a safety–critical event. Bicyclists who rode a longer time did not contribute to more critical events (r = 0.16, p = 0.6). However, the number of critical events correlated with trip length (r = 0.41, p = 0.18) and with trip speed (r = 0.52, p = 0.08). 4. Discussion This study collected naturalistic data from instrumented electric bicycles, in order to obtain new knowledge about crash causation and road-user behavior and inform the design of countermeasures to prevent e-bicycle crashes. It is relevant to compare the results of this study to those of Dozza and Werneke’s 2014 study of traditional bicycles, since the two studies are very similar in terms of: (1) bicycle equipment, (2) geographical location (Gothenburg), (3) time of year (August– November), (4) duration of data collection (two weeks per participant) and (5) participants. As a result, differences in road user dynamics (and thus countermeasure design) between traditional and electric bicycles could be made revealed. However, several potential biases limit the ecological validity of this comparison. For instance, collecting data at the same time of year does not ensure that the weather conditions are perfectly the same, although the two testing periods (in 2012 and 2013) did share a smaller-than-average fluctuation in weather conditions, suggesting they may not have been drastically dissimilar. Also, on the first of January 2013 (i.e. between the two data collections) a new tax was introduced in Gothenburg that requires all motorized vehicles (but not bicycles) to pay for circulating in the city during the day. Because of this new tax, the traffic composition may not have been the same for the two studies. 4.1. Naturalistic dataset and data analysis The dataset collected in this study is currently unique, as no other naturalistic cycling study has ever equipped electric bicycles with such a wide range of sensors or collected so much data. It is similar in size to previous naturalistic cycling datasets, although the number of participants was somewhat lower (Dozza & Werneke, 2014; Gustafsson & Archer, 2012; Johnson, Charlton, Oxley, & Newstead, 2010). Compared to Dozza and Werneke (2014), the average speed was higher (17 km/h vs 13 km/h), the total distance ridden slightly lower (1474 km vs 1549 km), and number of critical events larger (88 vs 63) in this dataset. Participants made shorter, more frequent trips, in accordance with previous research suggesting that electric bicycle users travel more (Cherry & Cervero, 2007). These results support previous research showing that cyclists ride e-bikes at faster speeds and that the number of critical events is proportional to the ridden distance (Lin, He, Tan, & He, 2008). This latter relation may explain why the number of critical events per participant correlates more highly with kilometers ridden than with riding time in our study. However, the number of critical events per participant correlates even more highly with speed. This result was very close to significance, suggesting that more kilometers traveled at higher speeds may better explain the larger number of critical events than more kilometers alone. Thus speed shows the highest association with the occurrence of critical events. The number of critical events recorded in this study is larger than in our previous work: one critical event was reported in this study every 16.7 km, whereas in our previous study cyclists rode 24.5 km before experiencing a critical event. In contrast, the number of crashes is lower in this study. (No bicyclist fell and only four events were identified as crashes; in our previous study we had three falls and six crashes.) One possible explanation is that 11 of the 12 cyclists had no significant previous experience with electric bicycles, so they may have been more cautious and more sensitive to safety–critical events. However, the number of participants is too low for us to assume they are representative of the entire bicycling population, and only six participants were the same across the two studies. Future studies should confirm these results with a larger dataset and determine the extent to which experience from riding an electric bicycle influences perceived safety and the likelihood of falling. 4.2. Crash risk and causation In most of the critical events, bicyclists conflicted with vulnerable road users (49%) and motorized vehicles (29%), as in Dozza and Werneke (2014) (45% and 33%, respectively). This result is probably a consequence of the infrastructure in Gothenburg: most of the time, bicyclists conflict with pedestrians on the shared paths, whereas they usually conflict with motorized vehicles at intersections between the path and the road. However, electrical bicycles conflicted more often with motorized vehicles than traditional bicycles did. Video analysis suggests that such conflicts may be the consequence of drivers’ erroneous expectations about the behavior of other road users. Because e-bikes resemble traditional bikes, but are frequently ridden faster, not only do drivers have less time to notice them, they may also underestimate their speed. Both these possibilities may explain the higher number of conflicts with motorized vehicles experienced by e-bikes. This is particularly important because electric bicycles experienced more conflicts with heavy vehicles (buses and construction trucks most of the time) and fewer with light vehicles (cars and vans) than traditional bicycles did, and heavy vehicles are definitely a greater threat for cyclists.
Please cite this article in press as: Dozza, M., et al. Using naturalistic data to assess e-cyclist behavior. Transportation Research Part F (2015), http://dx.doi.org/10.1016/j.trf.2015.04.003
8
M. Dozza et al. / Transportation Research Part F xxx (2015) xxx–xxx
Analysis of OR confirmed previous findings that hazards at intersections create a twofold increase in risk (Bai et al., 2013; Dozza & Werneke, 2014). The corresponding attributable risk confirmed that conflict at intersections is a frequent enough occurrence that targeted countermeasures have significant potential to improve safety. Visual occlusion at intersections also appeared to increase risk, in accordance with previous studies (Dozza & Werneke, 2014; Isaksson-Hellman, 2012). Nevertheless, all OR were lower than in our previous study, suggesting that infrastructure issues and adverse weather conditions influenced electric bicycle safety less than that of traditional bicycles. In this study, a few OR were close to statistical significance, suggesting that a slightly larger dataset would have produced a larger number of statistically significant results. Interestingly, this study points to motorized vehicles as the most common threat for electric bicycles, while our previous study indicated that vulnerable road users were the most common threat for traditional ones. One possible explanation for the difference is that the higher speed of electric bicycles is more likely to create situations in which motorized vehicles are on a collision path even when they are not the conflict. Or perhaps users of electric bikes choose alternative routes, where there are more interactions with motorized vehicles than users of traditional bikes would experience. In fact, riding on asphalt is more prevalent in this study than in Dozza and Werneke (2014). 4.3. Design of countermeasures to prevent bicycle crashes The results presented in this study show that the most effective countermeasures for electric bicycles are not necessarily the same as for traditional bicycles. Many bicyclists from this study lamented the lack of proper street lighting at night (categorized as others in the conflict analysis). Lighting may be more important for e-cyclists because their speed is higher and their bicycles heavier (and possibly less maneuverable), so there is a need to see further ahead to allow time for planning. ’As electric bicycles become more popular, better street lighting may be required, which would benefit all cyclists. Additionally, electric bicycles may require more powerful bicycle lights than those on traditional bicycles (because of their higher speeds). The presence of a vehicle parked in the bicycle lane appears to be a greater threat for electric bicycles than traditional ones. Again, the reason may be the higher speed and lower maneuverability of electric bicycles, which may make any evasive maneuver more challenging. Electric bicycles may require wider bicycle lanes with a higher curve radius to facilitate safe interaction with other vulnerable road users. Furthermore, using bicycle lanes for parking should not be tolerated. When it is necessary, it should be properly signaled to the bicyclists, as this driver behavior impacts not only riding comfort but also riding safety. Expectations are very important for bicyclists because, at least in Sweden, in many crossing situations without traffic lights, yielding depends in part on the agreement between the bicyclists and drivers. Our results show that drivers sometimes have wrong expectations about the electric bicycle dynamics, possibly due to underestimating their speed. Furthermore, in many situations where the main conflict happened with a pedestrian, the pedestrian was not expecting an electric bicycle and started crossing the bicycle lane without checking. Currently, electric bicycles look exactly the same as traditional bicycles. Making electric bicycles more conspicuous and distinctive, so that they are easily distinguished from traditional bicycles, may improve safety by increasing awareness. Regulating their color and/or sound, or simply obliging electric bicycles to keep their lights on all the time, may start addressing this issue. Technology may also help make electric bicycles more conspicuous by means of wireless communication (Safety Pilot Project, 2013). An onboard battery could power equipment for intelligent transportation technologies. Simple beaconing of GPS coordinates and speed could allow applications to exploit bicycle-to-vehicle and bicycle-to-infrastructure bidirectional communication in a cooperative environment (Dozza, Gustafsson, Lindgren, Boda, & Muñez-Cantillo, 2013). For example, when maintenance vehicles are parked in the bicycle lane, a signal could be broadcast and received by the electric bicycle to warn the bicyclist. Another application could enable beaconing from a bicycle to signal its proximity to an intersection, improving already-existing active safety systems for cyclist avoidance (such as the as the Pedestrian and Cyclist Detection system3). Cooperative solutions, such as the ones suggested above, have not yet been tested, and their effectiveness will depend in part on the degree of penetration of the technology. 4.4. Study design and technical challenges Participant recruitment in naturalistic studies is very sensitive to biases (FESTA-consortium, 2007). In this study the recruitment process was purposely biased by asking participants from our previous study (Dozza & Werneke, 2014) to take part. On the one hand, such a procedure favors fair comparisons across the two studies. On the other hand, it is an intrinsic bias, especially a posteriori, as only six bicyclists provided sufficient data to be represented in both studies. Furthermore, our analysis was based on critical events, so the more a participant experienced safety–critical events the more she/he influenced the results. Although this methodology introduced an obvious bias, it also guaranteed that all critical events were considered equally in the analysis. This methodology has also been applied in many preceding studies on naturalistic driving (Dingus et al., 2006; Olson, Hanowski, Hickman, & Bocanegra, 2009). As for instrumentation, electric bicycles presented new challenges compared to traditional bicycles (Dozza et al., 2013), which resulted in several unforeseen technical issues and time-consuming fixes. For example, several signals were acquired
3
http://www.volvocars.com/uk/top/about/news-events/pages/default.aspx?itemid=175.
Please cite this article in press as: Dozza, M., et al. Using naturalistic data to assess e-cyclist behavior. Transportation Research Part F (2015), http://dx.doi.org/10.1016/j.trf.2015.04.003
M. Dozza et al. / Transportation Research Part F xxx (2015) xxx–xxx
9
specifically to monitor the operation of the electric motor, requiring hacking into the electrical bicycle system. These modifications took time and increased the complexity of the overall acquisition system, but they were necessary because technical failures threaten data integrity. Data collection in naturalistic studies is costly and time consuming, so great care must be taken to avoid loss of data. When a bicycle was returned, videos of critical events were watched by the bicyclist and the analysts together (when possible). This methodology, inspired by previous naturalistic driving studies (Sayer et al., 2011), proved to be extremely valuable for gaining useful information and increasing accuracy of the data: the analysts could ask for more details if necessary. Furthermore, errors in reporting critical events could be rectified right away. Nevertheless, reviewing videos with the participants was time-consuming and involved some extra technical challenges, as videos had to be downloaded and visualized in a very short time. 5. Conclusions The increasing prevalence of electric bicycles in Europe and their potential impact on safety introduce important research questions such as ‘‘Do electric bicycle riders behave differently than traditional bicycle riders in traffic?’’, ‘‘Are electric bicycles as safe as traditional bicycles?’’, and ‘‘Do electric bicycles require specific crash countermeasures?’’. This study addressed these questions by collecting—for the first time—extended naturalistic data from instrumented electric bicycles. Although the participants in this study may not be representative of the cycling population, the results clearly show how the naturalistic methodology can be adapted to electric bicycles. It has the potential to decipher safety–critical events and elucidate the relation between a bicyclist’s behavior and a safe ride. The results presented in this paper highlight crossings with other road users as potential hazards for electric bicycles, a finding in accordance with previous studies on traditional bicycles. However, interestingly, electric bicycles seem to have more potentially threatening interactions with motorized vehicles, and fewer with vulnerable road users. In addition, vehicles parked in the bicycle lane also appear to be a greater safety challenge for electric bicycles. The higher speed from the electric bicycle may play a significant role in explaining these results. Furthermore, electric bicycles seem to experience more critical events, but with lower severity. The extent to which this result derives from electric bicycles’ higher speed or from bicyclists’ inexperience needs further investigation. Future studies collecting larger amounts of data from different geographical locations should be performed to verify, complement, and extend these results. For instance, a longitudinal study to capture the dynamics and safety aspects of learning to ride an electric bicycle could provide insights into the design of training tips for novice electric-bicycle riders. The differences in speed and critical events (in type of conflicts, risks associated with different factors, and potential threats) between electric and traditional bicycles suggest that countermeasures to bicycle crashes may not be the same for electric and traditional bicycles. In particular, for electric bicycles it seems even more important to increase conspicuity, possibly to a point where they can be perceived as different from traditional bicycles. Other road users could then easily differentiate between them, and better anticipate electric cyclists’ behavior in traffic. Further, fast evasive maneuvers may be perceived as more dangerous on an electric bicycle, suggesting that wider bicycle lanes with a higher curve radius may be more suitable for electric bicycles. The higher speed of electric bicycles together with the reported threat from darkness suggests that electric bicycles may also benefit from more powerful lighting, able to cast light further away and increase the time available to anticipate and react to upcoming traffic situations. Finally, since electric bicycles already include a battery and electronics, they represent a convenient platform for implementing intelligent transport systems, including wireless communication, to extend the e-horizon for both bicyclists and drivers. Acknowledgements The authors would like to acknowledge Michael Mackenzie and Christian-Nils Boda for their work during data collection and preprocessing and Kristina Mayberry for language editing. The authors are also thankful to Anna Nilson-Ehle and Jonas Bärgman for their support. This paper is the outcome of a project sponsored by Trafikverket and Chalmers Strategic Funds for Transportation. This study was performed at SAFER Vehicle and Traffic Safety Center at Chalmers. References Agresti, A. (1999). On logit confidence intervals for the odds ratio with small samples. Biometrics, 55, 597–602. http://dx.doi.org/10.1111/j.0006341X.1999.00597.x. Bai, L., Liu, P., Chen, Y. G., Zhang, X., & Wang, W. (2013). Comparative analysis of the safety effects of electric bikes at signalized intersections. Transportation Research Part D-Transport and Environment, 20, 48–54. Bao, S., LeBlanc, D. J., Sayer, J. R., & Flannagan, C. (2012). Heavy-truck drivers’ following behavior with intervention of an integrated, in-vehicle crash warning system: A field evaluation. Human Factors, 54, 687–697. Cherry & Cervero, R. (2007). Use characteristics and mode choice behavior of electric bike users in China. Transport Policy, 14, 247–257. Cherry Weinert, J. X., & Xinmiao, Y. (2009). Comparative environmental impacts of electric bikes in China. Transportation Research Part D-Transport and Environment, 14, 281–290. Dingus, T. A., Klauer, S. G., Neale, V. L., Petersen, A., Lee, S. E., Sudweeks, J. (2006). The 100-car naturalistic driving study – Phase II – Results of the 100-car field experiment. Technical Report, DOT HS 810 593. Dozza, M. (2013). What factors influence drivers’ response time for evasive maneuvers in real traffic? Accident Analysis and Prevention, 58, 299–308.
Please cite this article in press as: Dozza, M., et al. Using naturalistic data to assess e-cyclist behavior. Transportation Research Part F (2015), http://dx.doi.org/10.1016/j.trf.2015.04.003
10
M. Dozza et al. / Transportation Research Part F xxx (2015) xxx–xxx
Dozza, M., & Fernandez, A. (2014). Understanding bicycle dynamics and cyclist behavior from naturalistic field data (November 2012). IEEE Transactions on Intelligent Transportation Systems, 15, 376–384. Dozza, M., & Gonzalez, N. P. (2013). Recognising safety critical events: Can automatic video processing improve naturalistic data analyses? Accident Analysis and Prevention, 60, 298–304. Dozza, M., Gustafsson, P., Lindgren, L., Boda, C. N., & Muñoz-Cantillo, J. C. (2013). BikeCOM – A cooperative safety application supporting cyclists and drivers at intersections. In Driver distraction and inattention. Sweden: Göteborg. Dozza, M., Idegren, M., Andersson, T., & Fernandez, A. (2014). Platform enabling intelligent safety applications for vulnerable road users. IET Intelligent Transport Systems, 8, 368–376. Dozza, M., Mackenzie, M., & Werneke, J. (2013). e-BikeSAFE: A naturalistic cycling study to understand how electrical bicycles change cycling behaviour and influence safety. In International cycling safety conference. 20–21 November 2013, Helmond, Netherland. Dozza, M., Moeschlin, F., & Léon-Cano, J. (2010). FOTware: A modular, customizable software for analysis of multiple-source field-operational-test data. In Second international symposium on naturalistic driving research, 2010. Blacksburg. Dozza, M., & Werneke, J. (2014). Introducing naturalistic cycling data: What factors influence bicyclists’ safety in the real world? Transportation Research Part F-Traffic Psychology and Behaviour, 24, 83–91. FESTA-consortium (2007). FESTA handbook. . Accessed June 2014. Gehlert, T., Kuhn, M., Schleinitz, K., Petzoldt, T., Schwanitz, S., & Gerike, R. (2012). The german pedelec naturalistic cycling study – Study design and first experiences. In Proceedings of the first international conference on cycling safety, Helmond, 7–9 November 2012. Guo, F., Klauer, S. G., McGill, M. T., & Dingus, T. A. (2010). Evaluating the relationship between near-crashes and crashes: Can near-crashes serve as a surrogate safety metric for crashes? In Technical Report (Vol. DOT HS 811 382). Gustafsson, L., & Archer, J. (2012). A naturalistic study of commuter cyclists in the greater Stockholm area. Accident Analysis and Prevention, 58, 286–298. Isaksson-Hellman, I. (2012). A study of bicycle and passenger car collisions based on insurance claims data. Annals of Advances in Automotive Medicine, 56, 3–12. Johnson, M., & Rose, G. (2013). Electric bikes–cycling in the new world city: An investigation of australian electric bicycle owners and the decision making process for purchase. In Proceedings of the 2013 Australasian Transport Research Forum, 13. Johnson, M., Charlton, J., Oxley, J., & Newstead, S. (2010). Naturalistic cycling study: Identifying risk factors for on-road commuter cyclists. Annals of Advances in Automotive Medicine, 54, 275–283. Lin, S., He, M., Tan, Y. L., & He, M. W. (2008). Comparison study on operating speeds of electric bicycles and bicycles experience from field investigation in Kunming, China. Transportation Research Record, 2048, 52–59. MacArthur, J. H., Dill, J., & Person, M. (2014). E-Bikes in the North America: Results from an online survey (p. 15). In Transportation Research Board, 93rd Annual Meeting (No. 14-4885). McLoughlin, I. V., Narendra, I. K., Koh, L. H., Nguyen, Q. H., Seshadri, B., Zeng, W., et al (2012). Campus mobility for the future: The electric bicycle. Journal of Transportation Technologies, 2, 1–12. Olson, R. L., Hanowski, R. J., Hickman, J. S., & Bocanegra, J. (2009). Driver distraction in commercial vehicle operations. Technical report, FMCSA-RRR-09-042. Pai, C. W., & Jou, R. C. (2014). Cyclists’ red-light running behaviours: An examination of risk-taking, opportunistic, and law-obeying behaviours. Accident Analysis and Prevention, 62, 191–198. Safety Pilot Project (2013). . Accessed June 2014. Sayer, J., LeBlanc, D., Bogard, S., Funkhouser, D., Bao, S., Buonarosa, M. L., & Blankespoor, A. (2011). Integrated vehicle-based safety systems field operational test. Technical report, DOT HS 811 482. Ulrich, K. T. (2005). Estimating the technology frontier for personal electric vehicles. Transportation Research Part C-Emerging Technologies, 13, 448–462. Wu, C. X., Yao, L., & Zhang, K. (2012). The red-light running behavior of electric bike riders and cyclists at urban intersections in China: An observational study. Accident Analysis and Prevention, 49, 186–192. Zhang, X., Cui, M., Gu, Y., Stallones, L., & Xiang, H. (2013). Trends in electric bike-related injury in China, 2004–2010. Asia-Pacific Journal of Public Health.
Please cite this article in press as: Dozza, M., et al. Using naturalistic data to assess e-cyclist behavior. Transportation Research Part F (2015), http://dx.doi.org/10.1016/j.trf.2015.04.003