Hydrological Sciences-Journal-des Sciences Hydrologiques, 46(3) June 2001
Using neural networks for calibration of timedomain reflectometry measurements MAGNUS PERSSON, RONNY BERNDTSSON Department of Water Resources Engineering, Lund University.PO Box 118, S-221 00 Lund, Sweden e-mail:
[email protected]
BELLIE SIVAKUMAR Department of Land, Air & Water Resources, University of California, Davis, California 95616, USA Abstract Time-domain reflectometry (TDR) is an electromagnetic technique for measurements of water and solute transport in soils. The relationship between the TDR-measured dielectric constant (Ka) and bulk soil electrical conductivity (cra) to water content (8W) and solute concentration is difficult to describe physically due to the complex dielectric response of wet soil. This has led to the development of mostly empirical calibration models. In the present study, artificial neural networks (ANNs) are utilized for calculations of 9„, and soil solution electrical conductivity (aw) from TDR-measured Ka and a„ in sand. The ANN model performance is compared to other existing models. The results show that the ANN performs consistently better than all other models, suggesting the suitability of ANNs for accurate TDR calibrations. Key words neural networks; time-domain reflectometry; soil water content; electrical conductivity
Utilisation de réseaux de neurones pour l'étalonnage de mesures par réflectométrie en domaine temporel Résumé La réflectométrie en domaine temporel (TDR) est une technique électromagnétique de mesure de transferts d'eau et de solutés dans les sols. La relation entre la constante diélectrique (K„) mesurée par TDR et la conductivité électrique volumique du sol (o"0) d'une part, et la teneur en eau (0W) et la concentration en soluté d'autre part est difficile à décrire physiquement en raison de la complexité de la réponse diélectrique d'un sol humide. Cela a conduit au développement de modèles d'étalonnage essentiellement empiriques. Dans cette étude, nous utilisons des réseaux de neurones artificiels (RNA) pour le calcul de 0„, et de la conductivité électrique de la solution du sol (a,,,) à partir de Ka et rj„ mesurés par TDR dans du sable. La performance du modèle à base de RNA est comparée à celle d'autres modèles existants. Les résultats montrent que les RNA donnent des résultats sensiblement meilleurs, suggérant la pertinence des RNA pour l'étalonnage précis de la mesure TDR. Mots clefs réseaux de neurones; réflectométrie en domaine temporel; humidité du sol; conductivité électrique
INTRODUCTION Transport of pollutants in the unsaturated zone is a serious threat to the environment and human health. Accurate solute transport models are keys for successfully assessing the environmental risk of pollutant spreading. Detailed measurements of water content, 0VV, and pollutant concentrations are important when constructing and calibrating such models. A recently developed electromagnetic measuring technique capable of accurate measurements is time-domain reflectometry (TDR). The TDR technique utilizes Open for discussion until 1 December 2001
3g9
390
Magnus Persson et al.
the dielectric constant, Ka, and bulk electrical conductivity, aa, for calculation of Qw and solute concentration (Topp et al, 1980; Dalton et al., 1984). The Ka measurement has been related to Q„ using purely empirical models (Topp et al, 1980; Ledieu et al., 1986), empirical-conceptual models (Birchak et al., 191'4), and physical-conceptual models (de Loor, 1964). Several studies have shown that the Ka-Qw relationship is dependent also on soil type (e.g. Roth et al., 1990), percentage of organic matter and bulk density (e.g. Jacobsen & Schj0nning, 1993; Hook & Livingston, 1996), electrical conductivity (e.g. Dalton, 1992; Sun et al., 2000; Persson et al., 2000), and temperature (e.g. Pepin et al, 1995; Persson & Berndtsson, 1998). In many cases, the actual physical process that induces the effects on the Ka-Qw relationship is not fully understood, although studies have shown that the effects are small in most cases (e.g. Topp et al, 1980). The relationship between the aa measurement and the soil solution electrical conductivity, aw, which, in turn, can be related to the concentration of an ionic solvent, is more difficult to describe since it is highly dependent also on Qw and soil texture. As for the Ka-Qw relationship, several types of models have been proposed for the relationship between aa, aw and 0W, e.g. purely empirical models (Persson, 1997), empirical-conceptual models (Mualem & Friedman, 1991), and physical-conceptual models (Rhoades et al., 1976; Rhoades et al, 1989). However, it is important to note that all these models have serious drawbacks in that, for example, they need to be calibrated for each soil type and are only applicable for a specific range in Qw and aw. Thus, as of now, there is no unifying theory for the relationship between aa, aw and 0W, making novel approaches appealing. Given that the underlying dynamics or the "exact" equations involved in the dielectric response of unsaturated soil are not well known, one possible way to understand the process seems to be through an approach that is capable of representing arbitrarily the (complex nonlinear) process that relates the inputs and outputs of the system. In this regard, Artificial Neural Networks (ANNs), developed based on the network of the human brain, may be a potential alternative. The advantage of the ANN is that with no a priori knowledge of the actual physical process and, hence, the "exact" relationship between sets of input and output data, the network can be "trained" to "learn" such a relationship and, therefore, seems to be particularly suitable for physically complicated processes. Since the beginning of the 1990s, ANNs have been successfully applied to hydrology-related problems, such as rainfall forecasting (e.g. French et al., 1992), rainfall-runoff modelling (e.g. Hsu et al, 1995; Minns & Hall, 1996), streamflow modelling (e.g. Karunanithi et al, 1994), river level forecasting (See & Openshaw, 1999), and water quality modelling (e.g. Maier & Dandy, 1996). With respect to soil-related problems, ANNs have been used for prediction of water retention characteristics from other, more easily measured, soil variables like particle size distributions and bulk density (Pachepsky et al, 1996; Schaap & Bouten, 1996; Koekkoek & Booltink, 1999). The results obtained are very encouraging. With the promising results thus obtained using ANNs for hydrology and soil related problems, an attempt is made in the present study to examine the possibility of using ANNs for calibration of TDR measurements in pure sand. Two different data sets are used. In the first set, the measured Ka is used for calculation of Qw. The second data set uses two inputs, aa and Qw, for the calculation of aw. The performance of the
Using neural networks for calibration of time-domain reflectometry measurements
391
ANNs is compared with several existing models for the relationships between Ka and 9,„ and between aa, ow and Qw, both empirical and physically based. THEORY TDR measurement Time-domain reflectometry (TDR) is an electromagnetic technique which sends a high frequency electromagnetic signal through a probe buried in the soil. From the reflected signal, the propagation velocity can be calculated. The dielectric constant of a material is related to this propagation velocity. In 1980, Topp and co-workers introduced TDR for the measurement of soil moisture (Topp et al, 1980). They based their method on the work of Fellner-Feldegg (1969), who used TDR for measuring the dielectric constant of liquids. Dalton et al. (1984) were the first to show how the attenuation of the TDR trace can be used to calculate aa. Following the thin-sample approach by Giese & Tiemann (1975), aa can be described by: oa-KpfrIZL
(1)
where ZL is the steady-state impedance (in Q,), fy is a temperature correction coefficient, and Kp is the cell constant of the TDR probe (Giese & Tiemann, 1975; Topp et al., 1988; Nadler et al, 1991). The term Kp is a calibration constant that can be determined by immersing the probe in solutions with known conductivity. Models for the Ka-Qw relationship Topp et al. (1980) introduced the apparent dielectric constant Ka, which they related to 9„, using an empirical third-order polynomial equation. Ledieu et al. (1986) proposed a linear relationship between 9W and the square root of Ka. In addition to these empirical relationships, several dielectric mixing models have also been used to estimate the dielectric properties of wet soils. These models calculate the bulk Ka for the soil from the Ka and the volume fractions of soil components, e.g. water, air and soil particles. Birchak et al. (1974) suggested a semi-empirical a model:
where 9, and Kt are the volume fraction and the dielectric constant of component /, respectively, and a is an empirical parameter accounting for the geometry of the electrical flow paths. For a three-phase system including air, water and soil particles, it has been shown that the average value of a is about 0.5 with a range from 0.46 to 0.67 (see, e.g. Roth et al, 1990; Jacobsen & Schj0nning, 1995). Furthermore, a = 0.5 results in a linear relationship between Kaos and soil water content. The validity of this has been shown by several researchers (e.g. Ledieu et al., 1986; Hook & Livingston, 1996). In the theoretical de Loor model (de Loor, 1964), soil water is assumed to consist of disk-shaped foreign inclusions embedded in a homogeneous isotropic dielectric medium (the mineral phase). The Ka value can then be calculated according to:
392
Magnus Persson et al.
Ka_
_
_
3+e, Es K„
__
_
(3)
K„
where the subscripts w, "air" and s represent the water, air and particle phases, respectively. The de Loor model contains no calibration parameter and has been successfully applied to determine the Ka value of soils in several studies (e.g. Dobson et al, 1985; Jacobsen & Schj0nning, 1995). Models for the ofl vs aw-Qw relationship The electrical conductivity, oa, of the soil depends mainly on three variables: (a) the effective volumetric water content, 8eff (= 9 - 90, where 9o is a correction factor accounting for water close to the solid particles which can be considered immobile), (b) the electrical conductivity of the soil solution, and (c) a geometry factor, which accounts for the complex geometry of the soil matrix (Mualem & Friedman, 1991). The aa value is also affected by the surface conductivity of the soil matrix, os. For unsaturated soils, Rhoades et al. (1976) described the aa as: Oa = owQwT(Qw) + cs
(4)
where T(QW) is the transmission coefficient. Rhoades et al. (1976) proposed a linear relationship between T(QW) and 9W, i.e. T(QW) = cQw + d, where c and d are soil-specific parameters. Rhoades et al. (1989) concluded that equation (4) was valid for values of o a above approximately 1 dSmf1. Risler et al. (1996) found that a constant transmission coefficient in equation (4) was adequate to model the aa vs o"w-9w relationship using their data at low aa values (2-4 dS m"1). Mualem & Friedman (1991) had a slightly different approach using the tortuosity factor Fê(Qw) instead of the transmission coefficient to account for the complex geometry of the soil matrix. They proposed that Fg should be equal to the ratio of the hydraulic conductivity of the soil to that of a bundle of straight capillaries. Furthermore, Mualem & Friedman (1991) showed that if a simple power expression is used to describe the water retention function, equation (4) can be written as (neglecting as): a a = avv9vv*/8sat (5) where 9sat is the water content at saturation and b is a calibration coefficient. A value of 2.5 was found to fit most soils. Heimovaara et al. (1995) used a similar approach, but, instead of the power function suggested by Mualem & Friedman (1991), they used a general equation by van Genuchten (1980) to model the water retention curve, leading to: „ _„ û P + .[l-(l-©'"")"? î-fi-e1")'7
(6)
where p is a calibration coefficient, 9 is the relative saturation [(9W - 8o)/(9sat - 0o)], m and q are empirical parameters obtained by fitting water retention data to two forms of the empirical water retention function, one with m = 1 - lin and the other with q = 1 - 21 p (van Genuchten, 1980; Heimovaara et al., 1995). A comparison of the per-
Using neural networks for calibration of time-domain reflectometry measurements
393
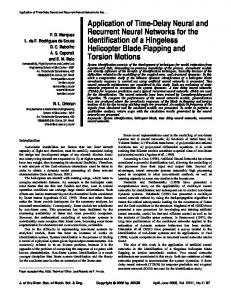
formance of some of the models presented can be found in Persson (1997) and Wraith & Das (1998). Neural networks An ANN is a massively parallel-distributed information processing system that has certain performance characteristics resembling the biological neural networks of the human brain (Haykin, 1994). The particular advantage of the ANN is that, even if the "exact" relationship between sets of input and output data is unknown, but is acknowledged to exist, the network can be "trained" to "learn" that relationship, requiring no a priori knowledge of the actual physical processes. Figure 1 shows a schematic diagram of a three-layer feed forward back-propagation ANN, consisting of input, hidden and output layers. The number of nodes, or neurons, in the input and output layers corresponds to the number of input and output variables, respectively. The number of nodes in the hidden layer can be chosen arbitrarily, and the optimum number of nodes has to be found by trial and error. All input nodes J containing input data X are connected via certain weights Wjk to all hidden nodes K. At each node the input from all connections are summarized and the sum is used in a nonlinear transformation function to produce an output. This procedure is repeated for the output nodes L, weights Wui are multiplied with the hidden nodes output, and a nonlinear transformation function is used to produce output data Y. Different types of transfer functions can be used, but in most applications a sigmoid function is used as is done in the present study. Initially, the weights are chosen randomly. For subsequent iterations the values of the weights are optimized in an iterative calibration procedure, called training, using the back-propagation algorithm (Rumelhart et ai, 1986). After the training procedure, the ANN model is used for producing output for an independent data set input using the weights obtained during training. The performance of the ANN is determined using the root mean square error, RMSE, and the coefficient of determination, r2. Data flow
Connection
Node
Input layer
Hidden layer
Output layer
Fig. 1 Schematic design of a (2-4-2) feed forward artificial neural network.
394
Magnus Persson et al.
MATERIALS AND METHODS TDR measurements All TDR measurements were made using a Tektronix 1502C metallic TDR cable tester (Beaverton, Oregon, USA). Three-rod probes were used, which were 0.2 m long and had a wire spacing of 0.05 m (Soilmoisture Equipment Corp., Santa Barbara, California, USA). The data sets for calculations of Qw and aw were obtained during a detailed calibration in a cylinder with homogeneous sand with a particle diameter of 0.3-0.5 mm. Water content and aw ranged from 0.05 to 0.35 m3 m"3 and 0.43 to 4.82 dS m"1, respectively. In total, 378 measurements were made for the Ka-Qw calibration and 287 for the aa vs aw-Qw calibration. Further details can be found in Persson (1997). The data for the Ka-Qw and oa vs aw-Qw relationships were used in equations (2), (4), (5) and (6) to get the best-fit parameters. Based on measured values in the sand, some parameters were fixed (see Table 1). More information can be found in Persson (1997). In both data sets, about 10% of the measurements were selected for validation. The validation data for the Ka-Qw relationship were selected in the following way. First, the data set was sorted by the input data column, then every tenth value was selected for the validation series. For the relationship between oa, aw and 0W, the data were first sorted by Qw and every fifth value was selected as validation data. Then, the data were sorted by aa and the procedure was repeated. This ensured that the data were selected randomly and that both the calibration and validation data sets covered the entire range of the data sets. Neural networks In the present study, a three-layer feed forward back-propagation ANN was used. The simulations were made using the Winnn32 (version 1.2) program. Before simulation, all data sets were standardized. Several ANNs were constructed with different numbers of nodes in the hidden layer (k). For the Ka~Qw relationship a 1-fc-l ANN was used with Ka and 0„, as input and output respectively. The relationship between aa, aw and Qw had Qa and QK as input and aw as output, thus a 2-&-1 ANN was used. The number of nodes in the hidden layer was varied between 2 and 10 in order to find the optimum number. Consequently, 18 ANNs were constructed and tested. First, 100 000 iterations were made for each value of k. The model that gave the lowest root mean square error (RMSE) value was then chosen and tested against the validation data set. The number of iterations used was selected arbitrarily. More iterations will generally lead to a lower RMSE value for the calibration data, but it will also increase the risk of overTable 1 Measured values of some parameters used in equations (2), (4), (5) and (6). Parameter 6v 6sill
Ks m ci
Value 0.62 0.38 4.27 0.81 0.69
Using neural networks for calibration of time-domain reflectometry measurements
395
training. An overtrained ANN "learns" the noise as well as the signal, leading to a low RMSE value for the calibration data, but a significantly higher RMSE value for the validation data.
RESULTS AND DISCUSSION The RMSE values for the different number of nodes in the hidden layer for the three different models are presented in Table 2. Note that the RMSE values in this table are calculated from the standardized data series. The k values chosen for the final models are indicated by bold text in the table. In general, the value of RMSE is decreasing with increasing k, but at high values of k, the RMSE value increased slightly again. One might expect that adding more nodes in the hidden layer would always give a lower RMSE value, but several studies have shown that adding more nodes after reaching the optimum k gives an increasing value of RMSE (e.g. Ranjithan et al., 1993). Others have found, however, that adding more nodes to the hidden layer does not necessarily give a higher value of RMSE (e.g. Morshed & Kaluarachchi, 1998). This was also indicated in the present study. When k was set to 30, the RMSE value was not significantly different from using k = 10 (data not shown). However, a high number of hidden nodes also requires much more computational time. The RMSE value decreased rapidly for the first iterations, after which it decreased slowly. During the entire simulation, the RMSE values for the calibration and validation data sets were similar, indicating that the model was not overtrained. In the following comparison between ANN and other models, the RMSE and r2 values are calculated for the entire data series, including both calibration and validation data.
Table 2 The performance of the ANN models using different numbers of nodes in the hidden layer, k. The optimum value of k is indicated in bold. Note that the RMSE values are calculated using standardized data. K„-Q„ relationship l-/t-l ANN: k 2 3 4 5 6 7 8 9 10
RMSE 0.0258 0.0228 0.0204 0.0204 0.0203 0.0184 0.0175 0.0204 0.0210
aa-ow-Qw relationship 2-k-l ANN: k 2 3 4 5 6 7 8 9 10
RMSE 0.0405 0.0265 0.0175 0.0229 0.0138 0.0144 0.0150 0.0121 0.0130
Calculations of Qw and aw in sand The values of r2 and RMSE of 0W calculated using equations (2) and (3), a third-order polynomial equation using both best-fit parameters and the parameters suggested by Topp et al. (1980), and the best-fit linear relationship between 0 and Ka°'s, are presented in Table 3. The result from the 1-8-1 ANN is also included in the table. The
Magnus Persson et al.
396
Table 3 Comparison of different models for 0„, calculations. Model Toppef al. (1980)* Three-order polynomial' Linear* Birchack era/. (1974) deLoor(1964) 1-8-1 ANN
Best-fit parameters
RMSE (m 3 m"3)
r2
N/A Pi = -0.092, p2 = 0.036, pi = -0.0012, p 4 = 2.47E-5 e = - 0 . 2 1 0 , / = 0.119 a = 0.62 N/A N/A
0.0237 0.0078
0.9930 0.9941
0.0081 0.0248 0.0147 0.0064
0.9935 0.9940 0.9934 0.9960
3,„ = -0.053 + 0.0292£„-0,00055Ka2 + 4.3E-6if„3. )», =Pl+ PlKa + P^a + P*Ka-
)w = e+fKa°-s. Table 4 Comparison of different models for oH, calculations. Model
Best-fit parameters
RMSE (dS in 1 )
r2
Mualem & Friedman (1991) Heimovaara et al. (1995) Rhoadesefa/. (1976)* Persson (1997) ' 2-9-1 ANN
b = 2.25 (3 = 1.22 c = 2.15, d = -0.06
0.1965 0.1900 0.2074 0.0927 0.0441
0.9768 0.9767 0.9727 0.9899 0.9989
N/A
* Neglecting as. G„ = o\„(0.10-2.45ew + 22.348M2-70.290B,3 + 86.810w4).
i
model by Topp et al. (1980) consistently overestimated 8W by around 0.02 m m" while the Qw prediction using equations (2) and (3) underestimated Qw. This underestimation increased as 9W increased. For the other models, there was no trend in the residuals (data not shown). The sand studied has a very well defined relationship between Ka and 8W. Consequently, all models gave low RMSE and high r2 values. It is interesting to note that (a) the dielectric mixing model presented by de Loor (1964) gave good results even if the model did not contain any calibration parameter; and (b) the ANN gave better results than the polynomial regression. Since the ANN is capable of capturing non-linearities in the data, it is believed that the improvement in using ANN instead of traditional calibration equations can be more significant for soils with high clay or organic matter content. These soil types typically exhibit more complicated Ka-Qyv relationships (e.g. Hook & Livingston, 1996). The results for the ow prediction using equations (4), (5) and (6) together with the 2-9-1 ANN are presented in Table 4. Again, the ANN had the lowest RMSE and highest r2 values compared to the other models, including the empirical four-order polynomial regression. For all models except the ANN model, the error in the aw estimation increased with aw (data not shown). The improvement in using the ANN for the aw calculation is much larger compared to that for the calculation of Qw. In fact, the ANN model showed both larger r2 and lower RMSE values using standardized values (Table 2) for the aw measurement compared to the 9W measurement. This result is a bit surprising since the aw measurement is normally considered more uncertain than the Qw measurement, due to the much more complicated aa vs ow-Qw relationship. The results presented here suggest that the uncertainty of the ow estimation is mainly due to the fact that the models are not sophisticated enough, not due to the scatter of the data.
Using neural networks for calibration of time-domain reflectometry measurements
397
CONCLUSIONS Artificial neural networks have found many applications recently and seem to be a very good alternative to ordinary regression analysis. An ANN model was used for calibration of a relationship between TDR-measured Ka and oa compared to 9W and aw in sand. The performance of the ANNs was compared with several models (empirical, conceptual and physically-based) available in the literature. In total 18 ANN models were constructed and tested. One model was finally selected for each problem and was tested against an independent data set. In all cases, the ANN performed better than any other model, which was reflected in the low RMSE and high r2 values. The present study shows that ANNs can be used successfully for calibration of any measurement, especially where the (nonlinear) relationship between the measured values and the parameter of interest is difficult to describe physically. It should be noted that constructing and calibration of an ANN model takes longer than applying a conventional model.. Future research will focus on the possibility of including physical parameters, e.g. texture and bulk density, for predicting aw and 9VV from TDR measurements. If successful, such an approach would lead to a universal calibration covering many soil types, which would limit the need for soil specific calibration.
Acknowledgements This study was funded by the Swedish Research Council for Engineering Sciences and the Swedish Natural Science Research Council. Experimental equipment was purchased through grants from the Crafoord and Lundberg Foundations. Their support is gratefully acknowledged. Bellie Sivakumar wishes to thank the Nils Hôrjel foundation for granting a scholarship for his stay at the Department of Water Resources Engineering, Lund University.
REFERENCES Birchak, J. R., Gardner, C. G., Hipp, J. E. & Victor, J. M. (1974) High dielectric constant microwave probes for sensing soil moisture. Proc. IEEE 62, 93-98. Dalton, F. N. (1992) Development of time-domain reflectometry for measuring soil water content and bulk soil electrical conductivity. In: Advances in Measurement of Soil Physical Properties: Bringing Theory into Practice (ed. by G. C. Topp & W. D. Reynolds), 143-167. SSSÀ Special Publ. no. 30, Soil Sci. Soc. Am., Inc., Madison, Wisconsin, USA. Dalton, F. N., Herkelrath, W. N., Rawlins, D. S. & Rhoades, J. D. (1984) Time-domain reflectometry: simultaneous measurements of soil water content and electrical conductivity with a single probe. Science 224, 989-990. de Loor, G. P. (1964) Dielectric properties of heterogeneous mixtures. Appl. Sci. Res. B3, 479^182. Dobson, M. C., Ulaby, F. T., Hallikainen, M. T. & El-Rayes, M. A. (1985) Microwave dielectric behaviour of wet soil. Part II: Dielectric mixing models. IEEE Trans. Geosci. Remote Sens. GE-23, 35^K>. Fellner-Feldegg, J. (1969) The measurement of dielectrics in the time domain. 7. Phys. Chem. 73, 616-623. French, M. N., Krajewski, W. F. & Cuykendal, R. R. (1992) Rainfall forecasting in space and time using a neural network. /. Hydrol. 137, 1-37. Giese, K. & Tiemann, R. (1975) Determination of the complex permittivity from thin-sample time domain reflectometry, improved analysis of the step response waveform. Adv. Mol. Relax. Processes 7, 45-49. Haykin, S. (1994) Neural NETWORKS: A Comprehensive Foundation. Macmillan, New York, USA. Heimovaara, T. J., Focke, A. G., Bouten, W. & Verstraten, J. M. (1995) Assessing temporal variations in soil water composition with time domain reflectometry. Soil Sci. Soc. Am. J. 59, 689-698. Hook, W. R. & Livingston, N. J. (1996) Errors in converting time domain reflectometry measurements of propagation velocity to estimates of soil water content. Soil Sci. Soc. Am. J. 60, 35-41. Hsu, K., Gupta, H. V. & Sorooshian, S. (1995) Artificial neural network modeling of the rainfall-runoff process. Wat. Resour. Res. 31, 2517-2530.
398
Magnus
Persson
et al.
Jacobsen, 0 . H. & Schj0nning, P. (1993) A laboratory calibration of time domain reflectometry for soil water measurement including effects of bulk density and texture. /. Hydrol. 151, 147-157. Jacobsen, O. H. & Schj0nmng, P. (1995) Comparison of TDK calibration functions for soil water determination. In: TimeDomain Reflectometry Applications in Soil Science (ed. by L. W. Petersen & 0 . H. Jacobsen) (Proc. Symp., Research Centre Foulum, Denmark, 16 September 1994). SP report no. 11(3), 25-33. Danish Institute of Plant and Soil Set, Lyngby, Denmark. Karunanithi, N., Grenney, W. J., Whitley, D. & Bovee, K. (1994) Neural networks for river flow prediction. J. Comp. Civil EngngASCE 8, 201-220. Koekkoek, E. J. W. & Booltink, H. (1999) Neural network models to predict soil water retention. Eur. J. Soil Sci. SO 489^195. Ledieu, J., de Ridder, P., de Clerck, P. & Dautrebande, S. (1986) A method of measuring soil moisture by time-domain reflectometry. J. Hydrol. 88, 319-328. Maier, H. R. & Dandy, G. C. (1996) The use of artificial neural networks for the prediction of water quality parameters. Wat. Resour. Res. 32, 1013-1022. Minns, A. W. & Hall, M. J. (1996) Artificial neural networks as rainfall-runoff models. Hydrol. Sci. J. 41(3), 399-416. Morshed, J, & Kaluarachchi, J. (1998) Application of artificial neural network and genetic algorithm in flow and transport simulations. Adv. Water Resour. 22, 145-158. Mualem, Y. & Friedman, S. P. (1991) Theoretical prediction of electrical conductivity in saturated and unsaturated soil. Wat. Resour. Res. 27, 2771-2777. Nadler, A., Dasberg, S. & Lapid, I. (1991) Time domain reflectometry measurements of water content and electrical conductivity of layered soil columns. Soil Sci. Soc. Am. J. 55, 938-943. Pachepsky, Y. A., Timlin, D. & Varallyay, G. (1996) Artificial neural networks to estimate soil water retention from easily measurable data. Soil Sci. Soc. Am. J. 60, 727-733. Pepin, S., Livingston, N. J. & Hook, W. R. (1995) Temperature-dependent errors in time domain reflectometry determinations of soil water. Soil Sci. Soc. Am. J. 59, 38^13. Persson, M. (1997) Soil solution electrical conductivity measurements under transient conditions using time domain reflectometry. Soil Sci. Soc. Am. J. 61, 997-1003. Persson, M. & Berndtsson, R. (1998) Texture and electrical conductivity effects on temperature dependency in time domain reflectometry. Soil Sci. Soc. Am. J. 62, 887-893. Persson, M., Berndtsson, R., Nasri, S., Albergel, J., Zante, P. & Yumegaki, Y. (2000) Solute transport and water content measurements in clay soils using time domain reflectometry. Hydrol. Sci. J. 45(6), 833-848. Ranjithan, S. J., Eheart, J. W. & Garrett, J. H., Jr (1993) Neural network based screening for groundwater reclamation under uncertainty. Wat. Resour. Res. 29, 563-574. Rhoades, J, D., Manteghi, N. A., Shouse, P. J. & Alves, W. J. (1989) Soil electrical conductivity and soil salinity: new formulations and calibration. Soil Sci. Soc. Am. J. 52, 433^139. Rhoades, J. D., Ratts, P. A. & Prather, R. J. (1976) Effects of liquid-phase electrical conductivity, water content, and surface conductivity on bulk soil electrical conductivity. Soil Sci. Soc. Am. J. 40, 651-655. Risler, P. D., Wraith, J. M. & Gaber, H. M. (1996) Solute transport under transient flow conditions estimated using time domain reflectometry. So/7 Sci. Soc. Am. J. 60, 1297-1305. Roth, K., Schulin, R., Fluhler, H., & Attinger, W. (1990) Calibration of time domain reflectometry for water content measurement using a composite dielectric approach. Wat. Resour. Res. 26, 2267-2273. Rumelhart, D. E., Hinton, G. E. & Williams, R. J. (1986) Learning internal representations by error propagation. In: Parallel Distributed Processing, vol. 1, 318-362. MIT Press, Cambridge, Massachusetts, USA. Schaap, M. G. & Bouten, W. (1996) Modelling water retention curves of sandy soils using neural networks. Wat. Resour. Res. 32, 3033-3040. See, L. & Openshaw, S. (1999) Applying soft computing approaches to river level forecasting. Hydrol. Sci. J. 44(5), 763-778. Sun, Z. J., Young, G. D., McFarlane, R. A. & Chambers, B. M. (2000) The effect of soil electrical conductivity on moisture determination using time-domain reflectometry in sandy soil. Can. J. Soil Sci. 80, 13-22. Topp, G. C , Davis, J. L. & Annan, A. P. (1980) Electromagnetic determination of soil water content: Measurements in coaxial transmission lines. Wat. Resour. Res. 16, 574-582. Topp, G. C , Yanuka, M., Zebchuk, W. D. & Zegelin, S. (1988) Determination of electrical conductivity using time domain reflectometry: soil and water experiments in coaxial lines. Wat. Resour. Res. 24, 945-952. Van Genuchten, M. T. (1980) A closed-form equation for predicting the hydraulic conductivity of unsaturated soils. So/7 Sci. Soc. Am. J. 44, 892-898. Wraith, J. M. & Das, B. S. (1998) Monitoring soil water and ionic solute distributions using time domain reflectometry. So/7 22 & Till. 47,accepted 145-150.21 February 2001 Received JuneRes. 2000;