Using Neurological Evidence to Differentiate between Informational and Social Herding among Strategic Mortgage Defaulters Authors
M i c h a el J . S e il e r a nd E ric Wa ld e n
Abstract
Great debate is being waged between whether strategic mortgage defaulters follow a herd for social reasons or mimic others’ behavior for informational gain. Using functional magnetic resonance imaging (fMRI), the latest neurological technology allowing for observation of brain activity during strategic mortgage default decision-making, we find that when defaulters learn of peer default behavior, they acknowledge the social component of the decision, but feel freer to make their own decisions. Alternatively, when observing the behavior of a maven (real estate expert), borrowers still consider the social aspect of the decision (although to a lesser extent), but ultimately follow the maven who presumably possesses a greater information set. Alarmingly, borrowers only significantly follow the herd when mavens advocate strategic default, not when they recommend against it.
Even from birth, people learn in a variety of ways relying on a number of edification techniques both conscious and subconscious. One of the earliest forms of learning that never leaves us is through mimetics, the learning of behavior through the observation of how others behave (Rogers, 1962; Marsden, 1998). Bearden, Netemeyer, and Teel (1989) explain that there are several reasons why people rationally mimic the behavior of those around them. The first is for informational gain purposes. For example, if someone shows you a wheel and you become convinced a wheel is the optimal design, it makes no sense to ‘‘reinvent the wheel.’’ One simply adopts the wheel and moves forward. The second reason to rationally mimic the behavior of others is because as social beings, humans desire to ‘‘fit in.’’ Yawning is a well-known example of a pure mimicking behavior that holds no informational content whatsoever. When a person is seen yawning, it invariably causes on-lookers to yawn as well. To be clear, this study is not one examining rationality versus irrationality. Our purpose is to explain rational behavior by segmenting actions into being either
J R E R
u
Vo l .
3 8
u
N o .
3 – 2 0 1 6
4 5 4
u
S e i l e r
a n d
Wa l d e n
socially based or informationally based. Since utility maximization includes both social and informational gain considerations, both contribute positively to overall utility. Keynes (1965) famously argues that the utility of being the only one who is right is less in magnitude than the disutility of being the only one who is wrong. This asymmetry reflects our social need to belong and should not be underestimated when modeling decision-making behavior.1 Strategic mortgage default, the failure to make mortgage payments even when the borrower has the financial means, is a burgeoning source of contentious debate among policymakers and academics alike. White (2010) and Wheaton, Nechayev, and Seiler (2015) argue that strategic mortgage defaults are a necessary market disciplining action taken by borrowers to encourage sound lending practices. Opposing positions are taken by Wyman (2010) and Guiso, Sapienza, and Zingales (2013), who purport that strategic mortgage defaults contribute to foreclosure contagion and spillover effects, and as such, is contributing to an unnecessarily protracted U.S. economic recovery. Independent of the political stance taken on this hotly debated topic, what is interesting is whether strategic mortgage defaulters mimic the behavior of others for informational gain purposes or for social utility reasons. Why this distinction is so important is because depending on the reason, differential policies need be written to combat the action. As explained in Bikhchandani, Hirshleifer, and Welch (1992, 1998), informational herding is harder to reverse than social herding. Moreover, the two are changed differently. Thus, the initial step in changing a behavior is to first understand the motivations behind the behavior. We investigate the neurobiological correlates linking a borrower’s decision to mimic the behavior of others when making the complex decision to strategically default. We find that when the participant observes the default behavior of his peers, his brain responds as if he recognizes the social dimension of the decision, but feels freer to reach his own conclusion. Alternatively, when the borrower observes the behavior of a maven (i.e., a real estate expert), his brain responds as if he is inclined to follow, engaging in informational herding. This conclusion is confirmed in the behavioral data analysis of the study with the narrower finding that borrowers specifically herd when the maven advocates strategic default, but not when they recommend against it. This presents an additional challenge from a policymaker standpoint.
u
Literature Review
Social herding, or conformity, was first studied over a series of related experiments in the 1950s (Asch, 1951, 1952, 1955, 1956). The assignment was simple; the subject was tasked with observing a line on an initial card, and then asked to identify on a second card which of three lines was the same length as the line on the first card. The task was so easy to complete that a success rate of over 99% was observed when no influencer was present to dissuade the subject. However,
U s i n g
N e u r o l o g i c a l
E v i d e n c e
t o
D i f f e r e n t i a t e
u
4 5 5
when others in the room (called ‘‘confederates,’’ who were actors in on the purpose of the experiment) intentionally chose the wrong line on the second card and claimed it was of the exact same length as the line on the first card, the subject’s success rate dropped by roughly 33%. Based on exit interviews, this staggering increase in the failure rate to simply pair lines of the same length was attributed primarily to a ‘‘distortion of judgment,’’ meaning that the subjects’ lack of confidence led them to believe they must be wrong because everyone else in the room unanimously identified a different line than the one they believed to be of the same length as the line on the first card. A secondary explanation, pertaining to a smaller sub-group of participants, was that subjects suffered from a ‘‘distortion of action,’’ meaning that they knew the correct answer, but incorrectly agreed with the group because they did not want break from the social norm. Countless variants of this core design followed in the years to come, but the Asch paradigm still serves as the seminal work on which most conformity, or social herding, experiments are based even today. Bikhchandani, Hirshleifer, and Welch (1998) historically report several examples of social herding behavior dating back to Roman times when wealthy families would hire mourners to bellow sad cries at a funeral to create a sense of great loss to the community over one’s death. In modern times, nightclubs maintain a line at the door to give the illusion that the club is more difficult to get into than another. Similarly, restaurants close off back sections of the venue to give the appearance of a more populated, and thus more popular, eatery. Comedians invite their friends to laugh early and often to encourage the crowd to follow suit. Standing ovations for performers are started by just a few early adopters whose behaviors are quickly mimicked. In sum, there are countless examples of pure social herding. More recently, a large scale and excellent example of social herding is discussed in Hayward (2014), who reports on the psychological experiment conducted on an unknowing 700,000 Facebook users. Researchers inside Facebook sought to understand the influence of postings on the mood of their readers. Thus, when new posts arrived, Facebook researchers adjusted each post to make half of them positive and the other half negative. As hypothesized, those who saw nothing but negative posts began to write negative posts themselves, which fed into a continuation or self-perpetuating negative mood that spread like wildfire through various interconnected networks. The same was true for the positively altered postings, but the effects were not nearly as strong. Thus, it is easier to pull people down than to lift them up.2 The closest study to ours is by Seiler, Lane, and Harrison (2014), who examine the role of mavens versus peers to investigate the difference between information cascades and financial herding by falsely reporting strategic default intentions of each group in a controlled experimental setting. The authors find that homeowners herd more for informational gains reasons rather than simply following the herd and that signal strength is not significant. They further find that homeowners are J R E R
u
Vo l .
3 8
u
N o .
3 – 2 0 1 6
4 5 6
u
S e i l e r
a n d
Wa l d e n
more apt to follow mavens than homeowners, but do not perform any investigation of these finding using neurological techniques. As such, the findings are limited by what people indicate they would do in certain situations, but what actually goes into their thought process remains unobservable.
u
Sample and Methodological Design
We begin this section by explaining why we use an experimental design instead of following a transactions-based approach. The primary reason is because no database collects the variables we seek to study. As such, if we do not collect primary data, a study such as ours is simply not possible. More generally speaking, it is certainly true that in an experiment, people might behave differently than they would in a non-experimental setting. The advantage of experiments is that it allows the researcher to control conditions in order to examine more closely individual causal elements. In this particular study, the issue is between social and informational herding. The cost for precision in conditions is an abstract from the marketplace. However, observing behavior under actual conditions means we cannot control for many exogenous factors. Hence, there is always a tradeoff between observations made in the marketplace and the precision of hypothesis testing. The answer is to have researchers examine the problem using a variety of methods. Some should use transactions data where every observation has a unique set of causal variables to tease out the consistent variables, while other researchers should use experiments to precisely disentangle the effects of specific variables of interest. Both approached are equally valid, both make concessions, and both need to be used before a community can feel confident in the causal models it develops. Preuschoff, Quartz, and Bossaerts (2008) and Bruguier, Quartz, and Bossaerts (2010) represent the seminal functional magnetic resonance imaging (fMRI) studies published in top finance journals. The authors used 19 and 20 Cal Tech students as their sample participants, respectively.3 Consistent with the fMRI finance literature, we collect decision-making behavior from 20 participants as well. However, instead of using a student sample, we invited only current homeowners with an existing mortgage to participate in our study. While past studies use students as experimental subjects, we posit the strategic mortgage default decision is far more complex than simply choosing one stock investment over another. Thus, we depart from the mainstream finance literature in that we collect data from actual decision-makers in the marketplace and argue this makes for a far more meaningful analysis in this context. Each homeowner participant was paid a flat fee of $25 for roughly 45,55 minutes of their time.4 We found subjects by placing a general advertisement in the local newspaper, and then screened them over the phone as current mortgage borrowers. When the subject arrived at the site, he was only then provided with the knowledge
U s i n g
N e u r o l o g i c a l
E v i d e n c e
t o
D i f f e r e n t i a t e
u
4 5 7
that our experiment related to strategic mortgage defaults (which was necessarily evident at the outset of our experiment). Still to prevent sample selection bias, we had previously only broadly referred to our study as an examination of the housing market.5 When subjects arrived at the scanning facility, they were first asked to sign consent forms. One of our team explained that the purpose of the study was to understand how people would make strategic mortgage default decisions. Next, the concept of strategic default was explained to them. They were then given a chance to practice the task with sample scenarios (as described below). When they indicated that they understood the task and felt comfortable answering the questions, they were introduced to the scanner technician. The technician asked them to remove all metal objects and then asked a series of questions about metal in their bodies, such as pacemakers or back stimulators. Subjects then walked through a metal detector and were put in the scanner. A screen was viewed through a 45-degree mirror placed above their eyes. Participants were lying in a tube looking up at what appeared to be a skylight through the top of the machine with a computer screen on it. Subjects simply lay still for one minute while a localizer scan was performed to gather the outline of their head so the fMRI machine could be aimed. Next, a five-minute high-resolution structural scan (the kind of MRI one would get in a hospital) was performed while the subjects lay still. Afterwards, the functional scan was taken while subjects performed the experiment. The participant was provided with 36 mortgage characteristic scenarios including the equity position in the home, original purchase price, down payment made, current market price, and current outstanding loan balance. He was then asked to indicate on a scale from 1 to 9 his likelihood of strategically defaulting on the loan, where 1 5 highly likely, to 9 5 highly unlikely. Panel A of Exhibit 1 presents the 36 scenarios sorted from lowest to highest equity position. Panel B conveys a screen shot similar to what the participant saw during the experiment. In addition to the loan characteristics, subjects were sometimes given information about what either mavens (newspaper real estate columnists) suggested in the same situation (e.g., Sam Miller: USA Today 5 9), or the most common answer other subjects (i.e., peers) had given on prior trials (e.g., 74% of others asked this question answered ‘‘1’’). There were 12 trials of each condition/ treatment (no influencer, maven opinion, peer opinion) for a total of 36 trials. In half of each opinion condition, the opinion was high on the scale (either 8 or 9) and in half of the conditions it was low on the scale (either 1 or 2). To clarify, we falsely reported these scores to enable very specific hypothesis testing. The positions needed to be either strongly in favor of or strongly against strategic mortgage default. Each of the three treatment types was offered in trios. This first trio always consisted of the ‘‘no influencer’’ trials to achieve an individual-specific baseline of strategic default proclivity. From there, we semi-randomly presented trios so as not to bias results through the introduction of presentation order effects.
J R E R
u
Vo l .
3 8
u
N o .
3 – 2 0 1 6
u
4 5 8
S e i l e r
a n d
Wa l d e n
E x h i b i t 1 u Mortgage Characteristic Scenarios
Scenario
Equity Position
Purchase Price
Down Payment
Current Price
Loan Balance
Panel A: Sorted negative equity scenarios 1
2$200,000
$305,000
$10,000
$85,000
$285,000
2
2$200,000
$310,000
$20,000
$80,000
$280,000
3
2$200,000
$365,000
$75,000
$80,000
$280,000
4
2$185,000
$280,000
$15,000
$70,000
$255,000
5
2$170,000
$255,000
$15,000
$60,000
$230,000
6
2$170,000
$290,000
$50,000
$60,000
$230,000
7
2$165,000
$295,000
$25,000
$95,000
$260,000
8
2$150,000
$235,000
$10,000
$65,000
$215,000
9
2$145,000
$265,000
$35,000
$75,000
$220,000
10
2$135,000
$205,000
$10,000
$50,000
$185,000
11
2$135,000
$230,000
$30,000
$55,000
$190,000
12
2$130,000
$280,000
$70,000
$70,000
$200,000
13
2$125,000
$295,000
$65,000
$95,000
$220,000
14
2$115,000
$305,000
$95,000
$85,000
$200,000
15
2$100,000
$180,000
$15,000
$55,000
$155,000
16
2$100,000
$235,000
$60,000
$65,000
$165,000
17
2$100,000
$245,000
$65,000
$70,000
$170,000
18
2$100,000
$265,000
$80,000
$75,000
$175,000
19
2$30,000
$70,000
$5,000
$30,000
$60,000
20
2$30,000
$100,000
$10,000
$55,000
$85,000
21
2$30,000
$105,000
$15,000
$55,000
$85,000
22
2$30,000
$125,000
$35,000
$55,000
$85,000
23
2$25,000
$70,000
$10,000
$30,000
$55,000
24
2$25,000
$90,000
$30,000
$30,000
$55,000
25
2$25,000
$120,000
$20,000
$70,000
$95,000
26
2$20,000
$80,000
$5,000
$50,000
$70,000
27
2$20,000
$95,000
$10,000
$60,000
$80,000
28
2$20,000
$110,000
$25,000
$60,000
$80,000
29
2$15,000
$65,000
$10,000
$35,000
$50,000
30
2$15,000
$85,000
$30,000
$35,000
$50,000
31
2$15,000
$100,000
$25,000
$55,000
$70,000
32
2$15,000
$120,000
$30,000
$70,000
$85,000
33
2$10,000
$60,000
$5,000
$40,000
$50,000
34
2$10,000
$70,000
$25,000
$30,000
$40,000
35
2$10,000
$80,000
$15,000
$50,000
$60,000
36
2$10,000
$80,000
$25,000
$40,000
$50,000
U s i n g
N e u r o l o g i c a l
E v i d e n c e
t o
D i f f e r e n t i a t e
u
4 5 9
E x h i b i t 1 u (continued) Mortgage Characteristic Scenarios
Panel B: Example participant screen
Notes: This exhibit reports the 36 mortgage characteristic scenarios shown to participants. Here they are sorted from low equity position to high, but in the experiment, the scenarios were semirandomly revealed to avoid presentation order effects and allow for the testing of herding hypotheses. Panel A reports mortgage characteristics including the equity position in the home, original purchase price, down payment made, current market price, and current outstanding loan balance. Panel B conveys a screen shot similar to what the participant saw during the experiment.
u
Hypothesized Relations Behavioral Hypotheses
From a purely behavioral perspective, we hypothesize that homeowners will be influenced by the actions suggested by both their peers and a real estate expert (i.e., a maven). If the peers have a greater influence, then we will conclude that J R E R
u
Vo l .
3 8
u
N o .
3 – 2 0 1 6
4 6 0
u
S e i l e r
a n d
Wa l d e n
homeowners engaged in social herding, whereas if they more so follow the mavens, they would do so for informational gain purposes. Neurological Hypotheses
Because there has never been an fMRI study conducted before comparing social versus informational herding, our hypotheses are based on past fMRI studies that have identified parts of the brain where blood flows in order to bring oxygen needed to stimulate thoughts in the following regions. When comparing influencer groups (peers and mavens) versus non-influencer groups, Green et al. (2009) find that activity in the visual cortex is known to be required when subjects focus on the social aspect of a decision. Activation is additionally likely to occur on the right side of the precunceus cortex, as Cavanna and Trimble (2006) find this area of the brain to be active in subjects who imagine themselves in the situation described. When comparing the relative effects of mavens versus peer influencer groups, Chaminade and Decety (2002) find activation in the left inferior parietal lobe when subjects reproduce others’ actions than when they make decisions on their own. Activation in this area would suggest subjects follow the actions of mavens, presumably because mavens have more informed opinions.
u
Experimental Results
Simple univariate statistics in Panel A of Exhibit 2 reveal a striking result. Trials 1 through 3 are associated with no influencer, and as such, measure a baseline for the participant’s willingness to strategically default. Starting in Trial 4, the participant is shown a series of maven/peer influences on both the very high and low end of the likelihood of strategic default spectrum. Given that some mavens/peers report a great willingness to default while an equal number of others are unwilling to default, there is no reason to expect the participants’ scores to have migrated far away from their baseline estimates (in Trials 1 through 3). However, this is exactly what happens. In the first three trials, participants’ average willingness to default is 6.39. But after going through the experiment, they become more willing to default, reflected by an average score of just 5.65. This increased willingness to strategically default is seen at almost every position along the ninepoint scale. To formally quantify a measure of total herding, we simply take the difference between the average willingness to strategically default during the last three trials where no influencer was present and then subtract the average from Trials 1–3, the baseline willingness to strategically default. Comparing ‘‘no influencer’’ trials late in the experiment to the ‘‘no influencer’’ baseline measure is the best way to avoid the confounding potential influence of peers and mavens.6 Formally, the total herding measure can be expressed as:
U s i n g
N e u r o l o g i c a l
E v i d e n c e
t o
D i f f e r e n t i a t e
u
4 6 1
E x h i b i t 2 u Stated Willingness to Strategically Default and Total Herding Scores
Trials 1–3
Trials 4–36
Panel A: Strategic default willingness across trials Stated willingness to strategically default
6.39
5.65
1: Extremely likely to strategically default
6.8%
12.9%
2
1.7%
6.0%
3
8.5%
8.7%
4
6.8%
8.1%
5
8.5%
7.8%
6
10.2%
7.4%
7
13.6%
13.9%
8
18.6%
16.2%
9: Extremely unlikely to strategically default
25.4%
19.0%
N
TH Score
Total herding measure
20
20.600
Subjected herding towards strategic default
14
21.667
6
1.889
Panel B: Total herding scores by direction
Subjected herding away from strategic default
Panel C: Total herding scores by immediately preceding influencer group (1) Maven–High Score (MH)
6
0.778
(2) Maven–Low Score (ML)
5
21.467
(3) Peer–High Score (PH)
5
20.067
(4) Peer–Low Score (PL)
4
22.220
(1) MH & (3) PH
11
0.394**
(2) ML & (4) PL
9
21.815**
Notes: Panel A reports participant stated willingness to default segmented in the first column by trials 1–3 to capture their uninfluenced baseline likelihood level, and in column 2 by the remainder of the trials to measure the impact of various influencer groups. Panel B reports the measure of total herding as represented in equation (1). TH 5 Nt,t12 2 T1,3 , where TH is the total herding measure, T1,3 is the average unbiased baseline willingness to default indication of the participant, and Nt,t12 is the average willingness to default indication of the participant during the last ‘‘no influencer’’ trials. A paired-samples t-test was conducted to test for statistical significance. Panel C indicates which influencer group trio of trials immediately preceded them. An independent samples t-test is used to identify statistical significance. * Significant at the 90% level. ** Significant at the 95% level. *** Significant at the 99% level.
J R E R
u
Vo l .
3 8
u
N o .
3 – 2 0 1 6
4 6 2
u
S e i l e r
a n d
Wa l d e n
TH 5 Nt,t12 2 T1,3 ,
(1)
where: TH 5 Total herding measure; T1,3 5 The average unbiased baseline willingness to default indication of the participant; and Nt,t12 5 The average willingness to default indication of the participant during the last ‘‘no influencer’’ trials. As reported in Panel B of Exhibit 2, total herding gravitation towards a greater willingness to strategically default after completing the experiment is experienced by 70% (14 out the 20) of the participants. The 14 who herded towards strategic default averaged 1.667 points lower on the nine-point scale per trial, while the 30% (6 out of 20) of participants who herded away from strategic default averaged 1.889 points higher on the nine-point scale. The weighted average overall sample willingness to strategically default (i.e., total herding) was 20.600 points on the nine-point scale (p 5 0.230; N 5 20). Panel C of Exhibit 2 reports results based on which influencer group [maven high (a maven who reports a lesser willingness to default); maven low (a maven who reports a greater willingness to default); peer high (a peer who reports a lesser willingness to default); and peer low (a peer who reports a greater willingness to default)] immediately preceded to last trio of ‘‘no influencer’’ trials. When taken independently as four groups, no statistical significance is found. However, when pairing maven high with peer high, and comparing that to maven low with peer low, significance is found at the 95% level. Instead of examining the results of the entire experiment at once, we next create a measure of early herding, defined as the difference between the baseline willingness to default (Trials 1–3 where no influencer is present) versus the average willingness to default in Trials 4–6, where precisely one of four different outside influencers is present [maven high (a maven who reports a lesser willingness to default in the exact scenario); maven low (a maven who reports a greater willingness to default); peer high (a peer who reports a lesser willingness to default in the exact scenario); and peer low (a peer who reports a greater willingness to default)]. Due to the nature of the experiment, it is not possible to measure whether all participants are herding early or not. For example, assume that during the first three no influencer trials, the participant indicates an average score of ‘‘8.’’ Then, in Trials 4–6, the participant sees a maven (or peer) whose (falsely created) scores across the three trials are ‘‘8, 9, and 9.’’ The participant indicates a willingness to default in Trials 4–6 as ‘‘8, 8, and 9,’’ respectively. Is this person following the herd or simply answering in a way that is consistent with his baseline responses in Trials 1–3? Since there is no way to know, this participant is not included in
U s i n g
N e u r o l o g i c a l
E v i d e n c e
t o
D i f f e r e n t i a t e
u
4 6 3
the early herding analysis. This same reasoning would disallow our ability to test for early herding in a participant who indicated low scores in Trials 1–3, and then saw (falsely reported) low maven/peer scores in Trials 4–6. As a result of the natural inability to construct a measure for all 20 participants, only 13 individual homeowners remain in this sub-sample analysis. To quantify a measure of early herding behavior, we specify the following equation:
EH 5 (T4,6 2 T1,3 )/(I4,6 2 T1,3 ),
(2)
where: EH 5 Early herding measure; T4,6 5 The average (potentially) influenced willingness to default indication of the participant; T1,3 5 The average unbiased baseline willingness to default indication of the participant; and I4,6 5 The average falsely reported maven (or peer) willingness to default indication. Recall, that we falsely report peer and maven scores as being either extremely in favor of or against strategic mortgage default in order to allow for specific hypothesis testing. Panel A of Exhibit 3 reports our measure of early herding segmented by the four outside influencers. The two most influential groups are mavens and peers, who encourage a greater level of strategic mortgage default, as evidenced by higher (absolute) values in Panel A.7 Interestingly, when those same mavens try to influence the participant away from defaulting, they are completely unsuccessful. Panel B of Exhibit 3 reports the same measures, except this time, those who went away from the herd are given a winsorized score of 0. The tendency to follow the maven and peer influencer only when that influencer encourages default remains.
u
Neurological (fMRI) Results
The experimental results show exactly what happens when borrowers observe the strategic default decisions of others, but do not tell us why borrowers make the choices they do. To understand the motivation behind the actions, we now turn to a neurological examination of strategic mortgage default decision-making. Because borrowers cannot control how their brain processes information, fMRI technology allows us to see ‘‘behind the curtain’’ and truly observe the underlying thought processes that motivate people to behave the way they do. A full description of the statistical analysis of brain images can be found in a variety of other places (Dimoka, 2012). However, it is worthwhile to briefly highlight what the images mean. For each brain, we have approximately 50,000 J R E R
u
Vo l .
3 8
u
N o .
3 – 2 0 1 6
4 6 4
u
S e i l e r
a n d
Wa l d e n
E x h i b i t 3 u Early Herding Measures by Influencer Category
Early Herding Measure
Significant Combinations
Panel A: Early herding measures where negative values are included (1) Maven–High Score (MH) (2) Maven–Low Score (ML) (3) Peer–High Score (PH)
20.033 0.260
(1&2); (2&3); (3&4)
20.095
(4) Peer–Low Score (PL)
0.287
(1–4) Weighted average early herding measure
0.147
Panel B: Early herding measures where negative values are winsorized (capped) at zero (1) Maven–High Score (MH)
0.125
(2) Maven–Low Score (ML)
0.371
(1&2); (2&3)
(3) Peer–High Score (PH)
0.000
(1&3); (3&4)
(4) Peer–Low Score (PL)
0.318
(1–4) Weighted average early herding measure
0.259
Notes: This exhibit reports quantified measures of early herding by each of the four influencer groups: mavens who report high scores (MH), mavens who report low scores (ML), peers who report high scores (PH), and peers who report low scores (ML). The early herding measures are based on equation (2) and are specified as follows: EH 5 (T4,6 2 T1,3 ) / (I4,6 2 T1,3 ), where EH is the early herding measure, T4,6 is the average (potentially) influenced willingness to default indication of the participant, T1,3 is the average unbiased baseline willingness to default indication of the participant, and I4,6 is the average falsely reported maven (or peer) willingness to default indication. Recall, that we falsely report peer and maven scores as being either extremely in favor of or against strategic mortgage default in order to allow for specific hypothesis testing. Significance is based on ANOVA and subsequent post-hoc tests consistent with the outcome of a Levene test of homogeneity of variance. Overall ANOVA test of mean differences when taken as a group is significant at the 95% level. Statistically significance pairs are at least at the 10% level.
to 100,000 voxels (pixels with volume, roughly 3 mm cubes) where we measure the blood flow once every two seconds. For each of these voxels, we have a time series, and we create dummy variables for the time periods during which subjects were looking at different types of questions. We then construct an autoregressive process for each time series to calculate beta values for the dummy variables during each time period. Then, we compare the level of these beta values across the different conditions to look for significant differences. This gives us a brain image where each voxel contains a t-statistic, scaled to a z-statistic (i.e., a normal distribution). We then threshold this image at 2.3, and jettison all voxels that do not have a z-score of at least 2.3, which is equivalent to a 1% one-tailed p-value. However, because there are 50,000 to 100,000 tests, we have many false positives.
U s i n g
N e u r o l o g i c a l
E v i d e n c e
t o
D i f f e r e n t i a t e
u
4 6 5
Thus, we use random field theory to determine the probability of having a cluster of N contiguous voxels. We remove all of the clusters that have more than a 5% probability of occurring by chance. Therefore, what we show below are images where the color represents a z-test of the hypothesis that one of the betas is greater than the other against the null hypothesis that they are equal. N o I n f l u e n c e r v e r s u s I n f l u e n c e r Tr i a l s
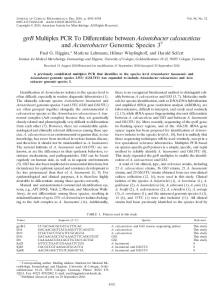
The first contrast examined is trials where participants receive advice from a maven versus when they receive no influencer advice at all. Panel A of Exhibit 4 reveals that mavens produce one cluster of greater activity that spreads across the occipital pole, lateral occipital complex, and occipital fusiform gyrus bilaterally.8 These are areas in the visual cortex known to be selectively activated in the focus of social attention (Greene et al., 2009). That is, while these areas activate for any visual stimuli, they activate more when the stimuli is related to another human being. The second contrast is where peer behaviors engender greater activation relative to no influencer data. In Panel B of Exhibit 4, we observe two areas of activation. The first area is again the occipital pole, lateral occipital complex, and occipital fusiform gyrus bilaterally. This makes sense given that peers are also a social entity similar to the maven discussion. The second area of activation is in the precuneus cortex, predominantly on the right side. Activations in this area have been associated with a variety of tasks, but in particular with first person mental representations (Cavanna and Trimble, 2006). Taken together, these two areas of activation indicate that knowing peer behavior makes one focus on the social dimensions of strategic default and imagine one’s self strategically defaulting. In this sense, there is a greater social component to the peer group than there is for mavens.9 We next turn to an analysis of the relative effects of herding from mavens versus peers. Exhibit 5 reports one significant cluster of higher activation in the left inferior parietal lobe when subjects receive information about the recommendations of mavens compared to when they receive information about peer choices. Chaminade and Decety (2002) find that this area of the brain shows stronger activation when subjects reproduce another’s actions than when subjects produce their own actions. The reverse contrast where peer information produced greater activation resulted in two clusters in the right hemisphere. The first is in the right inferior parietal lobe, which has been found to be active in a subject when others were following him (Chaminade and Decety, 2002). The other area is in the right visual cortex in the fusiform gyrus. This area has also been shown to correlate with social attention (Greene at al., 2009), suggesting there are two different ways the advice of others affects people’s strategic default decisions. If the influencer is a peer, social awareness in the brain is significantly stimulated, whereas if the influencer J R E R
u
Vo l .
3 8
u
N o .
3 – 2 0 1 6
4 6 6
u
S e i l e r
a n d
Wa l d e n
E x h i b i t 4 u fMRI Results for No Influencer Versus Influencer Groups Panel A: Areas of Greater Activation for Maven over No Influencer Trials
Maven . no Influence
Voxels
P-value of Cluster
Z-MAX
Z-MAX X (mm)
Z-MAX Y (mm)
Z-MAX Z (mm)
5,129
3.08e-15
5.11
16
294
4
Panel B: Areas of Greater Activation for Peer over No Influencer Trials
Voxels
P-value of Cluster
Z-MAX
Z-MAX X (mm)
Z-MAX Y (mm)
Z-MAX Z (mm)
Peer . No Influence
3,214
6.75e-1
4.78
10
296
6
Peer . No Influence
2,972
2.48e-09
4.23
0
272
52
Notes: This exhibit shows fMRI brain scan images for significant substrate brain activation when comparing the no influencer trials to maven and peer trials. Z-score by color is as follows: 2.0 5.0.
U s i n g
N e u r o l o g i c a l
E v i d e n c e
t o
D i f f e r e n t i a t e
u
4 6 7
E x h i b i t 5 u fMRI Results for Maven Versus Peer Influencer Groups Panel A: Areas of Greater Activation for Maven over Peer Trials
Panel B: Areas of Greater Activation for Peer over Maven Trials
J R E R
u
Vo l .
3 8
u
N o .
3 – 2 0 1 6
4 6 8
u
S e i l e r
a n d
Wa l d e n
E x h i b i t 5 u (continued) fMRI Results for Maven Versus Peer Influencer Groups
Voxels
P-value of Cluster
Z-MAX
Z-MAX X (mm)
Z-MAX Y (mm)
Z-MAX Z (mm)
Maven . Peer
942
0.001
3.76
238
274
Peer . Maven
959
0.0008
3.75
52
248
46
Peer . Maven
866
0.0018
3.53
32
256
216
34
Notes: This exhibit shows fMRI brain scan images for significant substrate brain activation when comparing the maven and peer influencer trials.
is a maven, the strategic mortgage default choice is constrained to a greater degree. Alternatively stated, a homeowner is more likely to follow the maven, elucidating the distinction between social herding and informational herding.
u
Conclusion
In this study, we examine the distinction between social and informational herding in the context of the decision to strategically default on one’s mortgage to better understand this critical decision on both an experimental and neurological level. On an experimental level, we find that while our maven and peer influencers varied from advocating strategic default to opposing it, subjects on average left the experiment indicating a greater willingness to walk away from their mortgage. Alternatively measured, 70% indicated a greater willingness to strategically default after the experiment when compared to their belief prior to engaging in the trials. This describes what borrowers do when presented with the decisions being made around them, but does not provide the motivations for why they make certain choices. For that, we turn to a neurological examination. On a neurological level, our fMRI results offer several insights into the strategic mortgage default decision-making process. First, maven suggestions and peer suggestions are not processed equally in the brain. Peers stimulate more social awareness, but the borrower still feels freer to reach his own final decision. When observing mavens, on the other hand, subjects feel more like followers who put far less thought into the decision to follow the herd. This is consistent with the results from Banerjee (1992) and Bikhchandani, Hirshleifer, and Welch (1992), who find that it is perfectly rational to abandon one’s private information in favor of a person/group one believes possesses superior information (particularly when the decision is complex, like strategic mortgage default). Moreover, we find that borrowers are more likely to follow the herd when the maven advocates strategic default, but not when the maven recommends keeping the call option (i.e.,
U s i n g
N e u r o l o g i c a l
E v i d e n c e
t o
D i f f e r e n t i a t e
u
4 6 9
mortgage) alive. This presents a challenge for policymakers who seek to stem the tide of strategic mortgage default. In sum, this is the first study to differentiate between the social and informational aspects of strategic mortgage default using neurological technology. Past studies that only used experimental data were unable to directly examine brain activity and learn that both social and informational learning are considered in the minds of strategic defaulters. Finally, these disparate patterns are not symmetrical in terms of either maven versus peers or advocating versus opposing strategic mortgage default.
u
Endnotes 1
2
3
4
5 6
7
8
Utility is far more inclusive than simple wealth maximization. Wealth maximization is a convenient proxy for overall utility and may even be correlated, but is by no means one and the same. We recognize that those who belong to a social network may be more prone to social herding. Still, the general notion of these findings are consistent with the extant literature in that people are social creatures who care about (and are affected by) the social components of human interactions. The sample size is effectively in the hundreds of millions. Imagine we had a time series on 50,000 house prices for 964 months in 20 different cities. That would be a huge sample size. That is analogous to what we have here: a time series on 50,000 voxel activations for 964 periods in 20 different brains. This is why neurological studies typically have few subjects, because they have a huge time series on each person. In the neurological literature, N 5 12 is ostensibly the magic number. ‘‘12 subjects were required to achieve 80% power at the single voxel level for typical activations’’ (Desmond and Glover, 2002). ‘‘[A]t least 12 subjects are required to detect the effect of stimulation on the fMRI signal change in M1 using a ROI-based analysis’’ (Zandbelt et al., 2008). ‘‘[F]or a threshold of p , .05 with .80 power for a Level 2 analysis, N 5 12 was needed for the 1st level analysis’’ (Dimoka, 2012). Consistent with the literature, we paid a flat fee because answers to strategic mortgage default decisions are neither correct nor incorrect. The alternative practice of paying participants a variable rate applies to studies that have right versus wrong answers or that result in an accumulation of wealth, for example. We also took participants on a first come, first serve basis. To clarify, if we compared willingness to strategically default scores from the first three trials to the last three trials, we might confound the results since the last three trials might well be associated with the presence of one of the four influencer groups: maven high, maven low, peer high, or peer low. To avoid this potential bias in our measure, we instead average the cluster of the last three trials in the experiment where no influencer is present. A positive early herding score reflects movement towards the influencer scores; a negative number reflects movement away. Differentially significant brain activation areas are shown in red when significant at the Z 5 1.96 level and yellow when Z exceeds 5. J R E R
u
Vo l .
3 8
u
N o .
3 – 2 0 1 6
4 7 0
9
u
u
S e i l e r
a n d
Wa l d e n
There were no areas where ‘‘no influencer’’ trials produced greater activation than either peer or maven trials.
References Asch, S.E. Effects of Group Pressure Upon the Modification and Distortion of Judgment. In Groups, Leadership and Men, H. Guetzkow (ed.). Pittsburgh, PA: Carnegie Press, 1951. ——. Group Forces in the Modification and Distortion of Judgments. Social Psychology. Englewood Cliffs, NJ: Prentice Hall, 1952. ——. Opinions and Social Pressure. Scientific American, 1955, 193, 35. ——. Studies of Independence and Conformity: A Minority of One Against a Unanimous Majority. Psychological Monographs: General and Applied, 1956, 70:9, 1–70. Banerjee, A. A Simple Model of Herd Behavior. Quarterly Journal of Economics, 1992, 107:3, 797–817. Bearden, W., R. Netemeyer, and J. Teel. Measurement of Consumer Susceptibility to Interpersonal Influence. Journal of Consumer Research, 1989, 15:4, 473–81. Bikhchandani, S., D. Hirshleifer, and I. Welch. A Theory of Fads, Fashion, Custom, and Cultural Change as Informational Cascades. Journal of Political Economy, 1992, 100:5, 992–1026. ——. Learning From the Behavior of Others: Conformity, Fads, and Informational Cascades. Journal of Economic Perspectives, 1998, 12:3, 151–70. Bruguier, A., S. Quartz, and P. Bossaerts. Exploring the Nature of Trader Intuition. Journal of Finance, 2010, 65:5, 1703–23. Cavanna, A. and M. Trimble. The Precuneus: A Review of its Functional Anatomy and Behavioral Correlates. Brain, 2006, 129:3, 564–83. Chaminade, T. and J. Decety. Leader or Follower? Involvement of the Inferior Parietal Lobule in Agency. NeuroReport, 2002, 13:15, 1975–78. Desmond, J. and G. Glover. Estimating Sample Size in Functional MRI (fMRI) Neuroimaging Studies: Statistical Power Analyses. Journal of Neuroscience Methods, 2002, 118:2, 115–28. Dimoka, A. How to Conduct a Functional Magnetic Resonance (fMRI) Study in Social Science Research. MIS quarterly, 2012, 36:3, 811–40. Greene, D., E. Mooshagian, J. Kaplan, E. Zaidel, and M. Iacoboni. The Neural Correlates of Social Attention: Automatic Orienting to Social and Nonsocial Cues. Psychological Research, 2009, 73:4, 499–511. Guiso, L., P. Sapienza, and L. Zingales. The Determinants of Attitudes towards Strategic Default on Mortgages. Journal of Finance, 2013, 68:4, 1473–1515. Hayward, J. Facebook Turns 700,000 Users into Lab Rats for a Psychological Experiment. From: http://www.breitbart.com/InstaBlog/2014/07/03/Facebook-turns-700-000-usersinto-lab-rats-for-a-psychology-experiment. 2014. Accessed on July 11, 2015. Keynes, J. The General Theory of Employment, Interest, and Money. New York: Harcourt Brace & World, 1965. Marsden, P. Memetics and Social Contagion: Two Sides of the Same Coin? Journal of Memetics, 1998, 2:2, 68–86.
U s i n g
N e u r o l o g i c a l
E v i d e n c e
t o
D i f f e r e n t i a t e
u
4 7 1
Preuschoff, K., S. Quartz, and P. Bossaerts. Human Insula Activation Reflects Risk Prediction Errors as well as Risk. Journal of Neuroscience, 2008, 28:1, 2745–52. Rogers, E. Diffusion of Innovation. New York: Free Press, 1962. Seiler, M., M. Lane, and D. Harrison. Mimetic Herding Behavior and the Decision to Strategically Default. Journal of Real Estate Finance and Economics, 2014, 49:4, 621–53. Wheaton, W., G. Nechayev, and M.J. Seiler. Rebalancing the U.S. Housing Market: Two Proposals. Real Estate Finance, 2015, 32:3, 83–85. White, B. Underwater and Not Walking Away: Shame, Fear, and the Social Management of the Housing Crisis. Wake Forest Law Review, 2010, 45, 971–1023. Wyman, O. Understanding Strategic Default in Mortgages. Experian Report, 2010. Zandbelt, B., T. Gladwin, M. Raemaekers, M. van Buuren, S. Neggers, R. Kahn, N. Ramsey, and M. Vink. Within-subject Variation in BOLD-fMRI Signal Changes Across Repeated Measurements: Quantification and Implications for Sample Size. Neuroimage, 2008, 42:1, 196–206.
Michael J. Seiler, College of William & Mary, Williamsburg, VA 23187-8795 or
[email protected]. Eric Walden, Texas Tech University, Lubbock, TX 79409 or
[email protected].
J R E R
u
Vo l .
3 8
u
N o .
3 – 2 0 1 6
This page intentionally left blank