Using Object-Oriented Metrics for Automatic Design Flaws Detection in Large Scale Systems How to Use Object-Oriented Metrics in the Early Stages of a Redesign Operation Dipl.-Ing. Radu Marinescu † “Politehnica” University in Timisoara Faculty of Automation and Computer Engineerring
1
Introduction
In the last decade the object-oriented paradigm has decisively influenced the world of software engineering. On the other hand, in spite of the large acceptance of this paradigm, at the beginning, the design principles and the intimate mechanisms of object-orientation were not yet precisely known, and this fact conducted to a lot of poor designed large scale OO systems. In other words, these applications mostly proved to be critical exactly in those aspects where object-oriented design should have offered its most expected benefits – e.g. high degree of code reuse, higher maintainability or flexibility, etc. The general tendency manifested in the last time is to redesign these older industrial object-oriented systems, so that they may take full advantage of the today’s knowledge in objectorientation, and thus improve the quality of their design. In the first stage of a redesign process it is needful to detect what are the design-flaws contained in the application and where are this flaws located. This diagnose task is usually called problem detection. The detection of design problems for large or very large systems is impossible to be fulfilled manually and must therefore be accomplished by automated methods. This paper presents the possibility of using object-oriented software metrics for the automatic detection of a set of design problems. We will illustrate the efficiency of this approach by discussing the conclusions of an experimental study that uses a set of three metrics for problem detection and applies them to three projects. These three metrics are “touching” three main aspects of object-oriented design, aspects that have an important impact on the quality of the systems – i.e. maintenance effort, class hierarchy layout and cohesion. For each of these metrics we will present the design flaw that it may detect – together with some of our experimental observations – and a possible redesign solution for that problem. The importance of this paper is increased by the fact that it contributes to the study of object-oriented metrics in a point where this is specially needed: the addition of new practical experience and the practical knowledge that derives from it, as the great lack of practical experience is well-known among the specialists.
2
The Case Study
In this study we used three different sites from two organizations. We will refer them in the next sections as Site A, Site B and Site C. Site B and C are two software components that are independent parts of a bigger project developed by the same company. We chose them this way in order to assure that the conclusions of this study possess a high degree of generality. Site A This site is an object oriented system produced under the Windows NT operating system, and developed in the Microsoft Visual C++ programming environment, in conjunction with the Microsoft Foundation Classes library (MFC). The system has 232 classes, and can be therefore considered a large-scale object oriented system. As it is developed more recently than the other two sites, and because it is developed using MSVC it uses many of the advanced C++ facilities (like templates) pure virtual classes that the other two sites are not using. Site B and Site C These two sites represent two object oriented systems produced under the SunOS operating system, and developed using an integrated C++ programming environment based on the GNU C/C++ compiler, and using a set of C++ and C libraries. Both software components are part of a large user interface(UI) project. The producer of this software is †
[email protected]. WWW: http://www.cs.utt.ro/~radum/
2
Using Object-Oriented Metrics for Automatic Design Flaws Detection in Large Scale Systems
one of the largest companies in the area of communications, and this application belongs to the area of telecom networks. This large application was split in a number of so-called subproducts. The component that contains the two sites (Site B and C) was intended to offer basic networking service to other subproducts. The major requirement of this UI subproduct was to assure concrete flexibility at the top-level UI. Concerning the dimensions of the two systems, we may say that Site B is a smaller component, including 20 classes, while Site C is a medium one with 63 classes. This work is part of the FAMOOS project (see http://www.iam.unibe.ch/~famoos/). The goal of the FAMOOS project is to develop a set of re-engineering techniques and tools to support the development of objectoriented frameworks.
3
Metrics Used for Design Flaws Detection
3.1
WMC – Weighted Method Count [Chid94]
Definition Consider a class C1, with methods M1, M2, .... , Mn that are defined in the class. Let c1, ...., cn be the complexity of the methods of that class. Then: WMC
=
n
∑
ci
i =1
Observation The notion of complexity is deliberately not defined more specifically in order to raise the generality degree of the WMC metric. One possible way to define complexity more specific is to use some traditional static complexity metrics like the McCabe's Cyclomatic Complexity Metric [McCa76]. This was suggested by Li & Henry [LiHe93]. Another way to define complexity is to consider each metric having a unitary complexity. Then WMC = n, is the number of methods (NOM) in that class. Results Summary The metric was studied using the two definitions of complexity mentioned before: Site Name Site A Site A Site B Site B Site C Site C
Complexity Definition Minimum Average Maximum McCabe 0 21 222 Unitary 0 13 113 McCabe 0 21 99 Unitary 0 10 34 McCabe 0 56 393 Unitary 0 16 87 Table 1: Summary Statistics for the WMC metric
Experimental Observations 1. A general observation is that for all sites the most of the classes are simple, and the number of the outliers are few, but having very high values. 2. In all cases the outliers proved to be the central classes of the application. 3. The top of the outliers is, in some situations, e.g. Site C, strongly influenced by the way we choose the definition of complexity. The results obtained using the unitary complexity definition proved to be less relevant than McCabe’s complexity. Therefore, we would not recommend the use of the unitary complexity definition, but instead use some other complexity definition. Conclusions The metric proved to be a good indicator of the maintenance effort by indicating correctly the classes that are more error prone. In terms of problem detection, we may assert that classes with very high WMC values are critical in respect of the maintenance effort and they might be therefore redesigned in order to reduce the overall complexity level of the class. The WMC value for a class may be reduced in two different ways: by splitting the class or by splitting one or more of its very complex methods. A second conclusion is based on the observation that in all of the studied projects the classes with the highest WMC values were the central classes in the project. This relation can be exploited at the beginning of a redesign operation for a foreign project in order to detect the central classes. This is very useful as it is recommended to start the
3 Marinescu
Radu
analysis of an application at the central classes. We may affirm that WMC can offer an important support in this aspect.
3.2
NOC – Number of Children [Chid94]
Definition The Number of Children (NOC) represents the number of immediate subclasses subordinated to a class in the class hierarchy. Results Summary Site Name Minimum Average Maximum Site A 0 0.38 6 Site B 0 0.10 2 Site C 0 0.11 7 Table 2: Summary Statistics for the NOC metric Experimental Observations 1. All three sites present the same aspect: most of the classes tend to have no children (67% in Site A; 95% Site B and 98% Site C) or very few children. It is obvious that the producer of Site B and C is not using the facility of subclassing almost at all. This may be a design practice or a sign of lack of communication among the programmers who implemented these two sites. 2. On the other hand the outlier of Site C is extremely high relative to the other classes. That class should be carefully analyzed in order to see if there is no possibility of reducing its NOC value. The same thing is valid for all the sites, and may be a practical advice for project managers. Correlation between WMC and NOC An interesting and useful correlation can be made between the results of WMC and NOC, concerning those classes with very high values for both WMC and NOC. Such classes are in fact high complexity classes situated at the top of the class hierarchy. These are potentially influencing all the classes derived from them and therefore it is not at all desirable to have such classes in a project. They are in most of the cases signs of a poor design, and should be normally redesigned. We plan to study more closely in the future the possibility of detecting critical classes in a project based on a new metric defined as a combination of WMC and NOC. Conclusion This metric may be used in order to detect misuses of subclassing, and in many cases this means that the class hierarchy has to be restructured at that point during the redesign operation. We have detected two particular situations of high NOC values that could be redesigned: • Insufficient exploitation of common characteristics – In many cases the common characteristics of classes are not properly exploited. For example, Chidamber and Kemerer mentioned the case of a GUIcommand class for which all possible commands were subclasses. Further, none of this derived classes had any classes derived from them. A systematic use of NOC metric in the design phase could have helped to restructure the class hierarchy by grouping the different types of commands (e.g. text commands, mouse commands etc.) [Chid94] • Root of the class hierarchy – in all studied cases this class is very simple and has a very large number of children compared to the rest of the classes. The designer may sometimes think about transforming the hierarchy tree in a hierarchy forest. This might be useful for a better handling of the major parts of system, as each hierarchy tree stands for such a major part.
3.3
TCC – Tight Class Cohesion [Biem95]
Definitions The authors define this measure of class cohesion based on the direct connections of method pairs. Let NP(C) be the total number of pairs of abstract methods in class C.. If there are n methods in class C, then: n ⋅ ( n − 1) NP (C ) = 2 Two methods are directly connected if they access a common instance variable. Let NDC(C) be the number of direct connections for class C.
4
Using Object-Oriented Metrics for Automatic Design Flaws Detection in Large Scale Systems
The Tight Class Cohesion (TCC) metric is the relative number of directly connected methods. Formally this can be expressed as: TCC ( C ) =
NDC ( C ) NP ( C )
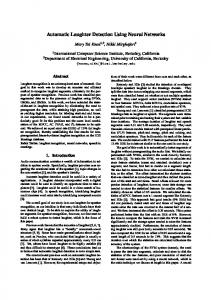
Observation The values of TCC are normalized in the range between [0,1]. The higher the value of TCC for a class is, the stronger will be the cohesion of that class, and consequently the better will be its design. Results Summary Site Name Minimum Average Maximum Site A 0 0.43 1 Site B 0 0.42 1 Site C 0.1 0.46 1 Table 3: Summary Statistics for the TCC metric Experimental Observations 1. The metric proved to be very effective for the classes built on the “classic” model of object-orientation, i.e. classes centered on data-structures, being manipulated by the use of get-put methods. In most cases these are container classes that have been created using design tools like OMT. On the other hand, this metric has proven to be not very effective on classes that are using – mostly by means of inheritance – elements from predefined libraries (like MFC), because in this case many of the methods are not coupled through data structures; the methods are more semantically related. 2. Classes with a big number of methods have in 99% of the cases a low TCC cohesion value. But the reciprocal is not true to the same degree, i.e. we found in Site B and in Site A classes with TCC = 0 having just a reduced number of methods (8 or less). 3. All of the three analyzed sites, although having a very different number of classes and implementing different types of applications, have very similar results. The average value is very close to 0.5 Increasing Cohesion by Class Splitting In Site A we found a container class with a very low TCC value. The reason was the specific type of implementation of that class. Any container class needs functions acting on two levels: a set of low-level methods that manipulate directly the data-structure (list, table etc.) and a set of high-level methods, that do not act directly on the data structure but by invoking the low-level methods. For that class with low TCC, the designer has decided to include all the methods in one single class. This initial situation is illustrated in a simplified manner in the left side of Figure 1. Methods M1, M2, M3 represent the high-level methods, while M4, M5, M6 represent the low-level ones accessing the data member D
Figure 1: A simplified example that illustrates the increasing of cohesion by class splitting One method of improving the degree of cohesion is by splitting the initial class (Class_init) in two classes (see right side of Figure 1). The one class (Class_low) contains only the initial data-structure and the low-level methods, while the other one (Class_high) includes the formerly considered “high-level” methods together with an instance of the new created low-level class, that will be accessed by these methods. This way, the cohesion degree of the two new classes has significantly increased.
5 Marinescu
Radu
The advantages of splitting non-cohesive classes are: • Comprehensibility. Classes are easier to be understand, as there is a clearer delimitation of the functionality and structure of each class. • Reusability and Flexibility. It is expected that implementing a container class in this improved manner will raise the possibility of an easier reuse and increases the flexibility of that container. Conclusion Classes that have a TCC-value lower than 0.5 (sometimes 0.3) are candidate classes for a redesign process. The redesign consists in a possible splitting of the class in two or more smaller and more cohesive classes. From another perspective subjects with a low TCC may indicate classes that encapsulate more than one functionality. In other words, the design flaw that can be detected using TCC is the lack of cohesion, and one concrete way to reduce or eliminate it might be the splitting of the class.
4
Conclusions and Future Work
This study has indicated that metrics can be efficiently used for the automatic detection of design flaws, and more generally they can be useful tools in the early stages of re-engineering operations on large systems. We have presented how, by using the WMC metric, excessive class complexity can be detected, how NOC can help us in detecting the misuse of subclassing, and how the TCC metric can be useful in finding the classes with lack of cohesion. On the other hand, we should not forget that metrics will never be able to offer us 100% precise results; metrics will always be useful hints, but never firm certainties (certitudini??????????). A human mind will always be necessary to take the final decision in re-engineering matters. It is also strongly necessary to let the conclusions of this study be validated by more experimental studies made on other large scale systems. From our perspective this study constitutes only a small step on the long road of the future research that will prove the advantages of using object-oriented metrics in automatic problem detection. In discussing the results of the NOC metric we have pointed out to some possible future developments of this study. A future study may also analyze a possible correlation between WMC and TCC metric, in order to find out if there is any relationship between classes with increased complexity and those with small cohesion. We also look forward to develop metrics-based approaches for automatic design flaws detection on other important aspects of the object-oriented design (e.g. coupling).
5
References
[Biem95]
J.M. Bieman, B.K. Kang. Cohesion and Reuse in an Object-Oriented System. Proc. ACM Symposium on Software Reusability, April 1995.
[Bria97]
L. Briand, J. Daly, J. Wuerst. A Unified Framework for Cohesion Measurement in ObjectOriented Systems. Fraunhofer Institute for Experimental Software Engineering, Germany, 1997 – ISERN-97-05
[Chid94]
S.R. Chidamber, C.F. Kemerer. A metrics Suite for Object Oriented Design. IEEE Transactions on Software Engineering, Vol.20, No.6, June 1994.
[LiHe93]
W. Li, S. Henry. Maintenance Metrics for the Object Oriented Paradigm. IEEE Proc. First International Software Metrics Symp., pp. 52-60, May 21-22, 1993.
[McCa76]
T.J. McCabe. A Complexity Measure. IEEE Trans. Software Eng., Vol. 2, No. 4, December, 1976.